Races in Plattsmouth, Nebraska (NE) Detailed Stats
Data:
Races - White alone (%)
Races - White alone (% change since 2000)
Races - Black alone (%)
Races - Black alone (% change since 2000)
Races - American Indian alone (%)
Races - American Indian alone (% change since 2000)
Races - Asian alone (%)
Races - Asian alone (% change since 2000)
Races - Hispanic (%)
Races - Hispanic (% change since 2000)
Races - Native Hawaiian and Other Pacific Islander alone (%)
Races - Native Hawaiian and Other Pacific Islander alone (% change since 2000)
Races - Two or more races(%)
Races - Two or more races(% change since 2000)
Races - Other race alone (%)
Races - Other race alone (% change since 2000)
Racial diversity
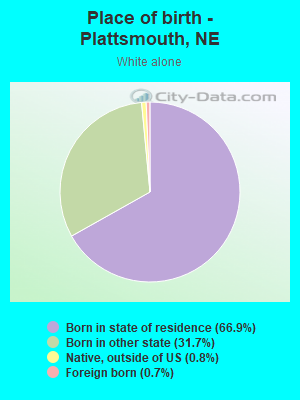
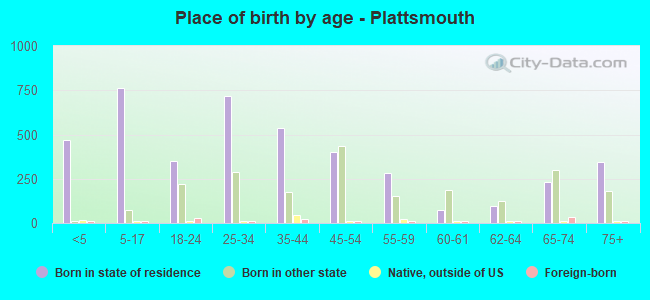
Place of birth - Born in state of residence (%)
Place of birth - Born in state of residence (%) - White
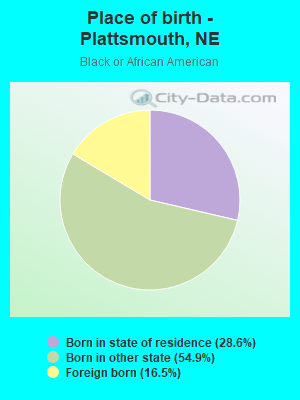
Place of birth - Born in state of residence (%) - Black or African American
Place of birth - Born in state of residence (%) - Asian
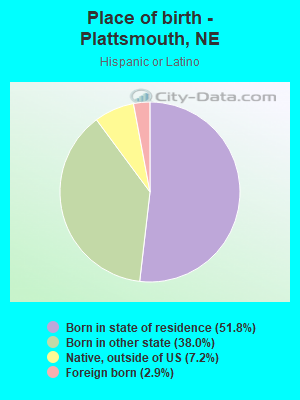
Place of birth - Born in state of residence (%) - Hispanic or Latino
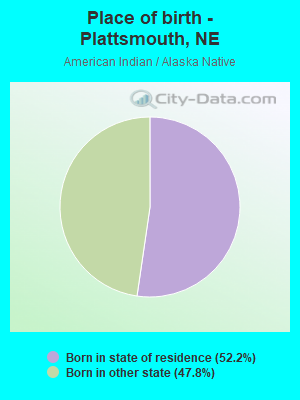
Place of birth - Born in state of residence (%) - American Indian and Alaska Native
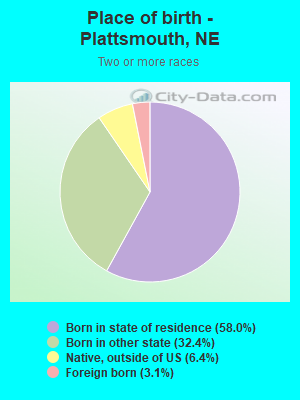
Place of birth - Born in state of residence (%) - Multirace
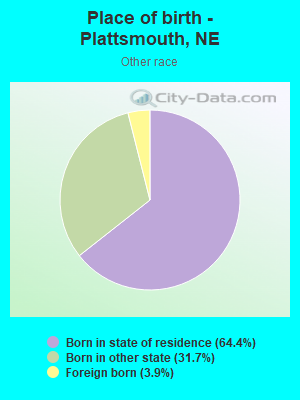
Place of birth - Born in state of residence (%) - Other Race
Place of birth - Born in other state (%)
Place of birth - Born in other state (%) - White
Place of birth - Born in other state (%) - Black or African American
Place of birth - Born in other state (%) - Asian
Place of birth - Born in other state (%) - Hispanic or Latino
Place of birth - Born in other state (%) - American Indian and Alaska Native
Place of birth - Born in other state (%) - Multirace
Place of birth - Born in other state (%) - Other Race
Place of birth - Native, outside of US (%)
Place of birth - Native, outside of US (%) - White
Place of birth - Native, outside of US (%) - Black or African American
Place of birth - Native, outside of US (%) - Asian
Place of birth - Native, outside of US (%) - Hispanic or Latino
Place of birth - Native, outside of US (%) - American Indian and Alaska Native
Place of birth - Native, outside of US (%) - Multirace
Place of birth - Native, outside of US (%) - Other Race
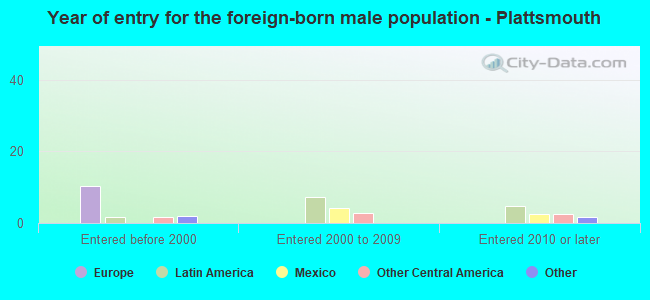
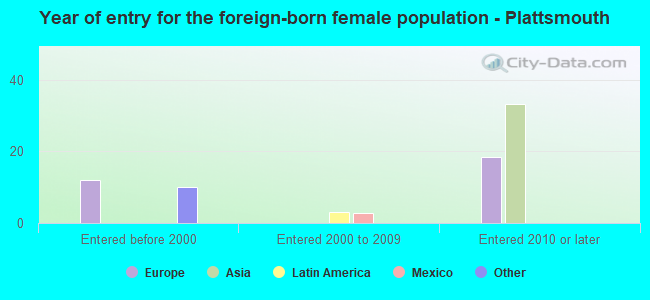
Place of birth - Foreign born (%)
Place of birth - Foreign born (%) - White
Place of birth - Foreign born (%) - Black or African American
Place of birth - Foreign born (%) - Asian
Place of birth - Foreign born (%) - Hispanic or Latino
Place of birth - Foreign born (%) - American Indian and Alaska Native
Place of birth - Foreign born (%) - Multirace
Place of birth - Foreign born (%) - Other Race
Residents speaking English at home (%)
Residents speaking English at home - Born in the United States (%)
Residents speaking English at home - Native, born elsewhere (%)
Residents speaking English at home - Foreign born (%)
Residents speaking Spanish at home (%)
Residents speaking Spanish at home - Born in the United States (%)
Residents speaking Spanish at home - Native, born elsewhere (%)
Residents speaking Spanish at home - Foreign born (%)
Residents speaking other language at home (%)
Residents speaking other language at home - Born in the United States (%)
Residents speaking other language at home - Native, born elsewhere (%)
Residents speaking other language at home - Foreign born (%)
Marital status - Never married (%)
Marital status - Now married (%)
Marital status - Separated (%)
Marital status - Widowed (%)
Marital status - Divorced (%)
Ancestries Reported - Arab (%)
Ancestries Reported - Czech (%)
Ancestries Reported - Danish (%)
Ancestries Reported - Dutch (%)
Ancestries Reported - English (%)
Ancestries Reported - French (%)
Ancestries Reported - French Canadian (%)
Ancestries Reported - German (%)
Ancestries Reported - Greek (%)
Ancestries Reported - Hungarian (%)
Ancestries Reported - Irish (%)
Ancestries Reported - Italian (%)
Ancestries Reported - Lithuanian (%)
Ancestries Reported - Norwegian (%)
Ancestries Reported - Polish (%)
Ancestries Reported - Portuguese (%)
Ancestries Reported - Russian (%)
Ancestries Reported - Scotch-Irish (%)
Ancestries Reported - Scottish (%)
Ancestries Reported - Slovak (%)
Ancestries Reported - Subsaharan African (%)
Ancestries Reported - Swedish (%)
Ancestries Reported - Swiss (%)
Ancestries Reported - Ukrainian (%)
Ancestries Reported - United States (%)
Ancestries Reported - Welsh (%)
Ancestries Reported - West Indian (%)
Ancestries Reported - Other (%)
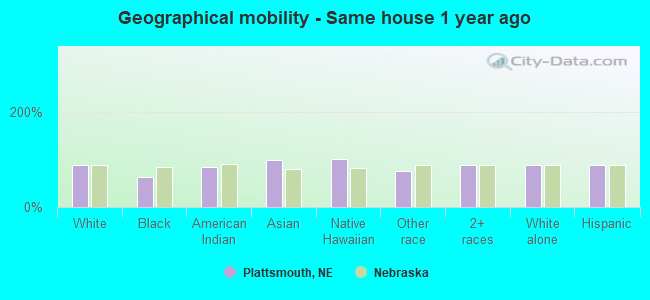
Geographical mobility - Same house 1 year ago (%)
Geographical mobility - Same house 1 year ago (%) - White
Geographical mobility - Same house 1 year ago (%) - Black or African American
Geographical mobility - Same house 1 year ago (%) - Asian
Geographical mobility - Same house 1 year ago (%) - Hispanic or Latino
Geographical mobility - Same house 1 year ago (%) - American Indian and Alaska Native
Geographical mobility - Same house 1 year ago (%) - Multirace
Geographical mobility - Same house 1 year ago (%) - Other Race
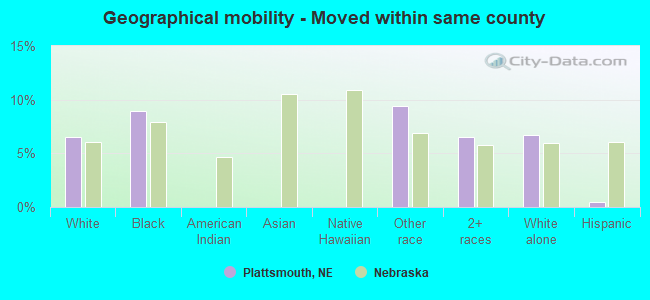
Geographical mobility - Moved within same county (%)
Geographical mobility - Moved within same county (%) - White
Geographical mobility - Moved within same county (%) - Black or African American
Geographical mobility - Moved within same county (%) - Asian
Geographical mobility - Moved within same county (%) - Hispanic or Latino
Geographical mobility - Moved within same county (%) - American Indian and Alaska Native
Geographical mobility - Moved within same county (%) - Multirace
Geographical mobility - Moved within same county (%) - Other Race
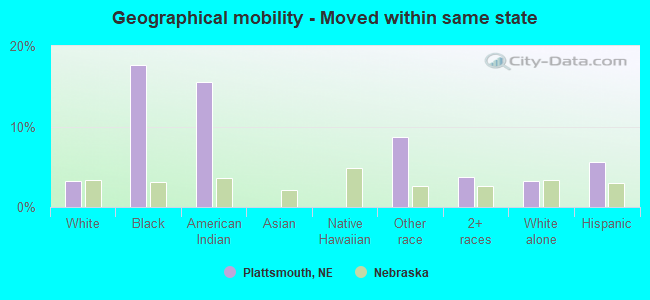
Geographical mobility - Moved from different county within same state (%)
Geographical mobility - Moved from different county within same state (%) - White
Geographical mobility - Moved from different county within same state (%) - Black or African American
Geographical mobility - Moved from different county within same state (%) - Asian
Geographical mobility - Moved from different county within same state (%) - Hispanic or Latino
Geographical mobility - Moved from different county within same state (%) - American Indian and Alaska Native
Geographical mobility - Moved from different county within same state (%) - Multirace
Geographical mobility - Moved from different county within same state (%) - Other Race
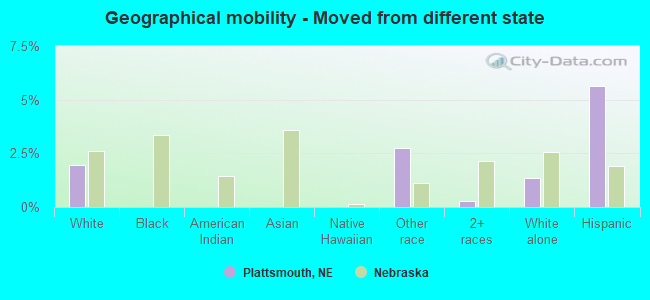
Geographical mobility - Moved from different state (%)
Geographical mobility - Moved from different state (%) - White
Geographical mobility - Moved from different state (%) - Black or African American
Geographical mobility - Moved from different state (%) - Asian
Geographical mobility - Moved from different state (%) - Hispanic or Latino
Geographical mobility - Moved from different state (%) - American Indian and Alaska Native
Geographical mobility - Moved from different state (%) - Multirace
Geographical mobility - Moved from different state (%) - Other Race
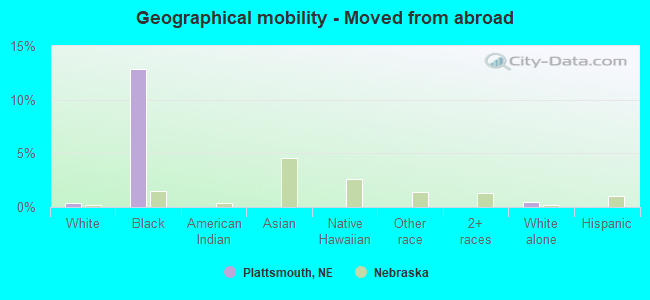
Geographical mobility - Moved from abroad (%)
Geographical mobility - Moved from abroad (%) - White
Geographical mobility - Moved from abroad (%) - Black or African American
Geographical mobility - Moved from abroad (%) - Asian
Geographical mobility - Moved from abroad (%) - Hispanic or Latino
Geographical mobility - Moved from abroad (%) - American Indian and Alaska Native
Geographical mobility - Moved from abroad (%) - Multirace
Geographical mobility - Moved from abroad (%) - Other Race
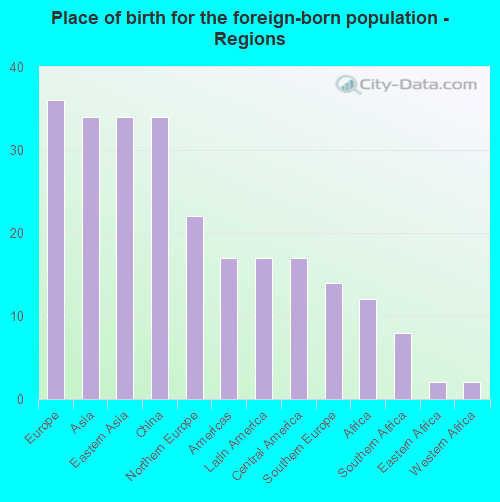
Place of birth for the foreign-born population - Ireland (%)
Place of birth for the foreign-born population - Denmark (%)
Place of birth for the foreign-born population - Norway (%)
Place of birth for the foreign-born population - Sweden (%)
Place of birth for the foreign-born population - United Kingdom (%)
Place of birth for the foreign-born population - England (%)
Place of birth for the foreign-born population - Scotland (%)
Place of birth for the foreign-born population - Other Northern Europe (%)
Place of birth for the foreign-born population - Austria (%)
Place of birth for the foreign-born population - Belgium (%)
Place of birth for the foreign-born population - France (%)
Place of birth for the foreign-born population - Germany (%)
Place of birth for the foreign-born population - Netherlands (%)
Place of birth for the foreign-born population - Switzerland (%)
Place of birth for the foreign-born population - Other Western Europe (%)
Place of birth for the foreign-born population - Greece (%)
Place of birth for the foreign-born population - Italy (%)
Place of birth for the foreign-born population - Portugal (%)
Place of birth for the foreign-born population - Spain (%)
Place of birth for the foreign-born population - Other Southern Europe (%)
Place of birth for the foreign-born population - Albania (%)
Place of birth for the foreign-born population - Belarus (%)
Place of birth for the foreign-born population - Bosnia and Herzegovina (%)
Place of birth for the foreign-born population - Bulgaria (%)
Place of birth for the foreign-born population - Croatia (%)
Place of birth for the foreign-born population - Czechoslovakia (%)
Place of birth for the foreign-born population - Hungary (%)
Place of birth for the foreign-born population - Latvia (%)
Place of birth for the foreign-born population - Lithuania (%)
Place of birth for the foreign-born population - North Macedonia (Macedonia) (%)
Place of birth for the foreign-born population - Moldova (%)
Place of birth for the foreign-born population - Poland (%)
Place of birth for the foreign-born population - Romania (%)
Place of birth for the foreign-born population - Russia (%)
Place of birth for the foreign-born population - Serbia (%)
Place of birth for the foreign-born population - Ukraine (%)
Place of birth for the foreign-born population - Other Eastern Europe (%)
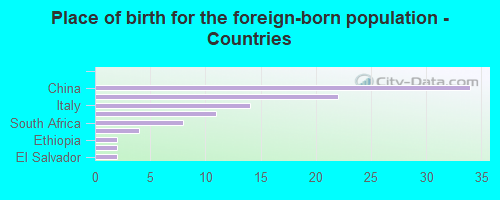
Place of birth for the foreign-born population - China (%)
Place of birth for the foreign-born population - Hong Kong (%)
Place of birth for the foreign-born population - Taiwan (%)
Place of birth for the foreign-born population - Japan (%)
Place of birth for the foreign-born population - Korea (%)
Place of birth for the foreign-born population - Other Eastern Asia (%)
Place of birth for the foreign-born population - Afghanistan (%)
Place of birth for the foreign-born population - Bangladesh (%)
Place of birth for the foreign-born population - India (%)
Place of birth for the foreign-born population - Iran (%)
Place of birth for the foreign-born population - Kazakhstan (%)
Place of birth for the foreign-born population - Nepal (%)
Place of birth for the foreign-born population - Pakistan (%)
Place of birth for the foreign-born population - Sri Lanka (%)
Place of birth for the foreign-born population - Uzbekistan (%)
Place of birth for the foreign-born population - Other South Central Asia (%)
Place of birth for the foreign-born population - Burma (%)
Place of birth for the foreign-born population - Cambodia (%)
Place of birth for the foreign-born population - Indonesia (%)
Place of birth for the foreign-born population - Laos (%)
Place of birth for the foreign-born population - Malaysia (%)
Place of birth for the foreign-born population - Philippines (%)
Place of birth for the foreign-born population - Singapore (%)
Place of birth for the foreign-born population - Thailand (%)
Place of birth for the foreign-born population - Vietnam (%)
Place of birth for the foreign-born population - Other South Eastern Asia (%)
Place of birth for the foreign-born population - Armenia (%)
Place of birth for the foreign-born population - Iraq (%)
Place of birth for the foreign-born population - Israel (%)
Place of birth for the foreign-born population - Jordan (%)
Place of birth for the foreign-born population - Kuwait (%)
Place of birth for the foreign-born population - Lebanon (%)
Place of birth for the foreign-born population - Saudi Arabia (%)
Place of birth for the foreign-born population - Syria (%)
Place of birth for the foreign-born population - Turkey (%)
Place of birth for the foreign-born population - Yemen (%)
Place of birth for the foreign-born population - Other Western Asia (%)
Place of birth for the foreign-born population - Eritrea (%)
Place of birth for the foreign-born population - Ethiopia (%)
Place of birth for the foreign-born population - Kenya (%)
Place of birth for the foreign-born population - Somalia (%)
Place of birth for the foreign-born population - Uganda (%)
Place of birth for the foreign-born population - Zimbabwe (%)
Place of birth for the foreign-born population - Other Eastern Africa (%)
Place of birth for the foreign-born population - Cameroon (%)
Place of birth for the foreign-born population - Congo (%)
Place of birth for the foreign-born population - Democratic Republic of Congo (Zaire) (%)
Place of birth for the foreign-born population - Other Middle Africa (%)
Place of birth for the foreign-born population - Egypt (%)
Place of birth for the foreign-born population - Morocco (%)
Place of birth for the foreign-born population - Sudan (%)
Place of birth for the foreign-born population - Other Northern Africa (%)
Place of birth for the foreign-born population - South Africa (%)
Place of birth for the foreign-born population - Other Southern Africa (%)
Place of birth for the foreign-born population - Cabo Verde (%)
Place of birth for the foreign-born population - Ghana (%)
Place of birth for the foreign-born population - Liberia (%)
Place of birth for the foreign-born population - Nigeria (%)
Place of birth for the foreign-born population - Senegal (%)
Place of birth for the foreign-born population - Sierra Leone (%)
Place of birth for the foreign-born population - Other Western Africa (%)
Place of birth for the foreign-born population - Australia (%)
Place of birth for the foreign-born population - New Zealand (%)
Place of birth for the foreign-born population - Fiji (%)
Place of birth for the foreign-born population - Micronesia (%)
Place of birth for the foreign-born population - Bahamas (%)
Place of birth for the foreign-born population - Barbados (%)
Place of birth for the foreign-born population - Cuba (%)
Place of birth for the foreign-born population - Dominica (%)
Place of birth for the foreign-born population - Dominican Republic (%)
Place of birth for the foreign-born population - Grenada (%)
Place of birth for the foreign-born population - Haiti (%)
Place of birth for the foreign-born population - Jamaica (%)
Place of birth for the foreign-born population - St. Vincent and the Grenadines (%)
Place of birth for the foreign-born population - Trinidad and Tobago (%)
Place of birth for the foreign-born population - West Indies (%)
Place of birth for the foreign-born population - Other Caribbean (%)
Place of birth for the foreign-born population - Belize (%)
Place of birth for the foreign-born population - Costa Rica (%)
Place of birth for the foreign-born population - El Salvador (%)
Place of birth for the foreign-born population - Guatemala (%)
Place of birth for the foreign-born population - Honduras (%)
Place of birth for the foreign-born population - Mexico (%)
Place of birth for the foreign-born population - Nicaragua (%)
Place of birth for the foreign-born population - Panama (%)
Place of birth for the foreign-born population - Other Central America (%)
Place of birth for the foreign-born population - Argentina (%)
Place of birth for the foreign-born population - Bolivia (%)
Place of birth for the foreign-born population - Brazil (%)
Place of birth for the foreign-born population - Chile (%)
Place of birth for the foreign-born population - Colombia (%)
Place of birth for the foreign-born population - Ecuador (%)
Place of birth for the foreign-born population - Guyana (%)
Place of birth for the foreign-born population - Peru (%)
Place of birth for the foreign-born population - Uruguay (%)
Place of birth for the foreign-born population - Venezuela (%)
Place of birth for the foreign-born population - Other South America (%)
Place of birth for the foreign-born population - Canada (%)
Place of birth for the foreign-born population - Other Northern America (%)
Place of birth for the foreign-born population - Other (%)
Latest news about races in Plattsmouth, NE collected exclusively by city-data.com from local newspapers, TV, and radio stations
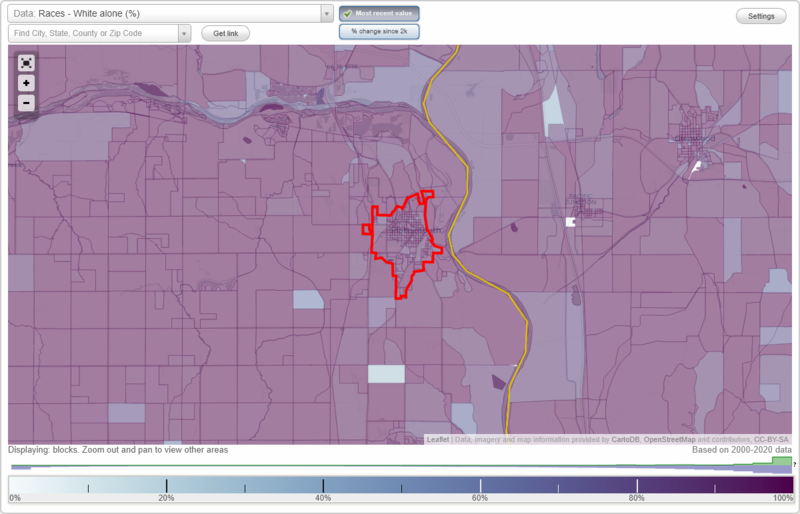
According to 2022 data, the most numerous races in Plattsmouth, NE are White alone (5,571 residents), Hispanic (556 residents), and Black alone (21 residents). 98.2% of Plattsmouth residents speak English at home. 1.5% of Plattsmouth, NE residents are foreign-born , which is 363.0% less than the foreign-born rate of 7.0% across the entire state of Nebraska.
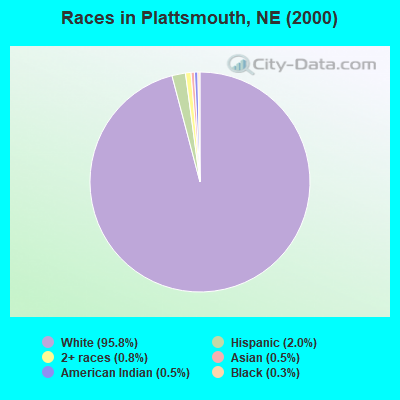
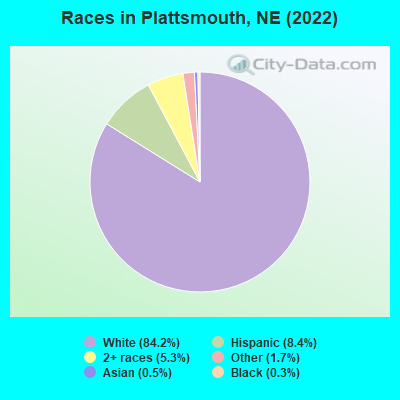
Race distribution in Plattsmouth
2000 2022
1,494,494 87.3% White alone 94,425 5.5% Hispanic 67,537 3.9% Black alone 21,677 1.3% Asian alone 17,696 1.0% Two or more races 13,460 0.8% American Indian alone 1,327 0.08% Other race alone 647 0.04% Native Hawaiian and Other
1,492,005 75.8% White alone 241,898 12.3% Hispanic 89,520 4.5% Black alone 76,499 3.9% Two or more races 49,261 2.5% Asian alone 10,249 0.5% American Indian alone 7,425 0.4% Other race alone 1,066 0.05% Native Hawaiian and Other
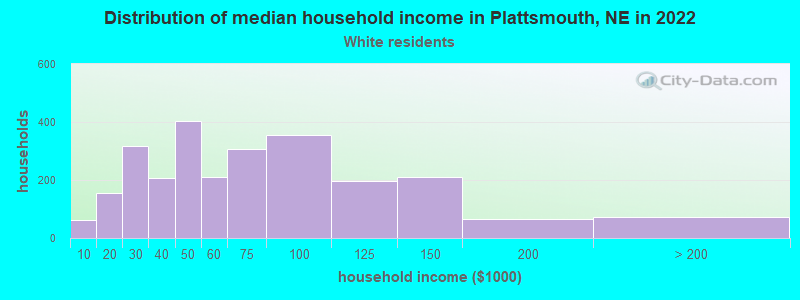
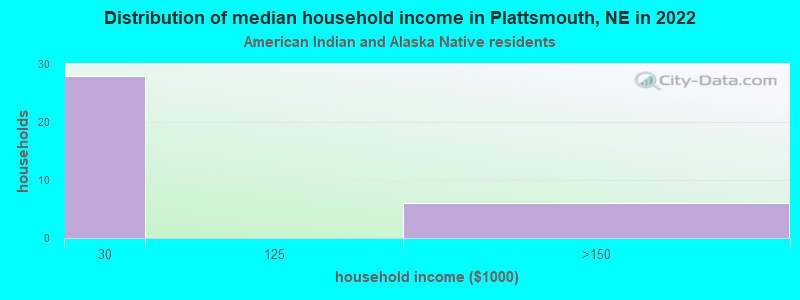
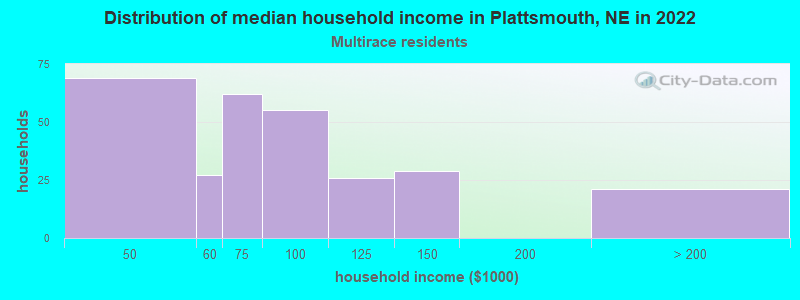
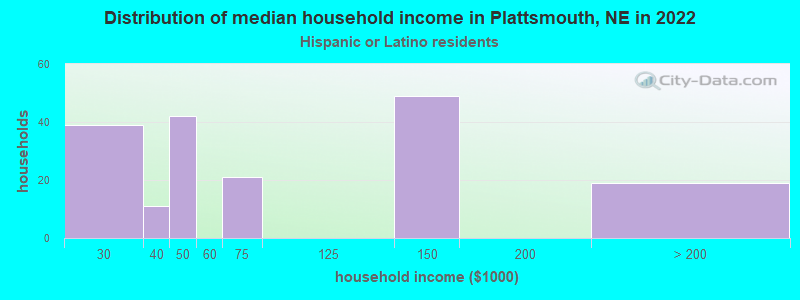
Income and house value in Plattsmouth Median household income in 2022 $56,263 White non-Hispanic householders$69,422 Two or more races householdersMedian 2022 house value $184,139 White Non-Hispanic householders$142,319 American Indian or Alaska Native householders $125,897 Asian householders$21,893 Some other race householders$180,636 Hispanic or Latino householders
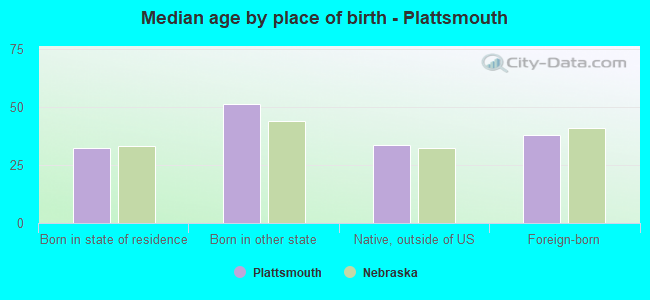
Median age by race in Plattsmouth
41.2 Median age for White residents38.1 47.7 45.4 Median age for Black or African American residents28.2 -677,489,176.8 32.1 Median age for American Indian / Alaska Native residents52.1 -802,973,976.9 -698,212,407.3 Median age for Asian residents-708,061,001.5 -691,206,543.3 -699,999,999.3 Median age for Native Hawaiian / Pacific Islander residents-672,108,842.9 -689,223,057.0 28.6 Median age for Other race residents10.8 30.4 29.5 Median age for Two or more races residents30.1 17.1 41.5 Median age for White alone residents38.1 47.7 29.4 Median age for Hispanic or Latino residents30.5 29.8
Owner/renter occupied households by race in Plattsmouth
House owners and renters - White residents 1,758 67.9% Owner occupied831 32.1% Renter occupiedHouse owners and renters - American Indian / Alaska Native residents 11 34.3% Owner occupied20 65.7% Renter occupiedHouse owners and renters - Asian residents 21 100.0% Owner occupiedHouse owners and renters - Native Hawaiian / Pacific Islander residents 34 100.0% Renter occupiedHouse owners and renters - Other race residents 36 100.0% Owner occupiedHouse owners and renters - Two or more races residents 113 37.3% Owner occupied190 62.7% Renter occupiedHouse owners and renters - White alone residents 1,758 67.6% Owner occupied842 32.4% Renter occupiedHouse owners and renters - Hispanic or Latino residents 66 34.6% Owner occupied124 65.4% Renter occupied
Language usage in Plattsmouth
English speakers - Total 98.2% of residents of Plattsmouth speak English at home.
0.8% of residents speak Spanish at home 35 70.0% Speak English very well15 30.0% Speak English less than very well1.2% of residents speak other language at home 45 60.0% Speak English very well30 40.0% Speak English less than very well
English speakers - Born in the United States 99.1% of residents of Plattsmouth speak English at home.
1.2% of residents speak Spanish at home 26 100.0% Speak English very well0.1% of residents speak other language at home 2 100.0% Speak English very well
All residents speak only English at home
English speakers - Foreign-born 21.9% of residents of Plattsmouth speak English at home.
15.6% of residents speak Spanish at home 15 100.0% Speak English less than very well57.3% of residents speak other language at home 25 45.5% Speak English very well30 54.5% Speak English less than very well
White (Caucasian) - Speak only English Native:
100.0% (5,259)Foreign-born:
84.2% (18)
Black or African American - Speak only English Native:
98.7% (18)Foreign-born:
65.7% (2)
Other race - Speak another language Native:
3.8% (7)Foreign-born:
100.0% (10)
Two or more races - Speak another language Native:
11.1% (64)Foreign-born:
100.0% (22)
White alone - Speak only English Native:
99.9% (5,208)Foreign-born:
53.8% (20)
Hispanic or Latino - Speak another language Native:
6.8% (33)Foreign-born:
100.0% (17)
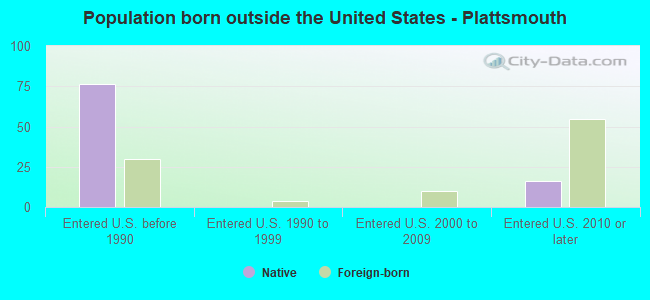
Foreign-born residents in Plattsmouth 100 residents are foreign born
This city:
1.5%Nebraska:
7.5%
Marital status for residents in Plattsmouth Marital status - White (Caucasian) population 15 years and over
Males 34.3% Never married49.7% Now married0.2% Separated5.2% Widowed10.6% DivorcedFemales 24.5% Never married48.9% Now married0.4% Separated12.8% Widowed13.4% DivorcedWomen who gave birth in the past 12 months Now married:
100.0% (89)Unmarried:
0.0% (0)
Women who did not give birth in the past 12 months Now married:
49.1% (541)Unmarried:
50.9% (560)
Marital status - Black or African American population 15 years and over
Males 55.6% Never married44.4% Now married0.0% Separated0.0% Widowed0.0% DivorcedFemales 23.1% Never married0.0% Now married0.0% Separated76.9% Widowed0.0% DivorcedWomen who did not give birth in the past 12 months Now married:
0.0% (0)Unmarried:
100.0% (3)
Marital status - American Indian / Alaska Native population 15 years and over
Males 46.2% Never married53.8% Now married0.0% Separated0.0% Widowed0.0% DivorcedFemales 100.0% Never married0.0% Now married0.0% Separated0.0% Widowed0.0% DivorcedWomen who did not give birth in the past 12 months Now married:
0.0% (0)Unmarried:
100.0% (17)
Marital status - Other race population 15 years and over
Males 5.3% Never married91.2% Now married3.5% Separated0.0% Widowed0.0% DivorcedFemales 0.0% Never married94.8% Now married0.0% Separated0.0% Widowed5.2% DivorcedWomen who did not give birth in the past 12 months Now married:
92.1% (42)Unmarried:
7.9% (4)
Marital status - Two or more races population 15 years and over
Males 22.8% Never married51.2% Now married0.9% Separated0.0% Widowed25.1% DivorcedFemales 53.3% Never married26.7% Now married0.0% Separated18.1% Widowed1.9% DivorcedWomen who did not give birth in the past 12 months Now married:
26.3% (29)Unmarried:
73.7% (80)
Marital status - White alone, not Hispanic / Latino population 15 years and over
Males 34.0% Never married49.8% Now married0.1% Separated5.3% Widowed10.8% DivorcedFemales 24.6% Never married48.3% Now married0.4% Separated13.1% Widowed13.7% DivorcedWomen who gave birth in the past 12 months Now married:
100.0% (85)Unmarried:
0.0% (0)
Women who did not give birth in the past 12 months Now married:
49.1% (548)Unmarried:
50.9% (568)
Marital status - Hispanic or Latino population 15 years and over
Males 40.3% Never married28.8% Now married2.6% Separated0.0% Widowed28.3% DivorcedFemales 45.2% Never married42.4% Now married0.0% Separated10.7% Widowed1.7% DivorcedWomen who gave birth in the past 12 months Now married:
100.0% (6)Unmarried:
0.0% (0)
Women who did not give birth in the past 12 months Now married:
36.6% (50)Unmarried:
63.4% (87)
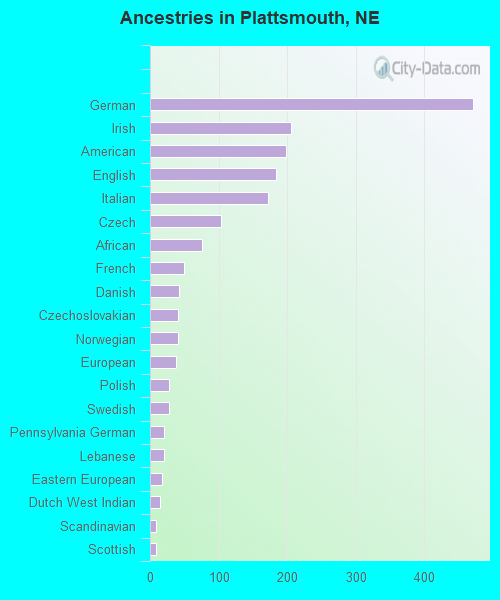
Ancestries in Plattsmouth
471 21.4% German205 9.3% Irish198 9.0% American184 8.4% English172 7.8% Italian104 4.7% Czech76 3.5% African49 2.2% French42 1.9% Danish41 1.9% Czechoslovakian41 1.9% Norwegian38 1.7% European27 1.2% Polish27 1.2% Swedish21 1.0% Pennsylvania German20 0.9% Lebanese17 0.8% Eastern European14 0.6% Dutch West Indian9 0.4% Scandinavian9 0.4% Scottish3 0.1% Nigerian1 0.05% Sudanese
Children Nativity (place of birth) in Plattsmouth
Children under 6 years - Living with two parents Both parents native 441 100.0% NativeOne native, one foreign-born parent 9 100.0% NativeChildren under 6 years - Living with one parent Native parent 106 100.0% Native
Children 6 to 17 years - Living with two parents Both parents native 539 100.0% NativeChildren 6 to 17 years - Living with one parent Native parent 187 100.0% Native