Races in Pratt, Kansas (KS) Detailed Stats
Data:
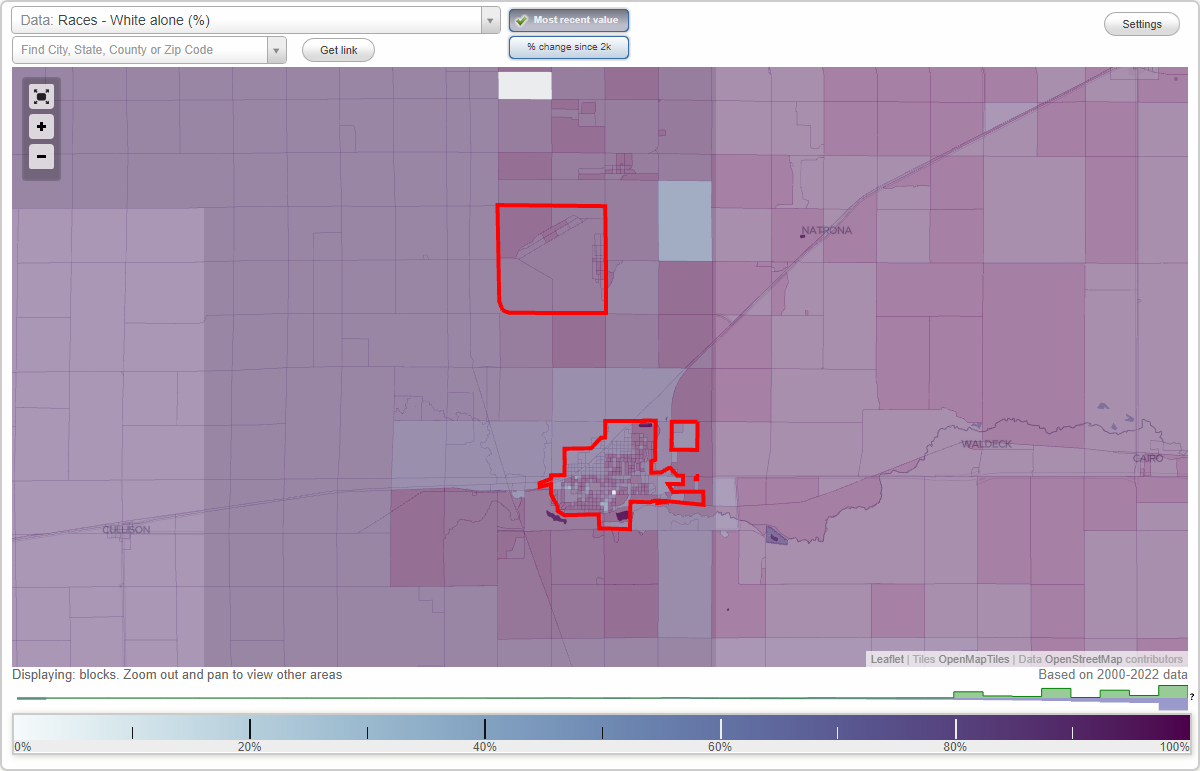
Races - White alone (%)
Races - White alone (% change since 2000)
Races - Black alone (%)
Races - Black alone (% change since 2000)
Races - American Indian alone (%)
Races - American Indian alone (% change since 2000)
Races - Asian alone (%)
Races - Asian alone (% change since 2000)
Races - Hispanic (%)
Races - Hispanic (% change since 2000)
Races - Native Hawaiian and Other Pacific Islander alone (%)
Races - Native Hawaiian and Other Pacific Islander alone (% change since 2000)
Races - Two or more races(%)
Races - Two or more races(% change since 2000)
Races - Other race alone (%)
Races - Other race alone (% change since 2000)
Racial diversity
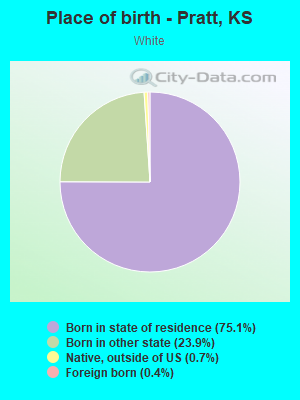
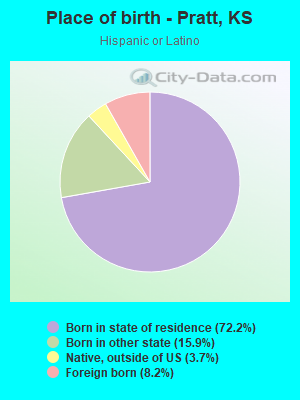
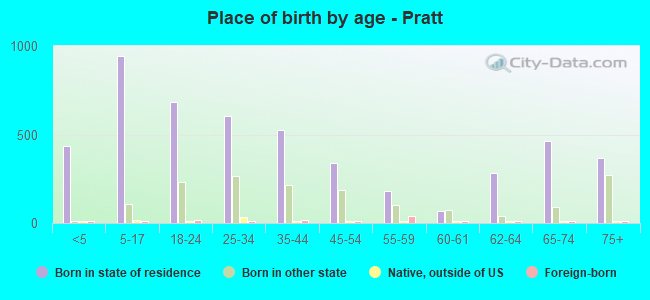
Place of birth - Born in state of residence (%)
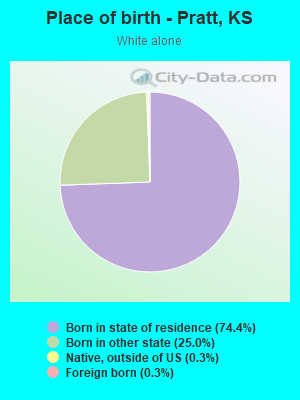
Place of birth - Born in state of residence (%) - White
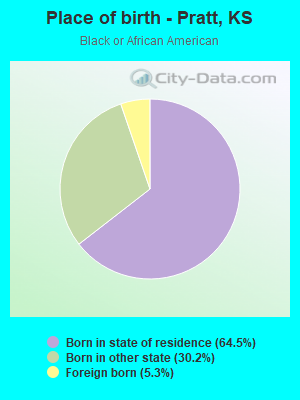
Place of birth - Born in state of residence (%) - Black or African American
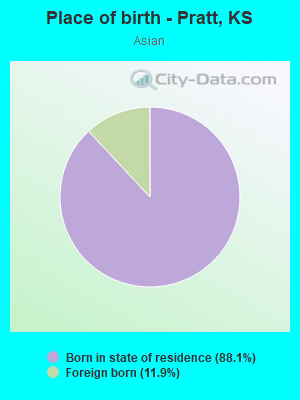
Place of birth - Born in state of residence (%) - Asian
Place of birth - Born in state of residence (%) - Hispanic or Latino
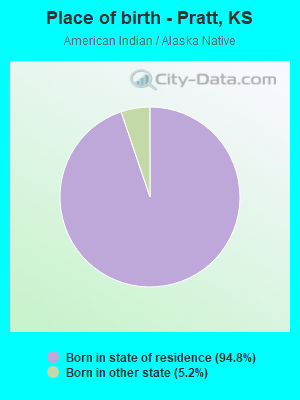
Place of birth - Born in state of residence (%) - American Indian and Alaska Native
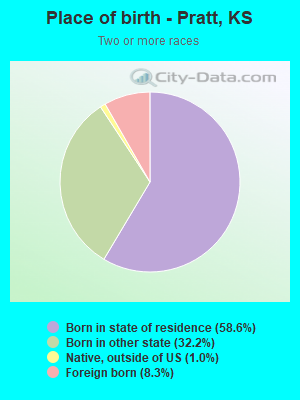
Place of birth - Born in state of residence (%) - Multirace
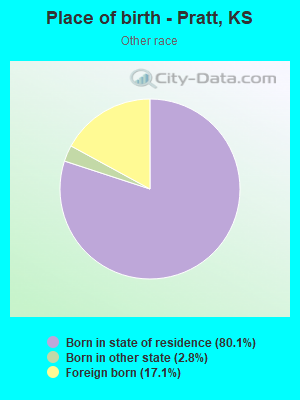
Place of birth - Born in state of residence (%) - Other Race
Place of birth - Born in other state (%)
Place of birth - Born in other state (%) - White
Place of birth - Born in other state (%) - Black or African American
Place of birth - Born in other state (%) - Asian
Place of birth - Born in other state (%) - Hispanic or Latino
Place of birth - Born in other state (%) - American Indian and Alaska Native
Place of birth - Born in other state (%) - Multirace
Place of birth - Born in other state (%) - Other Race
Place of birth - Native, outside of US (%)
Place of birth - Native, outside of US (%) - White
Place of birth - Native, outside of US (%) - Black or African American
Place of birth - Native, outside of US (%) - Asian
Place of birth - Native, outside of US (%) - Hispanic or Latino
Place of birth - Native, outside of US (%) - American Indian and Alaska Native
Place of birth - Native, outside of US (%) - Multirace
Place of birth - Native, outside of US (%) - Other Race
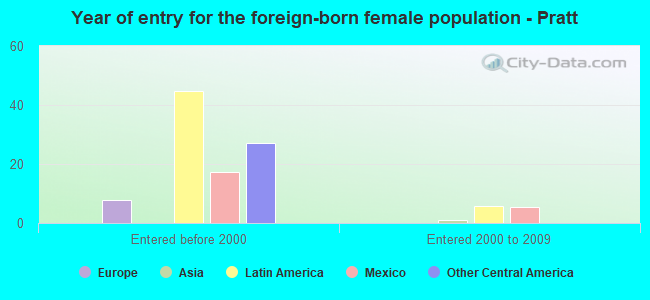
Place of birth - Foreign born (%)
Place of birth - Foreign born (%) - White
Place of birth - Foreign born (%) - Black or African American
Place of birth - Foreign born (%) - Asian
Place of birth - Foreign born (%) - Hispanic or Latino
Place of birth - Foreign born (%) - American Indian and Alaska Native
Place of birth - Foreign born (%) - Multirace
Place of birth - Foreign born (%) - Other Race
Residents speaking English at home (%)
Residents speaking English at home - Born in the United States (%)
Residents speaking English at home - Native, born elsewhere (%)
Residents speaking English at home - Foreign born (%)
Residents speaking Spanish at home (%)
Residents speaking Spanish at home - Born in the United States (%)
Residents speaking Spanish at home - Native, born elsewhere (%)
Residents speaking Spanish at home - Foreign born (%)
Residents speaking other language at home (%)
Residents speaking other language at home - Born in the United States (%)
Residents speaking other language at home - Native, born elsewhere (%)
Residents speaking other language at home - Foreign born (%)
Marital status - Never married (%)
Marital status - Now married (%)
Marital status - Separated (%)
Marital status - Widowed (%)
Marital status - Divorced (%)
Ancestries Reported - Arab (%)
Ancestries Reported - Czech (%)
Ancestries Reported - Danish (%)
Ancestries Reported - Dutch (%)
Ancestries Reported - English (%)
Ancestries Reported - French (%)
Ancestries Reported - French Canadian (%)
Ancestries Reported - German (%)
Ancestries Reported - Greek (%)
Ancestries Reported - Hungarian (%)
Ancestries Reported - Irish (%)
Ancestries Reported - Italian (%)
Ancestries Reported - Lithuanian (%)
Ancestries Reported - Norwegian (%)
Ancestries Reported - Polish (%)
Ancestries Reported - Portuguese (%)
Ancestries Reported - Russian (%)
Ancestries Reported - Scotch-Irish (%)
Ancestries Reported - Scottish (%)
Ancestries Reported - Slovak (%)
Ancestries Reported - Subsaharan African (%)
Ancestries Reported - Swedish (%)
Ancestries Reported - Swiss (%)
Ancestries Reported - Ukrainian (%)
Ancestries Reported - United States (%)
Ancestries Reported - Welsh (%)
Ancestries Reported - West Indian (%)
Ancestries Reported - Other (%)
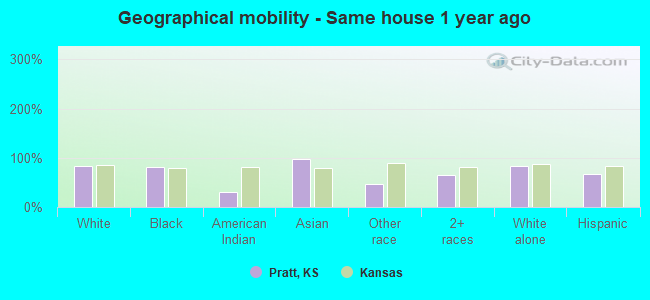
Geographical mobility - Same house 1 year ago (%)
Geographical mobility - Same house 1 year ago (%) - White
Geographical mobility - Same house 1 year ago (%) - Black or African American
Geographical mobility - Same house 1 year ago (%) - Asian
Geographical mobility - Same house 1 year ago (%) - Hispanic or Latino
Geographical mobility - Same house 1 year ago (%) - American Indian and Alaska Native
Geographical mobility - Same house 1 year ago (%) - Multirace
Geographical mobility - Same house 1 year ago (%) - Other Race
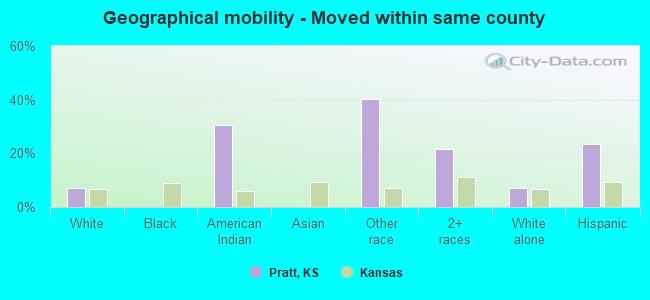
Geographical mobility - Moved within same county (%)
Geographical mobility - Moved within same county (%) - White
Geographical mobility - Moved within same county (%) - Black or African American
Geographical mobility - Moved within same county (%) - Asian
Geographical mobility - Moved within same county (%) - Hispanic or Latino
Geographical mobility - Moved within same county (%) - American Indian and Alaska Native
Geographical mobility - Moved within same county (%) - Multirace
Geographical mobility - Moved within same county (%) - Other Race
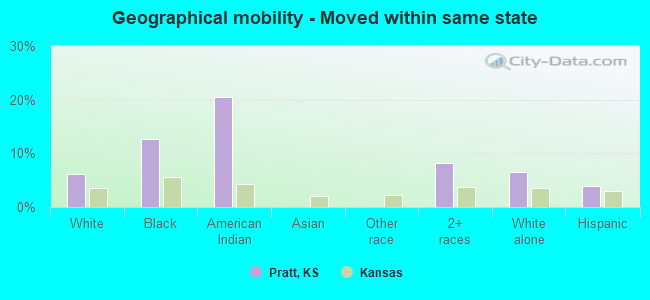
Geographical mobility - Moved from different county within same state (%)
Geographical mobility - Moved from different county within same state (%) - White
Geographical mobility - Moved from different county within same state (%) - Black or African American
Geographical mobility - Moved from different county within same state (%) - Asian
Geographical mobility - Moved from different county within same state (%) - Hispanic or Latino
Geographical mobility - Moved from different county within same state (%) - American Indian and Alaska Native
Geographical mobility - Moved from different county within same state (%) - Multirace
Geographical mobility - Moved from different county within same state (%) - Other Race
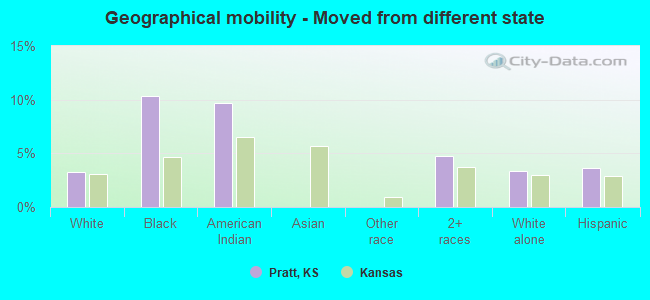
Geographical mobility - Moved from different state (%)
Geographical mobility - Moved from different state (%) - White
Geographical mobility - Moved from different state (%) - Black or African American
Geographical mobility - Moved from different state (%) - Asian
Geographical mobility - Moved from different state (%) - Hispanic or Latino
Geographical mobility - Moved from different state (%) - American Indian and Alaska Native
Geographical mobility - Moved from different state (%) - Multirace
Geographical mobility - Moved from different state (%) - Other Race
Geographical mobility - Moved from abroad (%)
Geographical mobility - Moved from abroad (%) - White
Geographical mobility - Moved from abroad (%) - Black or African American
Geographical mobility - Moved from abroad (%) - Asian
Geographical mobility - Moved from abroad (%) - Hispanic or Latino
Geographical mobility - Moved from abroad (%) - American Indian and Alaska Native
Geographical mobility - Moved from abroad (%) - Multirace
Geographical mobility - Moved from abroad (%) - Other Race
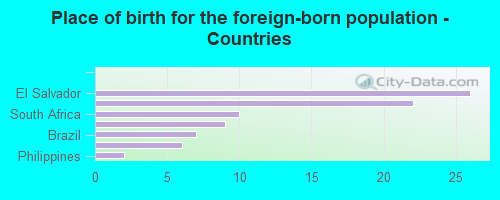
Place of birth for the foreign-born population - Ireland (%)
Place of birth for the foreign-born population - Denmark (%)
Place of birth for the foreign-born population - Norway (%)
Place of birth for the foreign-born population - Sweden (%)
Place of birth for the foreign-born population - United Kingdom (%)
Place of birth for the foreign-born population - England (%)
Place of birth for the foreign-born population - Scotland (%)
Place of birth for the foreign-born population - Other Northern Europe (%)
Place of birth for the foreign-born population - Austria (%)
Place of birth for the foreign-born population - Belgium (%)
Place of birth for the foreign-born population - France (%)
Place of birth for the foreign-born population - Germany (%)
Place of birth for the foreign-born population - Netherlands (%)
Place of birth for the foreign-born population - Switzerland (%)
Place of birth for the foreign-born population - Other Western Europe (%)
Place of birth for the foreign-born population - Greece (%)
Place of birth for the foreign-born population - Italy (%)
Place of birth for the foreign-born population - Portugal (%)
Place of birth for the foreign-born population - Spain (%)
Place of birth for the foreign-born population - Other Southern Europe (%)
Place of birth for the foreign-born population - Albania (%)
Place of birth for the foreign-born population - Belarus (%)
Place of birth for the foreign-born population - Bosnia and Herzegovina (%)
Place of birth for the foreign-born population - Bulgaria (%)
Place of birth for the foreign-born population - Croatia (%)
Place of birth for the foreign-born population - Czechoslovakia (%)
Place of birth for the foreign-born population - Hungary (%)
Place of birth for the foreign-born population - Latvia (%)
Place of birth for the foreign-born population - Lithuania (%)
Place of birth for the foreign-born population - North Macedonia (Macedonia) (%)
Place of birth for the foreign-born population - Moldova (%)
Place of birth for the foreign-born population - Poland (%)
Place of birth for the foreign-born population - Romania (%)
Place of birth for the foreign-born population - Russia (%)
Place of birth for the foreign-born population - Serbia (%)
Place of birth for the foreign-born population - Ukraine (%)
Place of birth for the foreign-born population - Other Eastern Europe (%)
Place of birth for the foreign-born population - China (%)
Place of birth for the foreign-born population - Hong Kong (%)
Place of birth for the foreign-born population - Taiwan (%)
Place of birth for the foreign-born population - Japan (%)
Place of birth for the foreign-born population - Korea (%)
Place of birth for the foreign-born population - Other Eastern Asia (%)
Place of birth for the foreign-born population - Afghanistan (%)
Place of birth for the foreign-born population - Bangladesh (%)
Place of birth for the foreign-born population - India (%)
Place of birth for the foreign-born population - Iran (%)
Place of birth for the foreign-born population - Kazakhstan (%)
Place of birth for the foreign-born population - Nepal (%)
Place of birth for the foreign-born population - Pakistan (%)
Place of birth for the foreign-born population - Sri Lanka (%)
Place of birth for the foreign-born population - Uzbekistan (%)
Place of birth for the foreign-born population - Other South Central Asia (%)
Place of birth for the foreign-born population - Burma (%)
Place of birth for the foreign-born population - Cambodia (%)
Place of birth for the foreign-born population - Indonesia (%)
Place of birth for the foreign-born population - Laos (%)
Place of birth for the foreign-born population - Malaysia (%)
Place of birth for the foreign-born population - Philippines (%)
Place of birth for the foreign-born population - Singapore (%)
Place of birth for the foreign-born population - Thailand (%)
Place of birth for the foreign-born population - Vietnam (%)
Place of birth for the foreign-born population - Other South Eastern Asia (%)
Place of birth for the foreign-born population - Armenia (%)
Place of birth for the foreign-born population - Iraq (%)
Place of birth for the foreign-born population - Israel (%)
Place of birth for the foreign-born population - Jordan (%)
Place of birth for the foreign-born population - Kuwait (%)
Place of birth for the foreign-born population - Lebanon (%)
Place of birth for the foreign-born population - Saudi Arabia (%)
Place of birth for the foreign-born population - Syria (%)
Place of birth for the foreign-born population - Turkey (%)
Place of birth for the foreign-born population - Yemen (%)
Place of birth for the foreign-born population - Other Western Asia (%)
Place of birth for the foreign-born population - Eritrea (%)
Place of birth for the foreign-born population - Ethiopia (%)
Place of birth for the foreign-born population - Kenya (%)
Place of birth for the foreign-born population - Somalia (%)
Place of birth for the foreign-born population - Uganda (%)
Place of birth for the foreign-born population - Zimbabwe (%)
Place of birth for the foreign-born population - Other Eastern Africa (%)
Place of birth for the foreign-born population - Cameroon (%)
Place of birth for the foreign-born population - Congo (%)
Place of birth for the foreign-born population - Democratic Republic of Congo (Zaire) (%)
Place of birth for the foreign-born population - Other Middle Africa (%)
Place of birth for the foreign-born population - Egypt (%)
Place of birth for the foreign-born population - Morocco (%)
Place of birth for the foreign-born population - Sudan (%)
Place of birth for the foreign-born population - Other Northern Africa (%)
Place of birth for the foreign-born population - South Africa (%)
Place of birth for the foreign-born population - Other Southern Africa (%)
Place of birth for the foreign-born population - Cabo Verde (%)
Place of birth for the foreign-born population - Ghana (%)
Place of birth for the foreign-born population - Liberia (%)
Place of birth for the foreign-born population - Nigeria (%)
Place of birth for the foreign-born population - Senegal (%)
Place of birth for the foreign-born population - Sierra Leone (%)
Place of birth for the foreign-born population - Other Western Africa (%)
Place of birth for the foreign-born population - Australia (%)
Place of birth for the foreign-born population - New Zealand (%)
Place of birth for the foreign-born population - Fiji (%)
Place of birth for the foreign-born population - Micronesia (%)
Place of birth for the foreign-born population - Bahamas (%)
Place of birth for the foreign-born population - Barbados (%)
Place of birth for the foreign-born population - Cuba (%)
Place of birth for the foreign-born population - Dominica (%)
Place of birth for the foreign-born population - Dominican Republic (%)
Place of birth for the foreign-born population - Grenada (%)
Place of birth for the foreign-born population - Haiti (%)
Place of birth for the foreign-born population - Jamaica (%)
Place of birth for the foreign-born population - St. Vincent and the Grenadines (%)
Place of birth for the foreign-born population - Trinidad and Tobago (%)
Place of birth for the foreign-born population - West Indies (%)
Place of birth for the foreign-born population - Other Caribbean (%)
Place of birth for the foreign-born population - Belize (%)
Place of birth for the foreign-born population - Costa Rica (%)
Place of birth for the foreign-born population - El Salvador (%)
Place of birth for the foreign-born population - Guatemala (%)
Place of birth for the foreign-born population - Honduras (%)
Place of birth for the foreign-born population - Mexico (%)
Place of birth for the foreign-born population - Nicaragua (%)
Place of birth for the foreign-born population - Panama (%)
Place of birth for the foreign-born population - Other Central America (%)
Place of birth for the foreign-born population - Argentina (%)
Place of birth for the foreign-born population - Bolivia (%)
Place of birth for the foreign-born population - Brazil (%)
Place of birth for the foreign-born population - Chile (%)
Place of birth for the foreign-born population - Colombia (%)
Place of birth for the foreign-born population - Ecuador (%)
Place of birth for the foreign-born population - Guyana (%)
Place of birth for the foreign-born population - Peru (%)
Place of birth for the foreign-born population - Uruguay (%)
Place of birth for the foreign-born population - Venezuela (%)
Place of birth for the foreign-born population - Other South America (%)
Place of birth for the foreign-born population - Canada (%)
Place of birth for the foreign-born population - Other Northern America (%)
Place of birth for the foreign-born population - Other (%)
Latest news about races in Pratt, KS collected exclusively by city-data.com from local newspapers, TV, and radio stations
According to 2022 data, the most numerous races in Pratt, KS are White alone (5,481 residents), Hispanic (597 residents), and Black alone (187 residents). 95.8% of Pratt residents speak English at home. 1.3% of Pratt, KS residents are foreign-born , which is 455.9% less than the foreign-born rate of 7.0% across the entire state of Kansas.
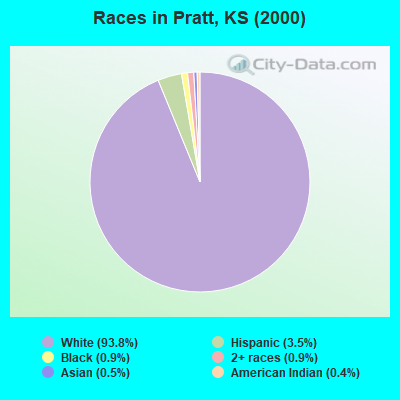
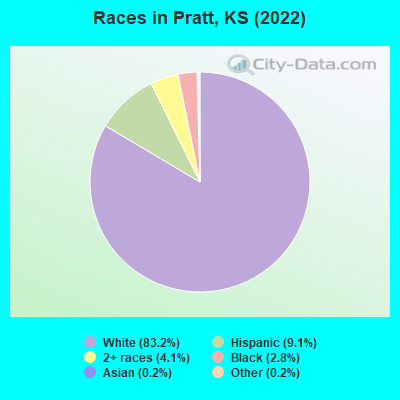
Race distribution in Pratt
2000 2022
2,233,997 83.1% White alone 188,252 7.0% Hispanic 151,407 5.6% Black alone 46,301 1.7% Asian alone 42,508 1.6% Two or more races 22,322 0.8% American Indian alone 2,477 0.09% Other race alone 1,154 0.04% Native Hawaiian and Other
2,147,943 73.1% White alone 381,746 13.0% Hispanic 147,666 5.0% Black alone 145,362 4.9% Two or more races 85,085 2.9% Asian alone 13,263 0.5% Other race alone 12,065 0.4% American Indian alone 4,020 0.1% Native Hawaiian and Other
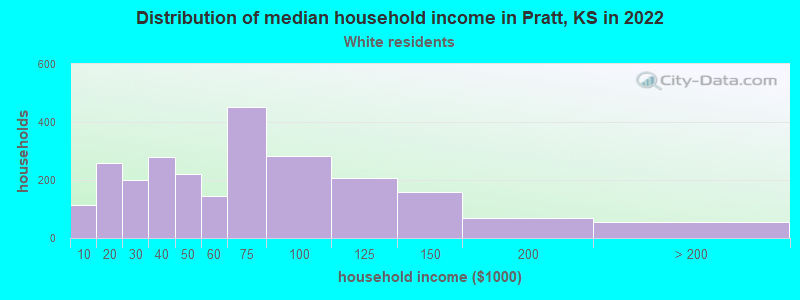
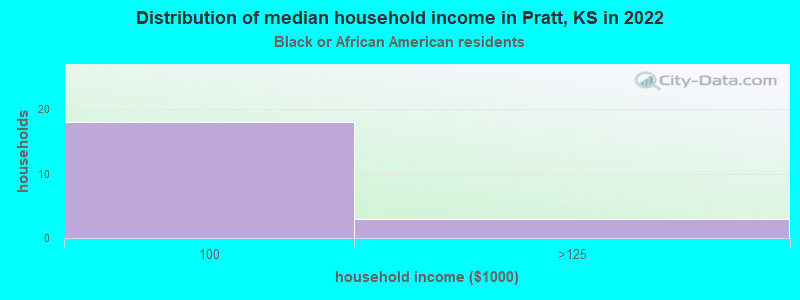
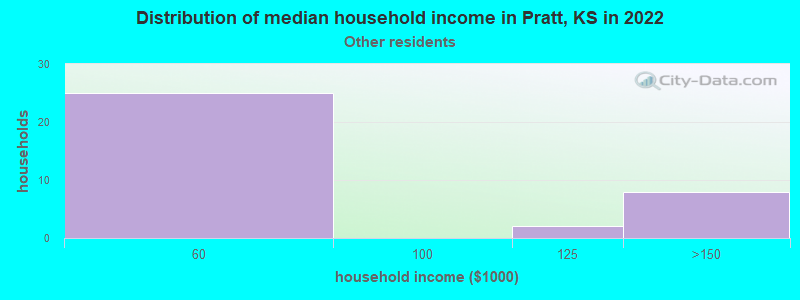
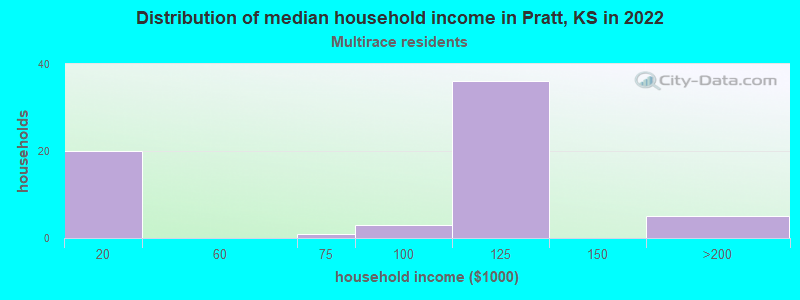
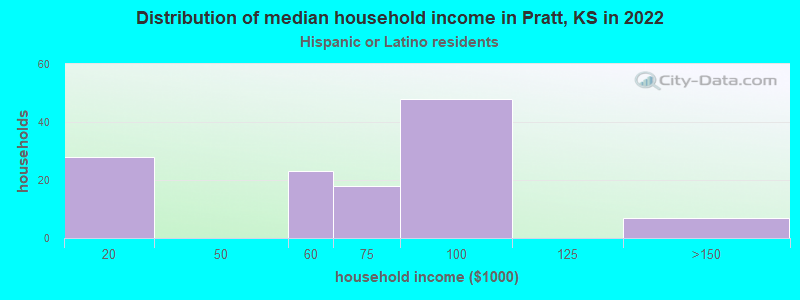
Income and house value in Pratt Median household income in 2022 $58,840 White non-Hispanic householders$66,087 Hispanic or Latino race householdersMedian 2022 house value $109,912 White Non-Hispanic householders$106,242 Black or African American householders$19,314 Some other race householders$84,993 Two or more races householders$38,633 Hispanic or Latino householders
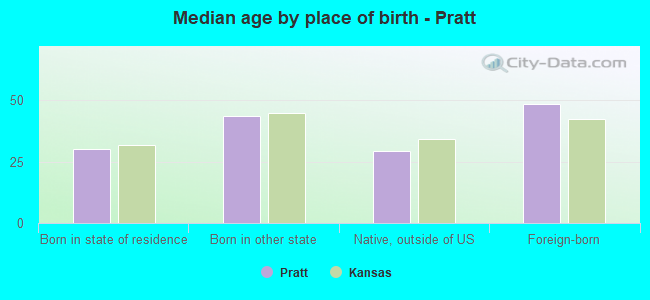
Median age by race in Pratt
36.8 Median age for White residents32.0 39.9 20.8 Median age for Black or African American residents29.5 5.4 42.6 Median age for American Indian / Alaska Native residents-781,078,107.0 28.3 5.9 Median age for Asian residents-717,460,316.7 5.7 -627,039,626.4 Median age for Native Hawaiian / Pacific Islander residents-669,240,668.6 -641,269,840.6 25.8 Median age for Other race residents42.5 -675,438,595.8 24.5 Median age for Two or more races residents24.3 24.7 38.2 Median age for White alone residents35.1 40.8 25.9 Median age for Hispanic or Latino residents20.1 29.1
Owner/renter occupied households by race in Pratt
House owners and renters - White residents 1,570 65.1% Owner occupied842 34.9% Renter occupiedHouse owners and renters - Black or African American residents 20 100.0% Owner occupiedHouse owners and renters - American Indian / Alaska Native residents 30 100.0% Owner occupiedHouse owners and renters - Asian residents 1 100.0% Owner occupiedHouse owners and renters - Other race residents 10 28.8% Owner occupied25 71.2% Renter occupiedHouse owners and renters - Two or more races residents 81 98.4% Owner occupied1 1.6% Renter occupiedHouse owners and renters - White alone residents 1,594 65.9% Owner occupied823 34.1% Renter occupiedHouse owners and renters - Hispanic or Latino residents 58 48.4% Owner occupied62 51.6% Renter occupied
Language usage in Pratt
English speakers - Total 95.8% of residents of Pratt speak English at home.
3.8% of residents speak Spanish at home 176 75.2% Speak English very well58 24.8% Speak English less than very well0.5% of residents speak other language at home 22 66.7% Speak English very well11 33.3% Speak English less than very well
English speakers - Born in the United States 99.1% of residents of Pratt speak English at home.
0.7% of residents speak Spanish at home 11 100.0% Speak English very well0.1% of residents speak other language at home 1 100.0% Speak English very well
English speakers - Native, born elsewhere 50.0% of residents of Pratt speak English at home.
56.5% of residents speak Spanish at home 26 100.0% Speak English less than very well
English speakers - Foreign-born 12.2% of residents of Pratt speak English at home.
62.2% of residents speak Spanish at home 51 100.0% Speak English very well26.8% of residents speak other language at home 10 45.5% Speak English very well12 54.5% Speak English less than very well
White (Caucasian) - Speak another language Native:
1.2% (61)Foreign-born:
87.5% (19)
Black or African American - Speak only English Native:
99.6% (147)Foreign-born:
100.0% (10)
Other race - Speak another language Native:
24.4% (10)Foreign-born:
96.6% (8)
Two or more races - Speak another language Native:
7.2% (34)Foreign-born:
100.0% (47)
White alone - Speak another language Native:
0.3% (17)Foreign-born:
100.0% (15)
Hispanic or Latino - Speak another language Native:
39.4% (178)Foreign-born:
98.4% (49)
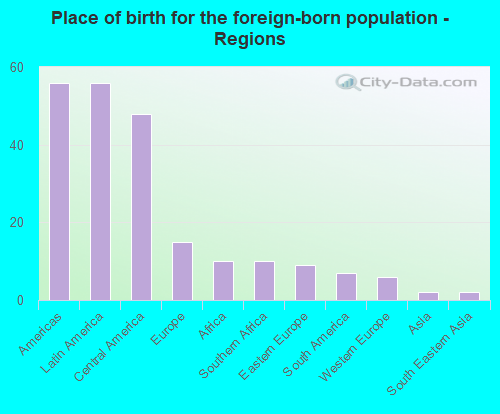
Foreign-born residents in Pratt 83 residents are foreign born
This city:
1.3%Kansas:
7.1%
Marital status for residents in Pratt Marital status - White (Caucasian) population 15 years and over
Males 43.7% Never married37.6% Now married0.8% Separated3.5% Widowed14.4% DivorcedFemales 25.4% Never married41.3% Now married0.2% Separated10.7% Widowed22.4% DivorcedWomen who gave birth in the past 12 months Now married:
28.8% (14)Unmarried:
71.2% (35)
Women who did not give birth in the past 12 months Now married:
39.9% (449)Unmarried:
60.1% (676)
Marital status - Black or African American population 15 years and over
Males 68.3% Never married29.7% Now married0.0% Separated0.0% Widowed2.0% DivorcedFemales 50.0% Never married28.6% Now married0.0% Separated0.0% Widowed21.4% DivorcedWomen who did not give birth in the past 12 months Now married:
0.0% (0)Unmarried:
100.0% (10)
Marital status - American Indian / Alaska Native population 15 years and over
Males 100.0% Never married0.0% Now married0.0% Separated0.0% Widowed0.0% DivorcedFemales 8.3% Never married0.0% Now married0.0% Separated0.0% Widowed91.7% DivorcedWomen who did not give birth in the past 12 months Now married:
0.0% (0)Unmarried:
100.0% (42)
Marital status - Asian population 15 years and over
Males 0.0% Never married100.0% Now married0.0% Separated0.0% Widowed0.0% DivorcedFemales 0.0% Never married100.0% Now married0.0% Separated0.0% Widowed0.0% DivorcedWomen who did not give birth in the past 12 months Now married:
99.9% (1)Unmarried:
0.0% (0)
Marital status - Other race population 15 years and over
Males 43.8% Never married56.2% Now married0.0% Separated0.0% Widowed0.0% DivorcedFemales 100.0% Never married0.0% Now married0.0% Separated0.0% Widowed0.0% DivorcedWomen who did not give birth in the past 12 months Now married:
0.0% (0)Unmarried:
100.0% (26)
Marital status - Two or more races population 15 years and over
Males 73.6% Never married12.6% Now married0.0% Separated0.0% Widowed13.8% DivorcedFemales 40.0% Never married59.4% Now married0.0% Separated0.6% Widowed0.0% DivorcedWomen who did not give birth in the past 12 months Now married:
45.0% (71)Unmarried:
55.0% (87)
Marital status - White alone, not Hispanic / Latino population 15 years and over
Males 43.8% Never married37.0% Now married0.8% Separated3.6% Widowed14.8% DivorcedFemales 26.1% Never married41.3% Now married0.2% Separated11.1% Widowed21.4% DivorcedWomen who gave birth in the past 12 months Now married:
28.8% (15)Unmarried:
71.2% (36)
Women who did not give birth in the past 12 months Now married:
39.8% (431)Unmarried:
60.2% (651)
Marital status - Hispanic or Latino population 15 years and over
Males 72.7% Never married22.2% Now married0.0% Separated0.0% Widowed5.1% DivorcedFemales 14.9% Never married44.6% Now married0.0% Separated0.0% Widowed40.5% DivorcedWomen who did not give birth in the past 12 months Now married:
42.5% (86)Unmarried:
57.5% (117)
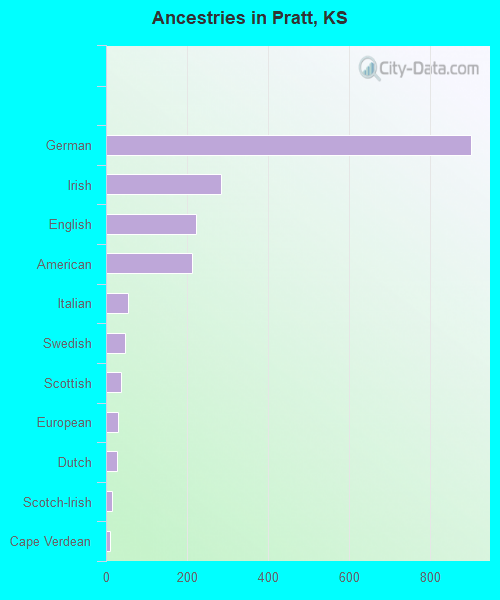
Ancestries in Pratt
901 32.1% German283 10.1% Irish223 7.9% English213 7.6% American55 2.0% Italian47 1.7% Swedish37 1.3% Scottish30 1.1% European26 0.9% Dutch16 0.6% Scotch-Irish10 0.4% Cape Verdean5 0.2% Polish5 0.2% Welsh4 0.1% Austrian4 0.1% Eastern European4 0.1% Northern European3 0.1% Brazilian
Children Nativity (place of birth) in Pratt
Children under 6 years - Living with two parents Both parents native 269 100.0% NativeBoth parents foreign-born 13 100.0% NativeChildren under 6 years - Living with one parent Native parent 215 100.0% Native
Children 6 to 17 years - Living with two parents Both parents native 640 100.0% NativeBoth parents foreign-born 1 96.2% NativeChildren 6 to 17 years - Living with one parent Native parent 292 100.0% Native
Grandparents responsible for own grandchildren in Pratt
Grandparents (30 to 59 years) White / Caucasian 36 100.0% Not responsible for grandchildrenWhite alone, not Hispanic / Latino 39 100.0% Not responsible for grandchildren
Grandparents (60 years and over) White / Caucasian 11 100.0% Responsible for grandchildrenWhite alone, not Hispanic / Latino 11 100.0% Responsible for grandchildren