Races in Rock Hill, South Carolina (SC) Detailed Stats
Data:
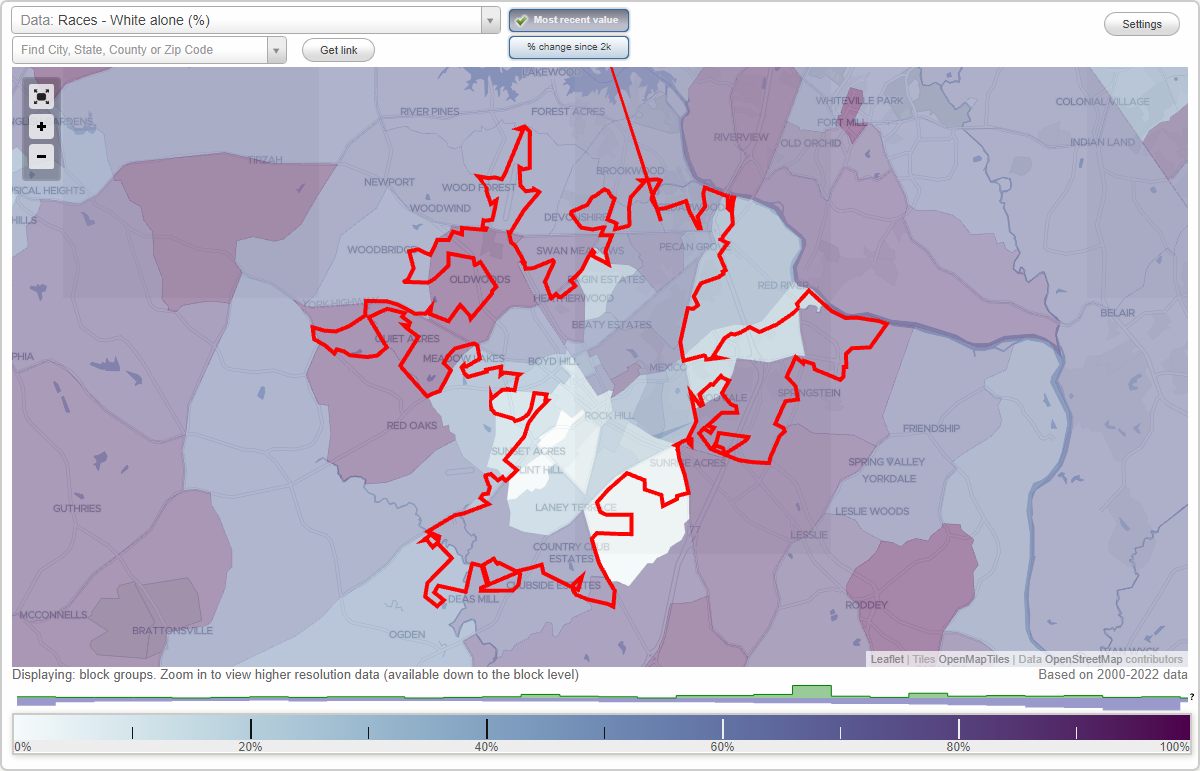
Races - White alone (%)
Races - White alone (% change since 2000)
Races - Black alone (%)
Races - Black alone (% change since 2000)
Races - American Indian alone (%)
Races - American Indian alone (% change since 2000)
Races - Asian alone (%)
Races - Asian alone (% change since 2000)
Races - Hispanic (%)
Races - Hispanic (% change since 2000)
Races - Native Hawaiian and Other Pacific Islander alone (%)
Races - Native Hawaiian and Other Pacific Islander alone (% change since 2000)
Races - Two or more races(%)
Races - Two or more races(% change since 2000)
Races - Other race alone (%)
Races - Other race alone (% change since 2000)
Racial diversity
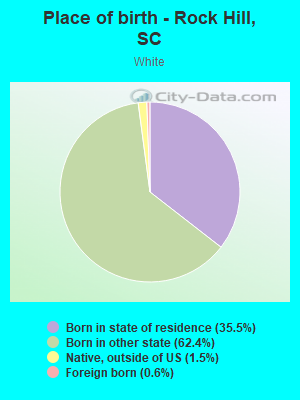
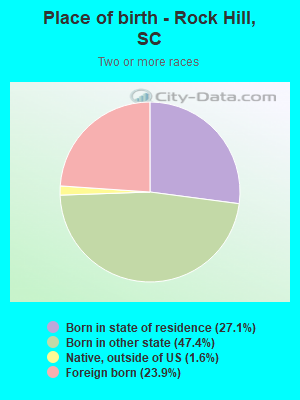
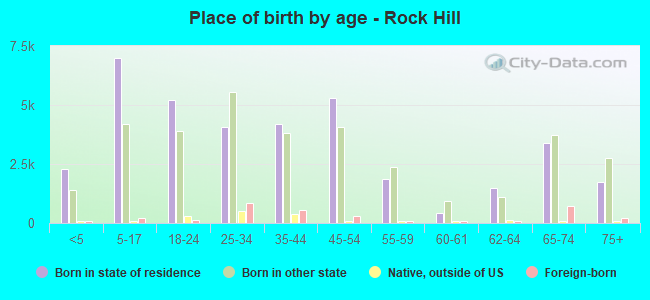
Place of birth - Born in state of residence (%)
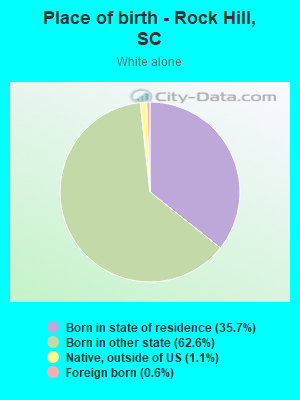
Place of birth - Born in state of residence (%) - White
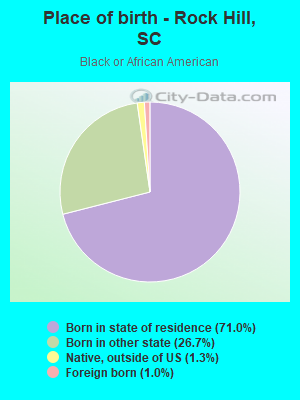
Place of birth - Born in state of residence (%) - Black or African American
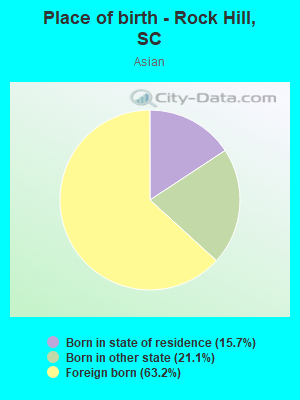
Place of birth - Born in state of residence (%) - Asian
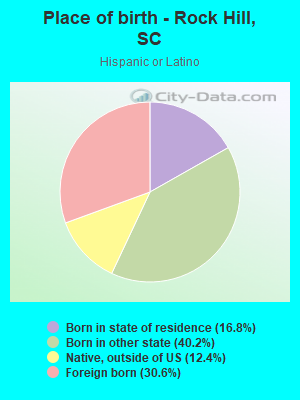
Place of birth - Born in state of residence (%) - Hispanic or Latino
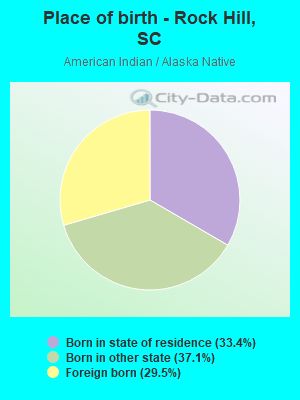
Place of birth - Born in state of residence (%) - American Indian and Alaska Native
Place of birth - Born in state of residence (%) - Multirace
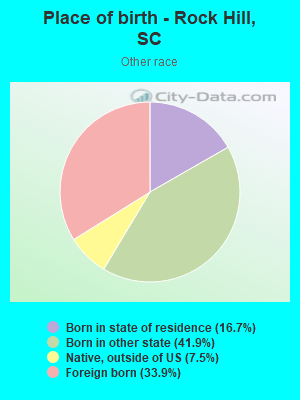
Place of birth - Born in state of residence (%) - Other Race
Place of birth - Born in other state (%)
Place of birth - Born in other state (%) - White
Place of birth - Born in other state (%) - Black or African American
Place of birth - Born in other state (%) - Asian
Place of birth - Born in other state (%) - Hispanic or Latino
Place of birth - Born in other state (%) - American Indian and Alaska Native
Place of birth - Born in other state (%) - Multirace
Place of birth - Born in other state (%) - Other Race
Place of birth - Native, outside of US (%)
Place of birth - Native, outside of US (%) - White
Place of birth - Native, outside of US (%) - Black or African American
Place of birth - Native, outside of US (%) - Asian
Place of birth - Native, outside of US (%) - Hispanic or Latino
Place of birth - Native, outside of US (%) - American Indian and Alaska Native
Place of birth - Native, outside of US (%) - Multirace
Place of birth - Native, outside of US (%) - Other Race
Place of birth - Foreign born (%)
Place of birth - Foreign born (%) - White
Place of birth - Foreign born (%) - Black or African American
Place of birth - Foreign born (%) - Asian
Place of birth - Foreign born (%) - Hispanic or Latino
Place of birth - Foreign born (%) - American Indian and Alaska Native
Place of birth - Foreign born (%) - Multirace
Place of birth - Foreign born (%) - Other Race
Residents speaking English at home (%)
Residents speaking English at home - Born in the United States (%)
Residents speaking English at home - Native, born elsewhere (%)
Residents speaking English at home - Foreign born (%)
Residents speaking Spanish at home (%)
Residents speaking Spanish at home - Born in the United States (%)
Residents speaking Spanish at home - Native, born elsewhere (%)
Residents speaking Spanish at home - Foreign born (%)
Residents speaking other language at home (%)
Residents speaking other language at home - Born in the United States (%)
Residents speaking other language at home - Native, born elsewhere (%)
Residents speaking other language at home - Foreign born (%)
Marital status - Never married (%)
Marital status - Now married (%)
Marital status - Separated (%)
Marital status - Widowed (%)
Marital status - Divorced (%)
Ancestries Reported - Arab (%)
Ancestries Reported - Czech (%)
Ancestries Reported - Danish (%)
Ancestries Reported - Dutch (%)
Ancestries Reported - English (%)
Ancestries Reported - French (%)
Ancestries Reported - French Canadian (%)
Ancestries Reported - German (%)
Ancestries Reported - Greek (%)
Ancestries Reported - Hungarian (%)
Ancestries Reported - Irish (%)
Ancestries Reported - Italian (%)
Ancestries Reported - Lithuanian (%)
Ancestries Reported - Norwegian (%)
Ancestries Reported - Polish (%)
Ancestries Reported - Portuguese (%)
Ancestries Reported - Russian (%)
Ancestries Reported - Scotch-Irish (%)
Ancestries Reported - Scottish (%)
Ancestries Reported - Slovak (%)
Ancestries Reported - Subsaharan African (%)
Ancestries Reported - Swedish (%)
Ancestries Reported - Swiss (%)
Ancestries Reported - Ukrainian (%)
Ancestries Reported - United States (%)
Ancestries Reported - Welsh (%)
Ancestries Reported - West Indian (%)
Ancestries Reported - Other (%)
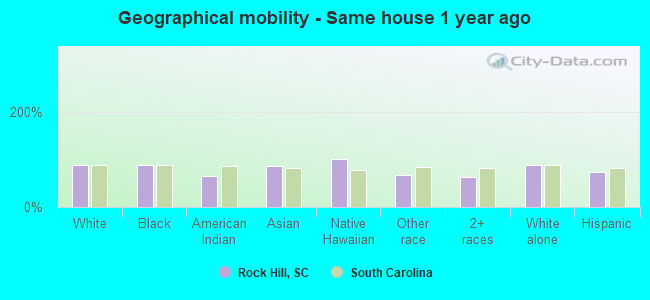
Geographical mobility - Same house 1 year ago (%)
Geographical mobility - Same house 1 year ago (%) - White
Geographical mobility - Same house 1 year ago (%) - Black or African American
Geographical mobility - Same house 1 year ago (%) - Asian
Geographical mobility - Same house 1 year ago (%) - Hispanic or Latino
Geographical mobility - Same house 1 year ago (%) - American Indian and Alaska Native
Geographical mobility - Same house 1 year ago (%) - Multirace
Geographical mobility - Same house 1 year ago (%) - Other Race
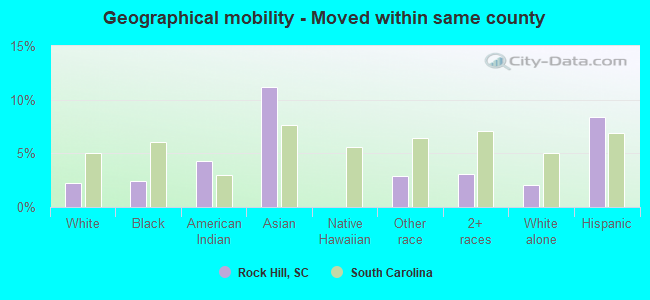
Geographical mobility - Moved within same county (%)
Geographical mobility - Moved within same county (%) - White
Geographical mobility - Moved within same county (%) - Black or African American
Geographical mobility - Moved within same county (%) - Asian
Geographical mobility - Moved within same county (%) - Hispanic or Latino
Geographical mobility - Moved within same county (%) - American Indian and Alaska Native
Geographical mobility - Moved within same county (%) - Multirace
Geographical mobility - Moved within same county (%) - Other Race
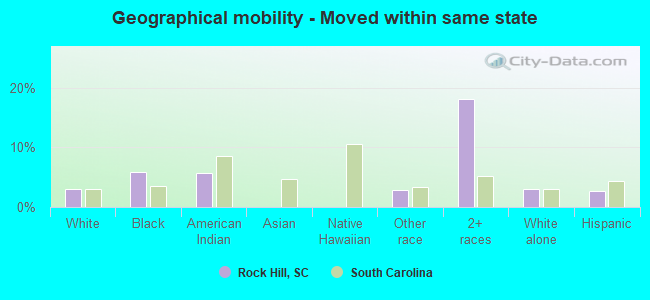
Geographical mobility - Moved from different county within same state (%)
Geographical mobility - Moved from different county within same state (%) - White
Geographical mobility - Moved from different county within same state (%) - Black or African American
Geographical mobility - Moved from different county within same state (%) - Asian
Geographical mobility - Moved from different county within same state (%) - Hispanic or Latino
Geographical mobility - Moved from different county within same state (%) - American Indian and Alaska Native
Geographical mobility - Moved from different county within same state (%) - Multirace
Geographical mobility - Moved from different county within same state (%) - Other Race
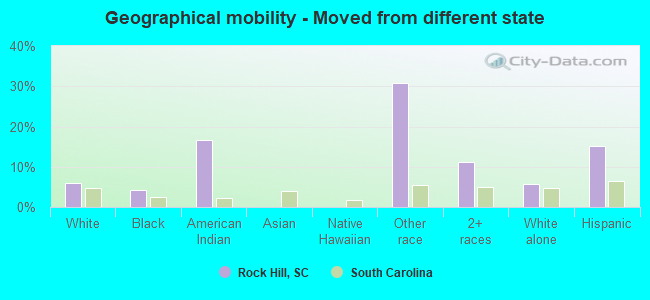
Geographical mobility - Moved from different state (%)
Geographical mobility - Moved from different state (%) - White
Geographical mobility - Moved from different state (%) - Black or African American
Geographical mobility - Moved from different state (%) - Asian
Geographical mobility - Moved from different state (%) - Hispanic or Latino
Geographical mobility - Moved from different state (%) - American Indian and Alaska Native
Geographical mobility - Moved from different state (%) - Multirace
Geographical mobility - Moved from different state (%) - Other Race
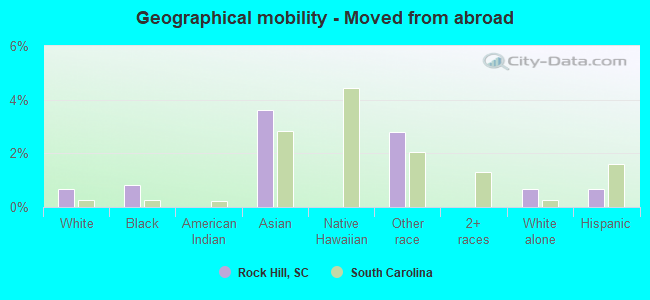
Geographical mobility - Moved from abroad (%)
Geographical mobility - Moved from abroad (%) - White
Geographical mobility - Moved from abroad (%) - Black or African American
Geographical mobility - Moved from abroad (%) - Asian
Geographical mobility - Moved from abroad (%) - Hispanic or Latino
Geographical mobility - Moved from abroad (%) - American Indian and Alaska Native
Geographical mobility - Moved from abroad (%) - Multirace
Geographical mobility - Moved from abroad (%) - Other Race
Place of birth for the foreign-born population - Ireland (%)
Place of birth for the foreign-born population - Denmark (%)
Place of birth for the foreign-born population - Norway (%)
Place of birth for the foreign-born population - Sweden (%)
Place of birth for the foreign-born population - United Kingdom (%)
Place of birth for the foreign-born population - England (%)
Place of birth for the foreign-born population - Scotland (%)
Place of birth for the foreign-born population - Other Northern Europe (%)
Place of birth for the foreign-born population - Austria (%)
Place of birth for the foreign-born population - Belgium (%)
Place of birth for the foreign-born population - France (%)
Place of birth for the foreign-born population - Germany (%)
Place of birth for the foreign-born population - Netherlands (%)
Place of birth for the foreign-born population - Switzerland (%)
Place of birth for the foreign-born population - Other Western Europe (%)
Place of birth for the foreign-born population - Greece (%)
Place of birth for the foreign-born population - Italy (%)
Place of birth for the foreign-born population - Portugal (%)
Place of birth for the foreign-born population - Spain (%)
Place of birth for the foreign-born population - Other Southern Europe (%)
Place of birth for the foreign-born population - Albania (%)
Place of birth for the foreign-born population - Belarus (%)
Place of birth for the foreign-born population - Bosnia and Herzegovina (%)
Place of birth for the foreign-born population - Bulgaria (%)
Place of birth for the foreign-born population - Croatia (%)
Place of birth for the foreign-born population - Czechoslovakia (%)
Place of birth for the foreign-born population - Hungary (%)
Place of birth for the foreign-born population - Latvia (%)
Place of birth for the foreign-born population - Lithuania (%)
Place of birth for the foreign-born population - North Macedonia (Macedonia) (%)
Place of birth for the foreign-born population - Moldova (%)
Place of birth for the foreign-born population - Poland (%)
Place of birth for the foreign-born population - Romania (%)
Place of birth for the foreign-born population - Russia (%)
Place of birth for the foreign-born population - Serbia (%)
Place of birth for the foreign-born population - Ukraine (%)
Place of birth for the foreign-born population - Other Eastern Europe (%)
Place of birth for the foreign-born population - China (%)
Place of birth for the foreign-born population - Hong Kong (%)
Place of birth for the foreign-born population - Taiwan (%)
Place of birth for the foreign-born population - Japan (%)
Place of birth for the foreign-born population - Korea (%)
Place of birth for the foreign-born population - Other Eastern Asia (%)
Place of birth for the foreign-born population - Afghanistan (%)
Place of birth for the foreign-born population - Bangladesh (%)
Place of birth for the foreign-born population - India (%)
Place of birth for the foreign-born population - Iran (%)
Place of birth for the foreign-born population - Kazakhstan (%)
Place of birth for the foreign-born population - Nepal (%)
Place of birth for the foreign-born population - Pakistan (%)
Place of birth for the foreign-born population - Sri Lanka (%)
Place of birth for the foreign-born population - Uzbekistan (%)
Place of birth for the foreign-born population - Other South Central Asia (%)
Place of birth for the foreign-born population - Burma (%)
Place of birth for the foreign-born population - Cambodia (%)
Place of birth for the foreign-born population - Indonesia (%)
Place of birth for the foreign-born population - Laos (%)
Place of birth for the foreign-born population - Malaysia (%)
Place of birth for the foreign-born population - Philippines (%)
Place of birth for the foreign-born population - Singapore (%)
Place of birth for the foreign-born population - Thailand (%)
Place of birth for the foreign-born population - Vietnam (%)
Place of birth for the foreign-born population - Other South Eastern Asia (%)
Place of birth for the foreign-born population - Armenia (%)
Place of birth for the foreign-born population - Iraq (%)
Place of birth for the foreign-born population - Israel (%)
Place of birth for the foreign-born population - Jordan (%)
Place of birth for the foreign-born population - Kuwait (%)
Place of birth for the foreign-born population - Lebanon (%)
Place of birth for the foreign-born population - Saudi Arabia (%)
Place of birth for the foreign-born population - Syria (%)
Place of birth for the foreign-born population - Turkey (%)
Place of birth for the foreign-born population - Yemen (%)
Place of birth for the foreign-born population - Other Western Asia (%)
Place of birth for the foreign-born population - Eritrea (%)
Place of birth for the foreign-born population - Ethiopia (%)
Place of birth for the foreign-born population - Kenya (%)
Place of birth for the foreign-born population - Somalia (%)
Place of birth for the foreign-born population - Uganda (%)
Place of birth for the foreign-born population - Zimbabwe (%)
Place of birth for the foreign-born population - Other Eastern Africa (%)
Place of birth for the foreign-born population - Cameroon (%)
Place of birth for the foreign-born population - Congo (%)
Place of birth for the foreign-born population - Democratic Republic of Congo (Zaire) (%)
Place of birth for the foreign-born population - Other Middle Africa (%)
Place of birth for the foreign-born population - Egypt (%)
Place of birth for the foreign-born population - Morocco (%)
Place of birth for the foreign-born population - Sudan (%)
Place of birth for the foreign-born population - Other Northern Africa (%)
Place of birth for the foreign-born population - South Africa (%)
Place of birth for the foreign-born population - Other Southern Africa (%)
Place of birth for the foreign-born population - Cabo Verde (%)
Place of birth for the foreign-born population - Ghana (%)
Place of birth for the foreign-born population - Liberia (%)
Place of birth for the foreign-born population - Nigeria (%)
Place of birth for the foreign-born population - Senegal (%)
Place of birth for the foreign-born population - Sierra Leone (%)
Place of birth for the foreign-born population - Other Western Africa (%)
Place of birth for the foreign-born population - Australia (%)
Place of birth for the foreign-born population - New Zealand (%)
Place of birth for the foreign-born population - Fiji (%)
Place of birth for the foreign-born population - Micronesia (%)
Place of birth for the foreign-born population - Bahamas (%)
Place of birth for the foreign-born population - Barbados (%)
Place of birth for the foreign-born population - Cuba (%)
Place of birth for the foreign-born population - Dominica (%)
Place of birth for the foreign-born population - Dominican Republic (%)
Place of birth for the foreign-born population - Grenada (%)
Place of birth for the foreign-born population - Haiti (%)
Place of birth for the foreign-born population - Jamaica (%)
Place of birth for the foreign-born population - St. Vincent and the Grenadines (%)
Place of birth for the foreign-born population - Trinidad and Tobago (%)
Place of birth for the foreign-born population - West Indies (%)
Place of birth for the foreign-born population - Other Caribbean (%)
Place of birth for the foreign-born population - Belize (%)
Place of birth for the foreign-born population - Costa Rica (%)
Place of birth for the foreign-born population - El Salvador (%)
Place of birth for the foreign-born population - Guatemala (%)
Place of birth for the foreign-born population - Honduras (%)
Place of birth for the foreign-born population - Mexico (%)
Place of birth for the foreign-born population - Nicaragua (%)
Place of birth for the foreign-born population - Panama (%)
Place of birth for the foreign-born population - Other Central America (%)
Place of birth for the foreign-born population - Argentina (%)
Place of birth for the foreign-born population - Bolivia (%)
Place of birth for the foreign-born population - Brazil (%)
Place of birth for the foreign-born population - Chile (%)
Place of birth for the foreign-born population - Colombia (%)
Place of birth for the foreign-born population - Ecuador (%)
Place of birth for the foreign-born population - Guyana (%)
Place of birth for the foreign-born population - Peru (%)
Place of birth for the foreign-born population - Uruguay (%)
Place of birth for the foreign-born population - Venezuela (%)
Place of birth for the foreign-born population - Other South America (%)
Place of birth for the foreign-born population - Canada (%)
Place of birth for the foreign-born population - Other Northern America (%)
Place of birth for the foreign-born population - Other (%)
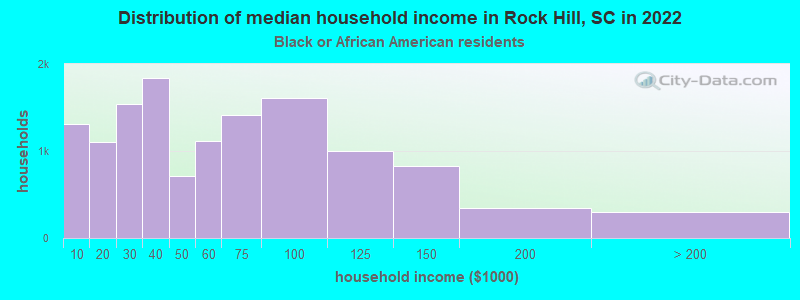
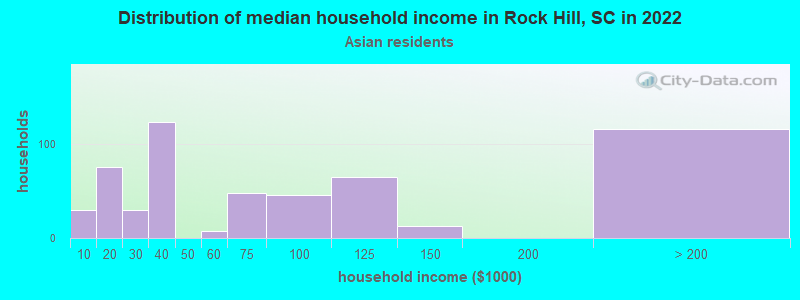
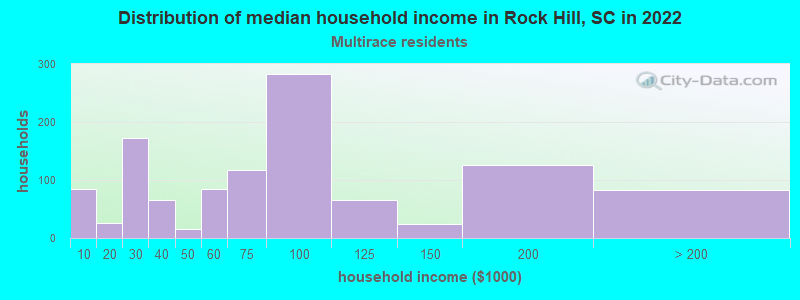
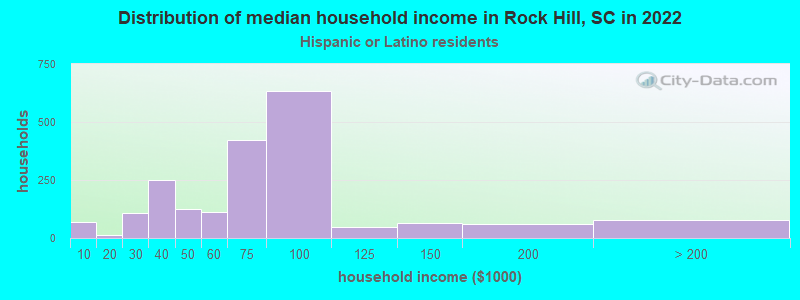
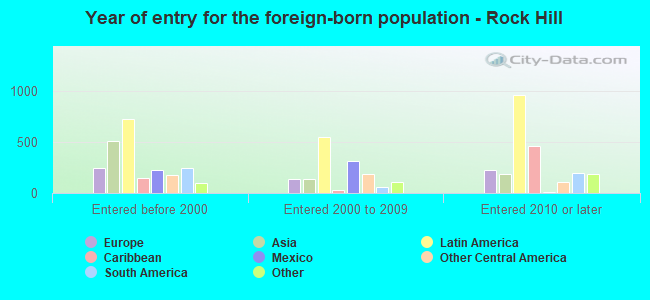
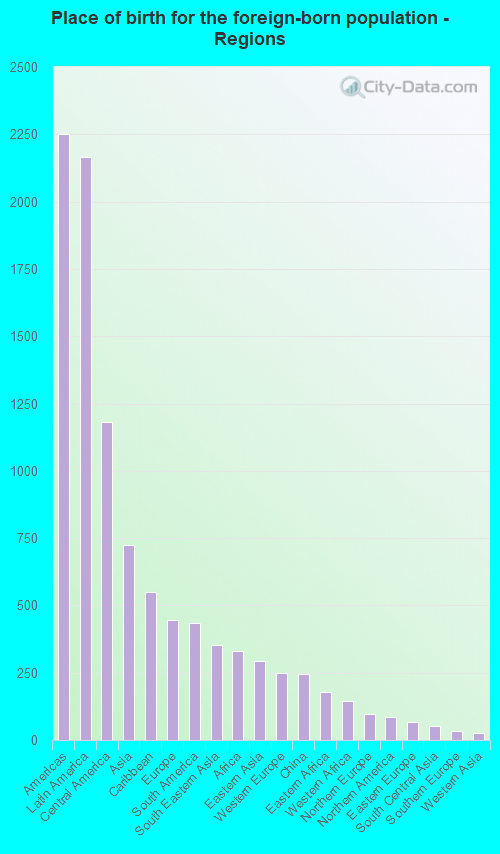
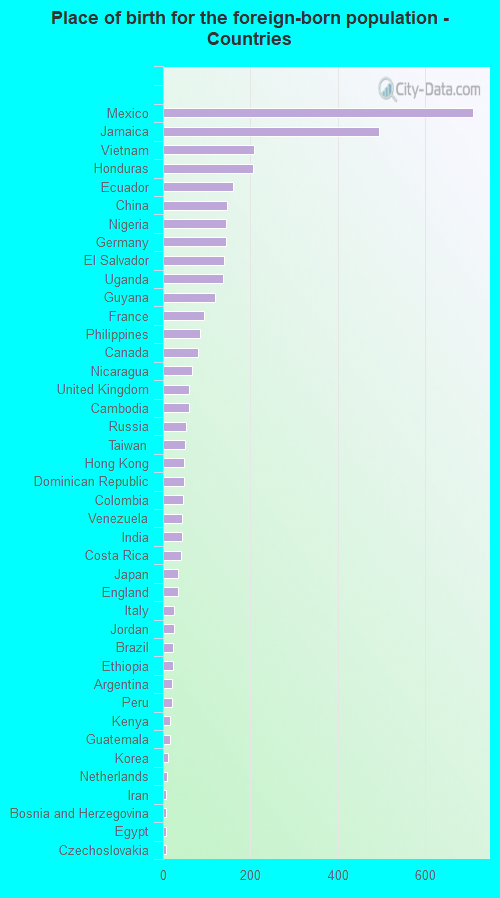
According to 2022 data, the most numerous races in Rock Hill, SC are White alone (34,271 residents), Black alone (32,357 residents), and Hispanic (4,963 residents). 92.5% of Rock Hill residents speak English at home. 4.9% of Rock Hill, SC residents are foreign-born (2.9% born in Latin America, 1.0% born in Asia, 0.6% born in Europe), which is 2.8% less than the foreign-born rate of 5.0% across the entire state of South Carolina.
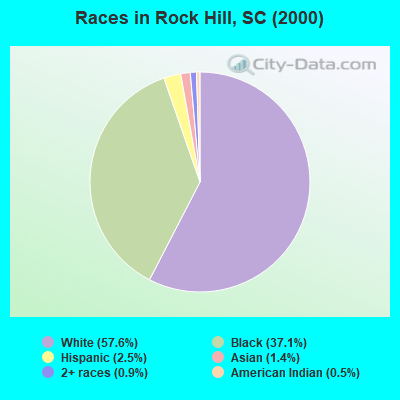
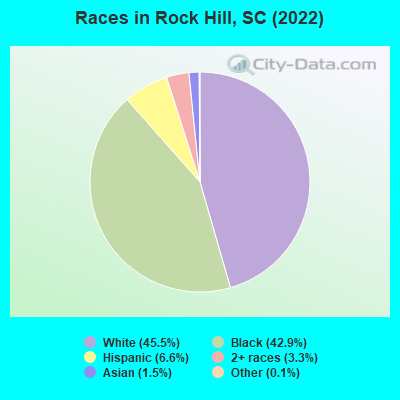
Race distribution in Rock Hill
2000 2022
2,652,291 66.1% White alone 1,178,486 29.4% Black alone 95,076 2.4% Hispanic 35,568 0.9% Asian alone 33,290 0.8% Two or more races 12,765 0.3% American Indian alone 3,266 0.08% Other race alone 1,270 0.03% Native Hawaiian and Other
3,301,739 62.5% White alone 1,313,290 24.9% Black alone 343,783 6.5% Hispanic 190,508 3.6% Two or more races 89,888 1.7% Asian alone 29,390 0.6% Other race alone 12,112 0.2% American Indian alone 1,924 0.04% Native Hawaiian and Other
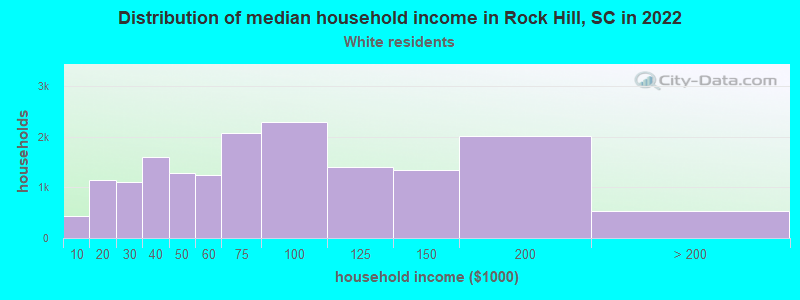
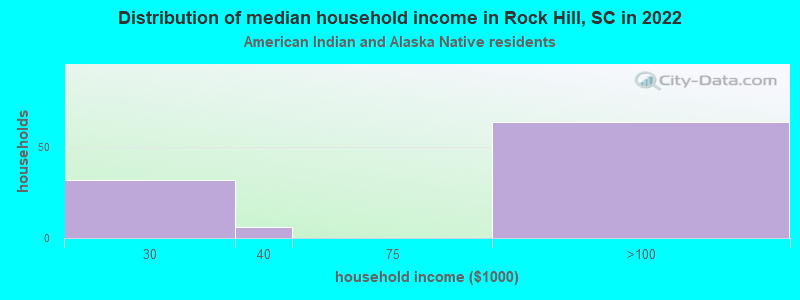
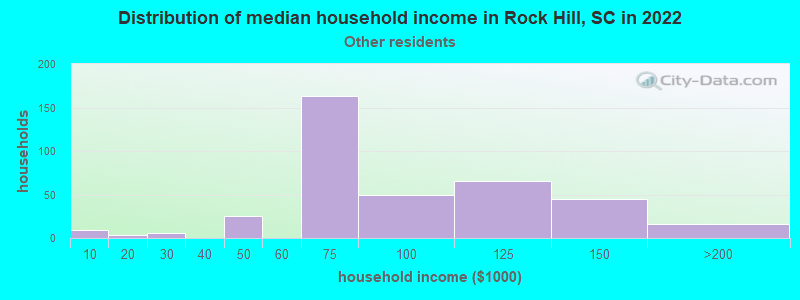
Income and house value in Rock Hill Median household income in 2022 $70,814 White non-Hispanic householders$50,452 Black householders$72,701 Asian householders$63,735 Some other race householders$56,408 Two or more races householders$64,275 Hispanic or Latino race householdersMedian 2022 house value $354,386 White Non-Hispanic householders$214,573 Black or African American householders$297,749 American Indian or Alaska Native householders $427,528 Asian householders$129,456 Some other race householders$257,617 Two or more races householders$362,477 Hispanic or Latino householders
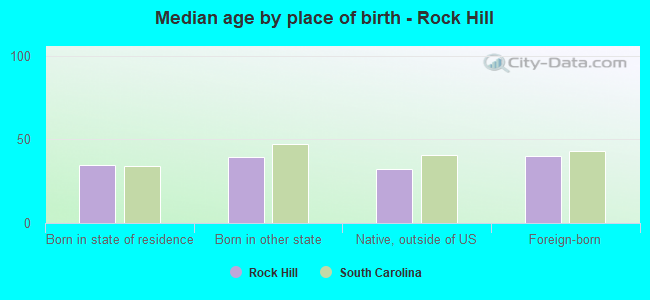
Median age by race in Rock Hill
43.9 Median age for White residents39.9 47.7 33.1 Median age for Black or African American residents34.2 32.7 -666,666,666.0 Median age for American Indian / Alaska Native residents-666,666,666.0 -666,666,666.0 54.7 Median age for Asian residents54.8 54.3 -666,666,666.0 Median age for Native Hawaiian / Pacific Islander residents-666,666,666.0 -666,666,666.0 33.7 Median age for Other race residents25.7 37.9 26.9 Median age for Two or more races residents25.7 27.8 45.4 Median age for White alone residents40.2 48.5 27.7 Median age for Hispanic or Latino residents25.8 30.3
Owner/renter occupied households by race in Rock Hill
House owners and renters - White residents 10,913 66.2% Owner occupied5,569 33.8% Renter occupiedHouse owners and renters - Black or African American residents 6,026 46.0% Owner occupied7,076 54.0% Renter occupiedHouse owners and renters - American Indian / Alaska Native residents 37 42.1% Owner occupied51 57.9% Renter occupiedHouse owners and renters - Asian residents 433 82.4% Owner occupied93 17.6% Renter occupiedHouse owners and renters - Other race residents 236 32.1% Owner occupied499 67.9% Renter occupiedHouse owners and renters - Two or more races residents 745 41.4% Owner occupied1,053 58.6% Renter occupiedHouse owners and renters - White alone residents 10,771 67.4% Owner occupied5,216 32.6% Renter occupiedHouse owners and renters - Hispanic or Latino residents 664 32.4% Owner occupied1,387 67.6% Renter occupied
Language usage in Rock Hill
English speakers - Total 92.5% of residents of Rock Hill speak English at home.
4.6% of residents speak Spanish at home 2,596 77.2% Speak English very well767 22.8% Speak English less than very well2.4% of residents speak other language at home 1,254 72.2% Speak English very well484 27.8% Speak English less than very well
English speakers - Born in the United States 96.4% of residents of Rock Hill speak English at home.
2.9% of residents speak Spanish at home 968 97.1% Speak English very well29 2.9% Speak English less than very well0.8% of residents speak other language at home 252 94.0% Speak English very well16 6.0% Speak English less than very well
English speakers - Native, born elsewhere 55.8% of residents of Rock Hill speak English at home.
36.2% of residents speak Spanish at home 440 87.0% Speak English very well66 13.0% Speak English less than very well0.8% of residents speak other language at home 11 100.0% Speak English very well
English speakers - Foreign-born 28.4% of residents of Rock Hill speak English at home.
36.4% of residents speak Spanish at home 903 57.7% Speak English very well661 42.3% Speak English less than very well29.1% of residents speak other language at home 802 64.3% Speak English very well446 35.7% Speak English less than very well
White (Caucasian) - Speak only English Native:
97.0% (35,851)Foreign-born:
26.5% (336)
White (Caucasian) - Speak another language Native:
2.5% (937)Foreign-born:
73.3% (927)
Black or African American - Speak only English Native:
99.5% (25,647)Foreign-born:
57.8% (476)
Black or African American - Speak another language Native:
0.4% (94)Foreign-born:
22.4% (184)
American Indian / Alaska Native - Speak another language Native:
14.7% (23)Foreign-born:
100.0% (62)
Asian - Speak only English Native:
54.2% (275)Foreign-born:
18.4% (153)
Asian - Speak another language Native:
36.8% (186)Foreign-born:
77.2% (642)
Other race - Speak only English Native:
36.9% (462)Foreign-born:
26.6% (157)
Other race - Speak another language Native:
38.3% (479)Foreign-born:
74.2% (439)
Two or more races - Speak only English Native:
84.0% (2,149)Foreign-born:
7.3% (41)
Two or more races - Speak another language Native:
15.8% (405)Foreign-born:
92.4% (520)
White alone - Speak only English Native:
98.6% (35,157)Foreign-born:
39.5% (304)
White alone - Speak another language Native:
1.4% (511)Foreign-born:
54.0% (416)
Hispanic or Latino - Speak another language Native:
63.4% (1,921)Foreign-born:
100.0% (1,518)
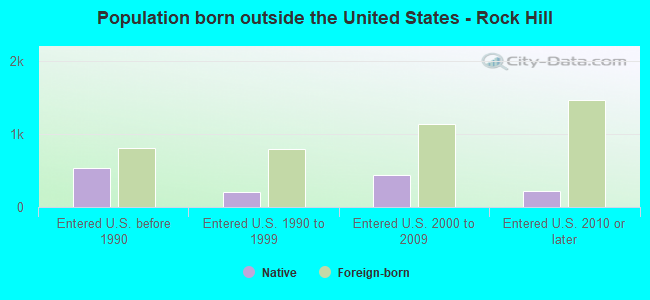
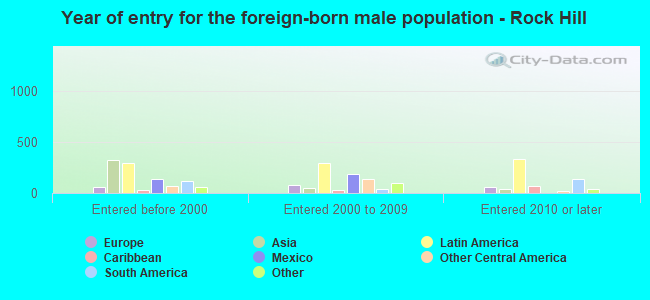
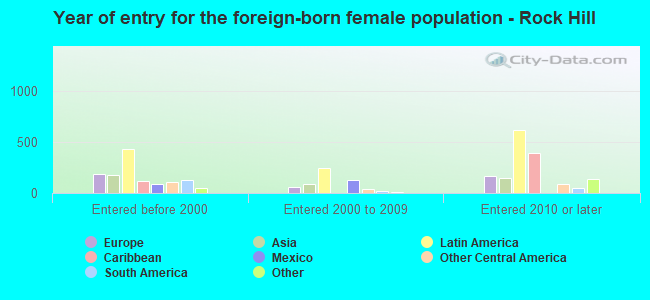
Foreign-born residents in Rock Hill 3,752 residents are foreign born (2.9% Latin America , 1.0% Asia , 0.6% Europe ).
This city:
4.9%South Carolina:
5.3%
Marital status for residents in Rock Hill Marital status - White (Caucasian) population 15 years and over
Males 36.1% Never married53.2% Now married0.0% Separated2.8% Widowed8.0% DivorcedFemales 26.3% Never married46.8% Now married0.7% Separated13.6% Widowed12.6% DivorcedWomen who gave birth in the past 12 months Now married:
100.0% (170)Unmarried:
0.0% (0)
Women who did not give birth in the past 12 months Now married:
44.0% (3,301)Unmarried:
56.0% (4,196)
Marital status - Black or African American population 15 years and over
Males 41.1% Never married47.9% Now married2.2% Separated1.2% Widowed7.6% DivorcedFemales 49.0% Never married27.0% Now married3.7% Separated5.1% Widowed15.2% DivorcedWomen who gave birth in the past 12 months Now married:
30.0% (42)Unmarried:
70.0% (99)
Women who did not give birth in the past 12 months Now married:
21.6% (1,916)Unmarried:
78.4% (6,952)
Marital status - American Indian / Alaska Native population 15 years and over
Males 28.6% Never married57.1% Now married0.0% Separated0.0% Widowed14.3% DivorcedFemales 41.8% Never married49.5% Now married0.0% Separated8.8% Widowed0.0% DivorcedWomen who gave birth in the past 12 months Now married:
0.0% (0)Unmarried:
100.0% (10)
Women who did not give birth in the past 12 months Now married:
27.8% (14)Unmarried:
72.2% (36)
Marital status - Asian population 15 years and over
Males 34.5% Never married57.0% Now married0.0% Separated0.0% Widowed8.5% DivorcedFemales 19.9% Never married61.1% Now married0.0% Separated11.7% Widowed7.3% DivorcedWomen who gave birth in the past 12 months Now married:
100.0% (12)Unmarried:
0.0% (0)
Women who did not give birth in the past 12 months Now married:
59.9% (208)Unmarried:
40.1% (140)
Marital status - Other race population 15 years and over
Males 55.0% Never married35.3% Now married2.8% Separated0.0% Widowed6.9% DivorcedFemales 39.4% Never married50.4% Now married8.1% Separated0.0% Widowed2.1% DivorcedWomen who gave birth in the past 12 months Now married:
100.0% (26)Unmarried:
0.0% (0)
Women who did not give birth in the past 12 months Now married:
40.4% (173)Unmarried:
59.6% (255)
Marital status - Two or more races population 15 years and over
Males 53.0% Never married37.2% Now married0.0% Separated0.8% Widowed9.0% DivorcedFemales 58.9% Never married29.7% Now married0.0% Separated2.3% Widowed9.1% DivorcedWomen who gave birth in the past 12 months Now married:
50.0% (28)Unmarried:
50.0% (28)
Women who did not give birth in the past 12 months Now married:
25.0% (211)Unmarried:
75.0% (632)
Marital status - White alone, not Hispanic / Latino population 15 years and over
Males 35.7% Never married53.7% Now married0.0% Separated2.8% Widowed7.8% DivorcedFemales 24.9% Never married48.2% Now married0.7% Separated14.1% Widowed12.0% DivorcedWomen who gave birth in the past 12 months Now married:
100.0% (170)Unmarried:
0.0% (0)
Women who did not give birth in the past 12 months Now married:
46.5% (3,301)Unmarried:
53.5% (3,802)
Marital status - Hispanic or Latino population 15 years and over
Males 48.2% Never married42.2% Now married3.5% Separated0.0% Widowed6.1% DivorcedFemales 38.7% Never married42.4% Now married4.4% Separated2.8% Widowed11.6% DivorcedWomen who gave birth in the past 12 months Now married:
100.0% (132)Unmarried:
0.0% (0)
Women who did not give birth in the past 12 months Now married:
40.1% (639)Unmarried:
59.9% (954)
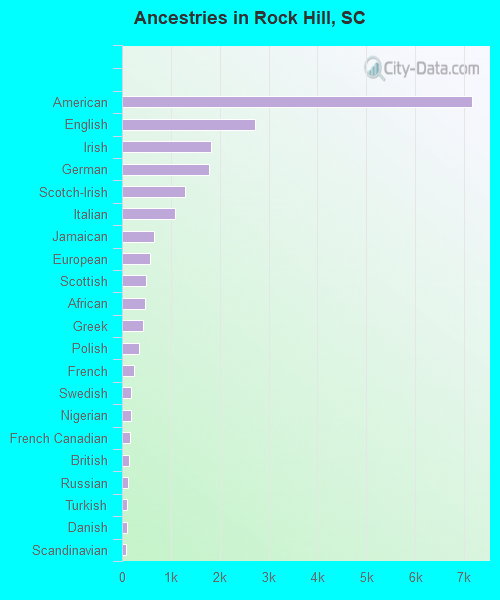
Ancestries in Rock Hill
7,156 15.4% American2,714 5.9% English1,829 3.9% Irish1,784 3.8% German1,300 2.8% Scotch-Irish1,080 2.3% Italian660 1.4% Jamaican571 1.2% European484 1.0% Scottish481 1.0% African436 0.9% Greek356 0.8% Polish254 0.5% French188 0.4% Swedish179 0.4% Nigerian167 0.4% French Canadian140 0.3% British115 0.2% Russian101 0.2% Turkish93 0.2% Danish75 0.2% Scandinavian61 0.1% Eastern European56 0.1% Lebanese53 0.1% Welsh44 0.09% Dutch41 0.09% Norwegian30 0.06% Swiss23 0.05% Slovak20 0.04% Jordanian20 0.04% Croatian17 0.04% Lithuanian16 0.03% Brazilian15 0.03% Haitian14 0.03% Albanian13 0.03% Liberian13 0.03% Armenian13 0.03% Ukrainian12 0.03% Israeli12 0.03% Czechoslovakian12 0.03% Hungarian11 0.02% West Indian8 0.02% Czech8 0.02% Iranian8 0.02% Belgian8 0.02% Austrian6 0.01% Yugoslavian
Geographical mobility in Rock Hill Same house 1 year ago 30,890 88.1% White (Caucasian)27,729 86.6% Black or African American136 64.4% American Indian / Alaska Native1,065 85.5% Asian4 100.0% Native Hawaiian / Pacific Islander800 68.1% Other race2,262 62.0% Two or more races30,242 88.5% White alone, not Hispanic / Latino3,451 73.8% Hispanic or LatinoMoved within same county 791 2.3% White / Caucasian777 2.4% Black or African American9 4.2% American Indian / Alaska Native139 11.1% Asian34 2.9% Other race114 3.1% Two or more races695 2.0% White alone, not Hispanic / Latino391 8.4% Hispanic or LatinoMoved within same state 1,060 3.0% White / Caucasian1,880 5.9% Black or African American12 5.8% American Indian / Alaska Native33 2.8% Other race662 18.1% Two or more races1,060 3.1% White alone, not Hispanic / Latino125 2.7% Hispanic or LatinoMoved from different state 2,094 6.0% White / Caucasian1,369 4.3% Black or African American35 16.5% American Indian / Alaska Native362 30.8% Other race405 11.1% Two or more races1,942 5.7% White alone, not Hispanic / Latino713 15.3% Hispanic or LatinoMoved from abroad 229 0.7% White257 0.8% Black or African American45 3.6% Asian33 2.8% Other race229 0.7% White alone, not Hispanic / Latino31 0.7% Hispanic or Latino
Children Nativity (place of birth) in Rock Hill
Children under 6 years - Living with two parents Both parents native 2,910 100.0% NativeBoth parents foreign-born 60 93.3% Native4 6.7% Foreign-bornOne native, one foreign-born parent 214 100.0% NativeChildren under 6 years - Living with one parent Native parent 1,101 100.0% NativeForeign-born parent 197 100.0% NativeChildren 6 to 17 years - Living with two parents Both parents native 5,919 99.6% Native24 0.4% Foreign-bornBoth parents foreign-born 85 68.1% Native40 31.9% Foreign-bornOne native, one foreign-born parent 310 100.0% NativeChildren 6 to 17 years - Living with one parent Native parent 4,070 100.0% NativeForeign-born parent 428 58.5% Native304 41.5% Foreign-born
Grandparents responsible for own grandchildren in Rock Hill
Grandparents (30 to 59 years) White / Caucasian 161 71.3% Responsible for grandchildren65 28.7% Not responsible for grandchildrenBlack or African American 366 64.4% Responsible for grandchildren202 35.6% Not responsible for grandchildrenNative Hawaiian / Pacific Islander 4 100.0% Not responsible for grandchildrenOther race 2 10.0% Responsible for grandchildren22 90.0% Not responsible for grandchildrenWhite alone, not Hispanic / Latino 163 83.0% Responsible for grandchildren33 17.0% Not responsible for grandchildrenHispanic or Latino 1 1.7% Responsible for grandchildren82 98.3% Not responsible for grandchildrenGrandparents (60 years and over) White / Caucasian 41 12.9% Responsible for grandchildren277 87.1% Not responsible for grandchildrenBlack or African American 151 52.5% Responsible for grandchildren137 47.5% Not responsible for grandchildrenWhite alone, not Hispanic / Latino 41 14.1% Responsible for grandchildren248 85.9% Not responsible for grandchildrenHispanic or Latino 33 100.0% Not responsible for grandchildren