Races in Rome, Maine (ME) Detailed Stats
Ancestries, Foreign-born residents, place of birth

Recent posts about races in Rome, Maine on our local forum with over 2,400,000 registered users:
 | Well, here goes. The start to our trek North to Maine, our new home-state. (395 replies) |
| Photos of Maine (4586 replies) |
| Moo-ving Truck, which way to go... (42 replies) |
| Maple syrup today compared to 25 years ago (33 replies) |
| Less Touristy coastal towns? (32 replies) |
| Maine weather thread (3207 replies) |
Latest news about races in Rome, ME collected exclusively by city-data.com from local newspapers, TV, and radio stations
1.7% of Rome, ME residents are foreign-born , which is 72.9% less than the foreign-born rate of 3.0% across the entire state of Maine.
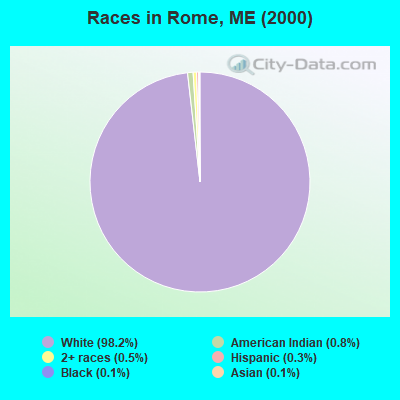
Race distribution in Rome

- 96298.2%White alone
- 80.8%American Indian alone
- 50.5%Two or more races
- 30.3%Hispanic
- 10.1%Black alone
- 10.1%Asian alone
2000
2022
-
- 1,230,29796.5%White alone
- 11,7310.9%Two or more races
- 9,3600.7%Hispanic
- 9,0140.7%Asian alone
- 6,4400.5%Black alone
- 6,9110.5%American Indian alone
- 8360.07%Other race alone
- 3340.03%Native Hawaiian and Other
Pacific Islander alone

-
- 1,249,23390.2%White alone
- 58,3574.2%Two or more races
- 28,7172.1%Hispanic
- 21,5831.6%Black alone
- 16,1511.2%Asian alone
- 5,8730.4%Other race alone
- 5,2050.4%American Indian alone
- 2210.02%Native Hawaiian and Other
Pacific Islander alone

Income and house value in Rome
- Median household income in 2022
- $74,084White non-Hispanic householders
- $145,423Two or more races householders
- Median 2022 house value
- $299,581White Non-Hispanic householders
- $231,074Two or more races householders
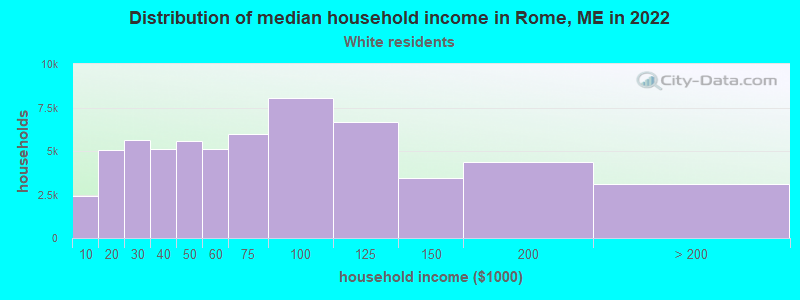
Household income for White non-Hispanic householders
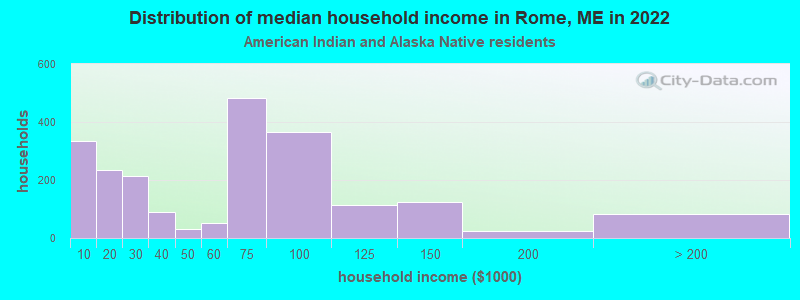
Household income for American Indian and Alaska Native householders
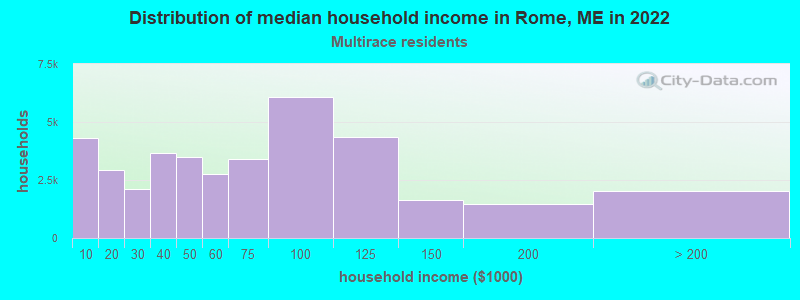
Household income for Two or more races householders
Foreign-born residents in Rome
17 residents are foreign born
| This city: | 1.7% |
| Maine: | 2.9% |
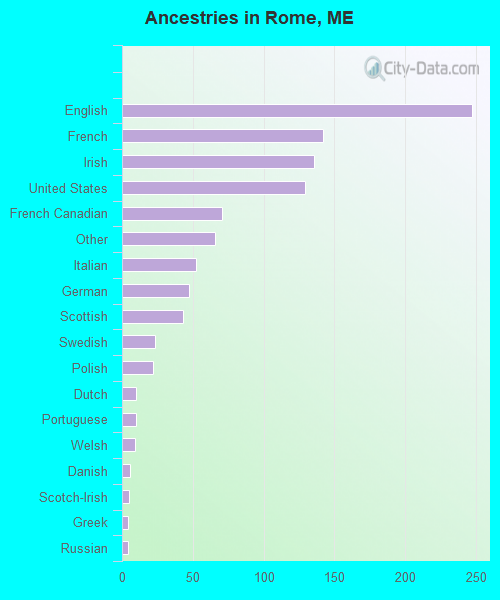
Ancestries in Rome

- 24723.8%English
- 14213.7%French
- 13613.1%Irish
- 12912.5%United States
- 716.9%French Canadian
- 666.4%Other
- 525.0%Italian
- 474.5%German
- 434.2%Scottish
- 232.2%Swedish
- 222.1%Polish
- 101.0%Dutch
- 101.0%Portuguese
- 90.9%Welsh
- 60.6%Danish
- 50.5%Scotch-Irish
- 40.4%Greek
- 40.4%Russian
- 20.2%Arab
- 20.2%Hungarian
- 20.2%Lithuanian
- 20.2%Norwegian
- 20.2%Subsaharan African
Zip codes: 04963.