Races in Rosemont, California (CA) Detailed Stats
Data:
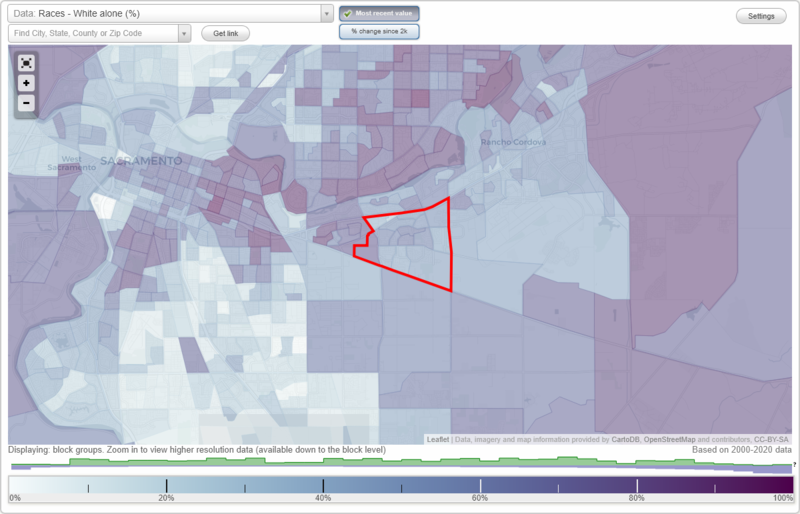
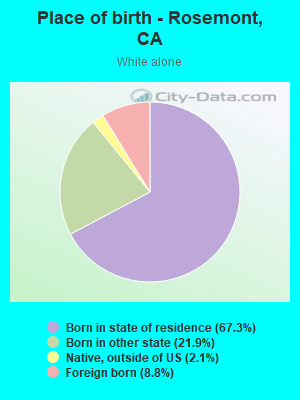
Races - White alone (%)
Races - White alone (% change since 2000)
Races - Black alone (%)
Races - Black alone (% change since 2000)
Races - American Indian alone (%)
Races - American Indian alone (% change since 2000)
Races - Asian alone (%)
Races - Asian alone (% change since 2000)
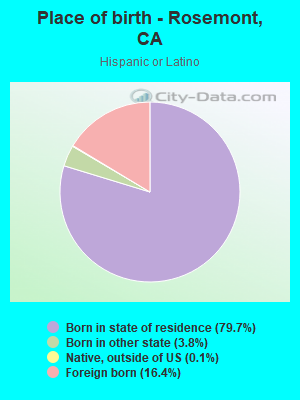
Races - Hispanic (%)
Races - Hispanic (% change since 2000)
Races - Native Hawaiian and Other Pacific Islander alone (%)
Races - Native Hawaiian and Other Pacific Islander alone (% change since 2000)
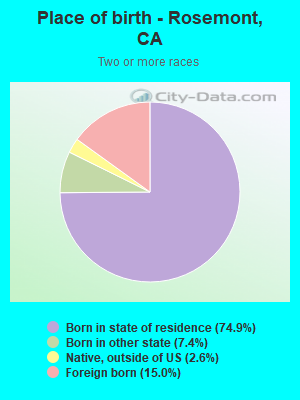
Races - Two or more races(%)
Races - Two or more races(% change since 2000)
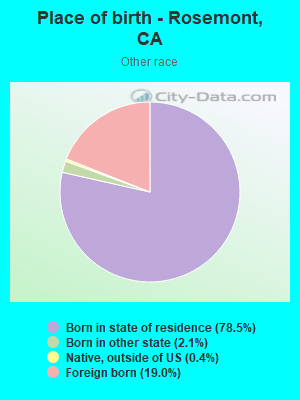
Races - Other race alone (%)
Races - Other race alone (% change since 2000)
Racial diversity
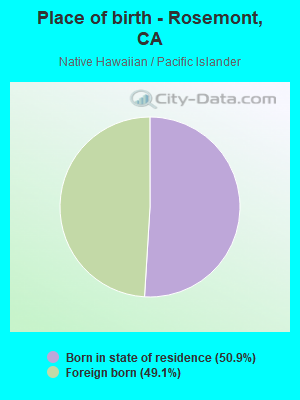
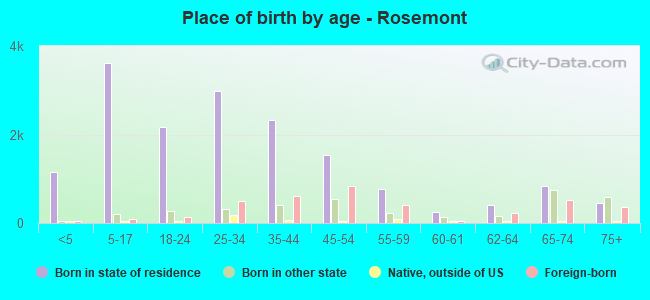
Place of birth - Born in state of residence (%)
Place of birth - Born in state of residence (%) - White
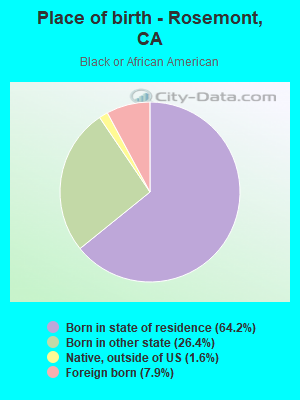
Place of birth - Born in state of residence (%) - Black or African American
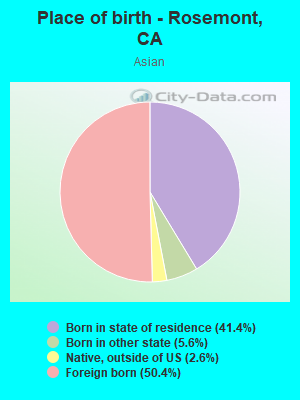
Place of birth - Born in state of residence (%) - Asian
Place of birth - Born in state of residence (%) - Hispanic or Latino
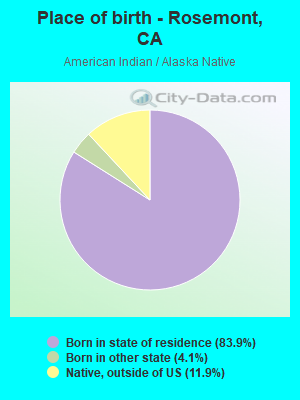
Place of birth - Born in state of residence (%) - American Indian and Alaska Native
Place of birth - Born in state of residence (%) - Multirace
Place of birth - Born in state of residence (%) - Other Race
Place of birth - Born in other state (%)
Place of birth - Born in other state (%) - White
Place of birth - Born in other state (%) - Black or African American
Place of birth - Born in other state (%) - Asian
Place of birth - Born in other state (%) - Hispanic or Latino
Place of birth - Born in other state (%) - American Indian and Alaska Native
Place of birth - Born in other state (%) - Multirace
Place of birth - Born in other state (%) - Other Race
Place of birth - Native, outside of US (%)
Place of birth - Native, outside of US (%) - White
Place of birth - Native, outside of US (%) - Black or African American
Place of birth - Native, outside of US (%) - Asian
Place of birth - Native, outside of US (%) - Hispanic or Latino
Place of birth - Native, outside of US (%) - American Indian and Alaska Native
Place of birth - Native, outside of US (%) - Multirace
Place of birth - Native, outside of US (%) - Other Race
Place of birth - Foreign born (%)
Place of birth - Foreign born (%) - White
Place of birth - Foreign born (%) - Black or African American
Place of birth - Foreign born (%) - Asian
Place of birth - Foreign born (%) - Hispanic or Latino
Place of birth - Foreign born (%) - American Indian and Alaska Native
Place of birth - Foreign born (%) - Multirace
Place of birth - Foreign born (%) - Other Race
Residents speaking English at home (%)
Residents speaking English at home - Born in the United States (%)
Residents speaking English at home - Native, born elsewhere (%)
Residents speaking English at home - Foreign born (%)
Residents speaking Spanish at home (%)
Residents speaking Spanish at home - Born in the United States (%)
Residents speaking Spanish at home - Native, born elsewhere (%)
Residents speaking Spanish at home - Foreign born (%)
Residents speaking other language at home (%)
Residents speaking other language at home - Born in the United States (%)
Residents speaking other language at home - Native, born elsewhere (%)
Residents speaking other language at home - Foreign born (%)
Marital status - Never married (%)
Marital status - Now married (%)
Marital status - Separated (%)
Marital status - Widowed (%)
Marital status - Divorced (%)
Ancestries Reported - Arab (%)
Ancestries Reported - Czech (%)
Ancestries Reported - Danish (%)
Ancestries Reported - Dutch (%)
Ancestries Reported - English (%)
Ancestries Reported - French (%)
Ancestries Reported - French Canadian (%)
Ancestries Reported - German (%)
Ancestries Reported - Greek (%)
Ancestries Reported - Hungarian (%)
Ancestries Reported - Irish (%)
Ancestries Reported - Italian (%)
Ancestries Reported - Lithuanian (%)
Ancestries Reported - Norwegian (%)
Ancestries Reported - Polish (%)
Ancestries Reported - Portuguese (%)
Ancestries Reported - Russian (%)
Ancestries Reported - Scotch-Irish (%)
Ancestries Reported - Scottish (%)
Ancestries Reported - Slovak (%)
Ancestries Reported - Subsaharan African (%)
Ancestries Reported - Swedish (%)
Ancestries Reported - Swiss (%)
Ancestries Reported - Ukrainian (%)
Ancestries Reported - United States (%)
Ancestries Reported - Welsh (%)
Ancestries Reported - West Indian (%)
Ancestries Reported - Other (%)
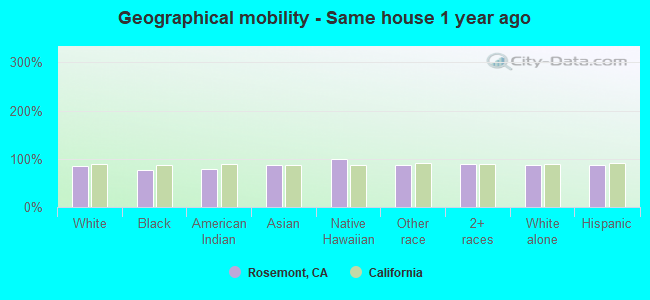
Geographical mobility - Same house 1 year ago (%)
Geographical mobility - Same house 1 year ago (%) - White
Geographical mobility - Same house 1 year ago (%) - Black or African American
Geographical mobility - Same house 1 year ago (%) - Asian
Geographical mobility - Same house 1 year ago (%) - Hispanic or Latino
Geographical mobility - Same house 1 year ago (%) - American Indian and Alaska Native
Geographical mobility - Same house 1 year ago (%) - Multirace
Geographical mobility - Same house 1 year ago (%) - Other Race
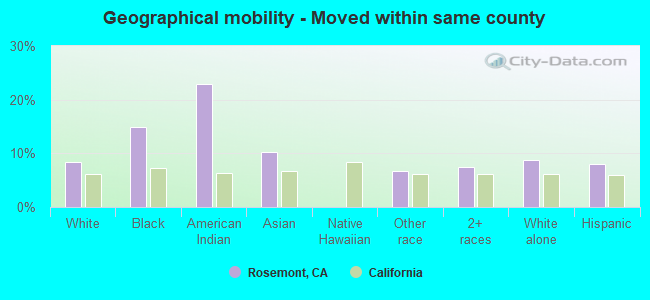
Geographical mobility - Moved within same county (%)
Geographical mobility - Moved within same county (%) - White
Geographical mobility - Moved within same county (%) - Black or African American
Geographical mobility - Moved within same county (%) - Asian
Geographical mobility - Moved within same county (%) - Hispanic or Latino
Geographical mobility - Moved within same county (%) - American Indian and Alaska Native
Geographical mobility - Moved within same county (%) - Multirace
Geographical mobility - Moved within same county (%) - Other Race
Geographical mobility - Moved from different county within same state (%)
Geographical mobility - Moved from different county within same state (%) - White
Geographical mobility - Moved from different county within same state (%) - Black or African American
Geographical mobility - Moved from different county within same state (%) - Asian
Geographical mobility - Moved from different county within same state (%) - Hispanic or Latino
Geographical mobility - Moved from different county within same state (%) - American Indian and Alaska Native
Geographical mobility - Moved from different county within same state (%) - Multirace
Geographical mobility - Moved from different county within same state (%) - Other Race
Geographical mobility - Moved from different state (%)
Geographical mobility - Moved from different state (%) - White
Geographical mobility - Moved from different state (%) - Black or African American
Geographical mobility - Moved from different state (%) - Asian
Geographical mobility - Moved from different state (%) - Hispanic or Latino
Geographical mobility - Moved from different state (%) - American Indian and Alaska Native
Geographical mobility - Moved from different state (%) - Multirace
Geographical mobility - Moved from different state (%) - Other Race
Geographical mobility - Moved from abroad (%)
Geographical mobility - Moved from abroad (%) - White
Geographical mobility - Moved from abroad (%) - Black or African American
Geographical mobility - Moved from abroad (%) - Asian
Geographical mobility - Moved from abroad (%) - Hispanic or Latino
Geographical mobility - Moved from abroad (%) - American Indian and Alaska Native
Geographical mobility - Moved from abroad (%) - Multirace
Geographical mobility - Moved from abroad (%) - Other Race
Place of birth for the foreign-born population - Ireland (%)
Place of birth for the foreign-born population - Denmark (%)
Place of birth for the foreign-born population - Norway (%)
Place of birth for the foreign-born population - Sweden (%)
Place of birth for the foreign-born population - United Kingdom (%)
Place of birth for the foreign-born population - England (%)
Place of birth for the foreign-born population - Scotland (%)
Place of birth for the foreign-born population - Other Northern Europe (%)
Place of birth for the foreign-born population - Austria (%)
Place of birth for the foreign-born population - Belgium (%)
Place of birth for the foreign-born population - France (%)
Place of birth for the foreign-born population - Germany (%)
Place of birth for the foreign-born population - Netherlands (%)
Place of birth for the foreign-born population - Switzerland (%)
Place of birth for the foreign-born population - Other Western Europe (%)
Place of birth for the foreign-born population - Greece (%)
Place of birth for the foreign-born population - Italy (%)
Place of birth for the foreign-born population - Portugal (%)
Place of birth for the foreign-born population - Spain (%)
Place of birth for the foreign-born population - Other Southern Europe (%)
Place of birth for the foreign-born population - Albania (%)
Place of birth for the foreign-born population - Belarus (%)
Place of birth for the foreign-born population - Bosnia and Herzegovina (%)
Place of birth for the foreign-born population - Bulgaria (%)
Place of birth for the foreign-born population - Croatia (%)
Place of birth for the foreign-born population - Czechoslovakia (%)
Place of birth for the foreign-born population - Hungary (%)
Place of birth for the foreign-born population - Latvia (%)
Place of birth for the foreign-born population - Lithuania (%)
Place of birth for the foreign-born population - North Macedonia (Macedonia) (%)
Place of birth for the foreign-born population - Moldova (%)
Place of birth for the foreign-born population - Poland (%)
Place of birth for the foreign-born population - Romania (%)
Place of birth for the foreign-born population - Russia (%)
Place of birth for the foreign-born population - Serbia (%)
Place of birth for the foreign-born population - Ukraine (%)
Place of birth for the foreign-born population - Other Eastern Europe (%)
Place of birth for the foreign-born population - China (%)
Place of birth for the foreign-born population - Hong Kong (%)
Place of birth for the foreign-born population - Taiwan (%)
Place of birth for the foreign-born population - Japan (%)
Place of birth for the foreign-born population - Korea (%)
Place of birth for the foreign-born population - Other Eastern Asia (%)
Place of birth for the foreign-born population - Afghanistan (%)
Place of birth for the foreign-born population - Bangladesh (%)
Place of birth for the foreign-born population - India (%)
Place of birth for the foreign-born population - Iran (%)
Place of birth for the foreign-born population - Kazakhstan (%)
Place of birth for the foreign-born population - Nepal (%)
Place of birth for the foreign-born population - Pakistan (%)
Place of birth for the foreign-born population - Sri Lanka (%)
Place of birth for the foreign-born population - Uzbekistan (%)
Place of birth for the foreign-born population - Other South Central Asia (%)
Place of birth for the foreign-born population - Burma (%)
Place of birth for the foreign-born population - Cambodia (%)
Place of birth for the foreign-born population - Indonesia (%)
Place of birth for the foreign-born population - Laos (%)
Place of birth for the foreign-born population - Malaysia (%)
Place of birth for the foreign-born population - Philippines (%)
Place of birth for the foreign-born population - Singapore (%)
Place of birth for the foreign-born population - Thailand (%)
Place of birth for the foreign-born population - Vietnam (%)
Place of birth for the foreign-born population - Other South Eastern Asia (%)
Place of birth for the foreign-born population - Armenia (%)
Place of birth for the foreign-born population - Iraq (%)
Place of birth for the foreign-born population - Israel (%)
Place of birth for the foreign-born population - Jordan (%)
Place of birth for the foreign-born population - Kuwait (%)
Place of birth for the foreign-born population - Lebanon (%)
Place of birth for the foreign-born population - Saudi Arabia (%)
Place of birth for the foreign-born population - Syria (%)
Place of birth for the foreign-born population - Turkey (%)
Place of birth for the foreign-born population - Yemen (%)
Place of birth for the foreign-born population - Other Western Asia (%)
Place of birth for the foreign-born population - Eritrea (%)
Place of birth for the foreign-born population - Ethiopia (%)
Place of birth for the foreign-born population - Kenya (%)
Place of birth for the foreign-born population - Somalia (%)
Place of birth for the foreign-born population - Uganda (%)
Place of birth for the foreign-born population - Zimbabwe (%)
Place of birth for the foreign-born population - Other Eastern Africa (%)
Place of birth for the foreign-born population - Cameroon (%)
Place of birth for the foreign-born population - Congo (%)
Place of birth for the foreign-born population - Democratic Republic of Congo (Zaire) (%)
Place of birth for the foreign-born population - Other Middle Africa (%)
Place of birth for the foreign-born population - Egypt (%)
Place of birth for the foreign-born population - Morocco (%)
Place of birth for the foreign-born population - Sudan (%)
Place of birth for the foreign-born population - Other Northern Africa (%)
Place of birth for the foreign-born population - South Africa (%)
Place of birth for the foreign-born population - Other Southern Africa (%)
Place of birth for the foreign-born population - Cabo Verde (%)
Place of birth for the foreign-born population - Ghana (%)
Place of birth for the foreign-born population - Liberia (%)
Place of birth for the foreign-born population - Nigeria (%)
Place of birth for the foreign-born population - Senegal (%)
Place of birth for the foreign-born population - Sierra Leone (%)
Place of birth for the foreign-born population - Other Western Africa (%)
Place of birth for the foreign-born population - Australia (%)
Place of birth for the foreign-born population - New Zealand (%)
Place of birth for the foreign-born population - Fiji (%)
Place of birth for the foreign-born population - Micronesia (%)
Place of birth for the foreign-born population - Bahamas (%)
Place of birth for the foreign-born population - Barbados (%)
Place of birth for the foreign-born population - Cuba (%)
Place of birth for the foreign-born population - Dominica (%)
Place of birth for the foreign-born population - Dominican Republic (%)
Place of birth for the foreign-born population - Grenada (%)
Place of birth for the foreign-born population - Haiti (%)
Place of birth for the foreign-born population - Jamaica (%)
Place of birth for the foreign-born population - St. Vincent and the Grenadines (%)
Place of birth for the foreign-born population - Trinidad and Tobago (%)
Place of birth for the foreign-born population - West Indies (%)
Place of birth for the foreign-born population - Other Caribbean (%)
Place of birth for the foreign-born population - Belize (%)
Place of birth for the foreign-born population - Costa Rica (%)
Place of birth for the foreign-born population - El Salvador (%)
Place of birth for the foreign-born population - Guatemala (%)
Place of birth for the foreign-born population - Honduras (%)
Place of birth for the foreign-born population - Mexico (%)
Place of birth for the foreign-born population - Nicaragua (%)
Place of birth for the foreign-born population - Panama (%)
Place of birth for the foreign-born population - Other Central America (%)
Place of birth for the foreign-born population - Argentina (%)
Place of birth for the foreign-born population - Bolivia (%)
Place of birth for the foreign-born population - Brazil (%)
Place of birth for the foreign-born population - Chile (%)
Place of birth for the foreign-born population - Colombia (%)
Place of birth for the foreign-born population - Ecuador (%)
Place of birth for the foreign-born population - Guyana (%)
Place of birth for the foreign-born population - Peru (%)
Place of birth for the foreign-born population - Uruguay (%)
Place of birth for the foreign-born population - Venezuela (%)
Place of birth for the foreign-born population - Other South America (%)
Place of birth for the foreign-born population - Canada (%)
Place of birth for the foreign-born population - Other Northern America (%)
Place of birth for the foreign-born population - Other (%)
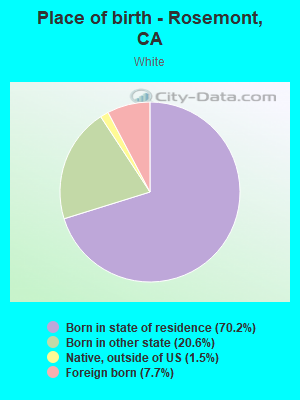
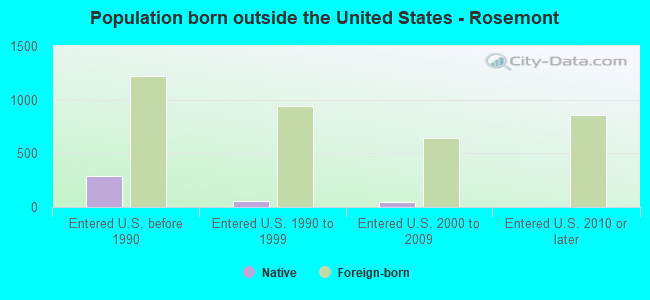
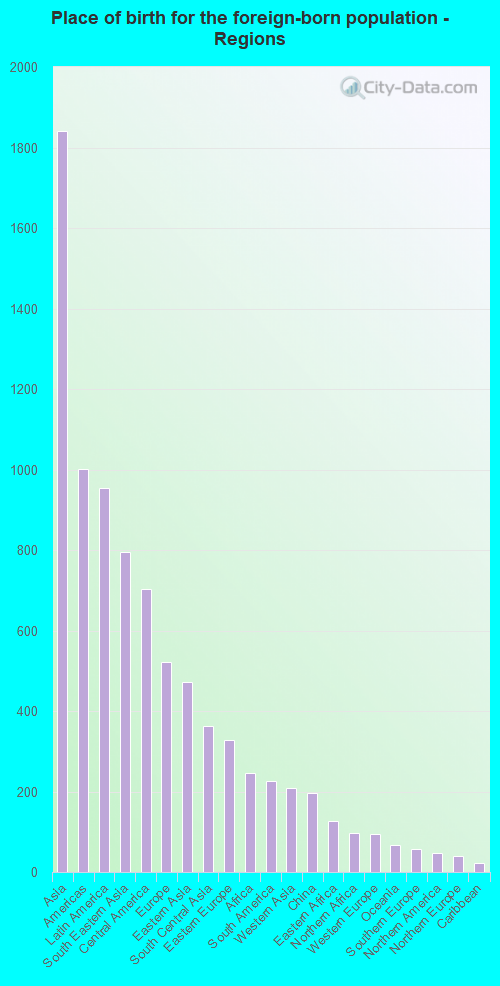
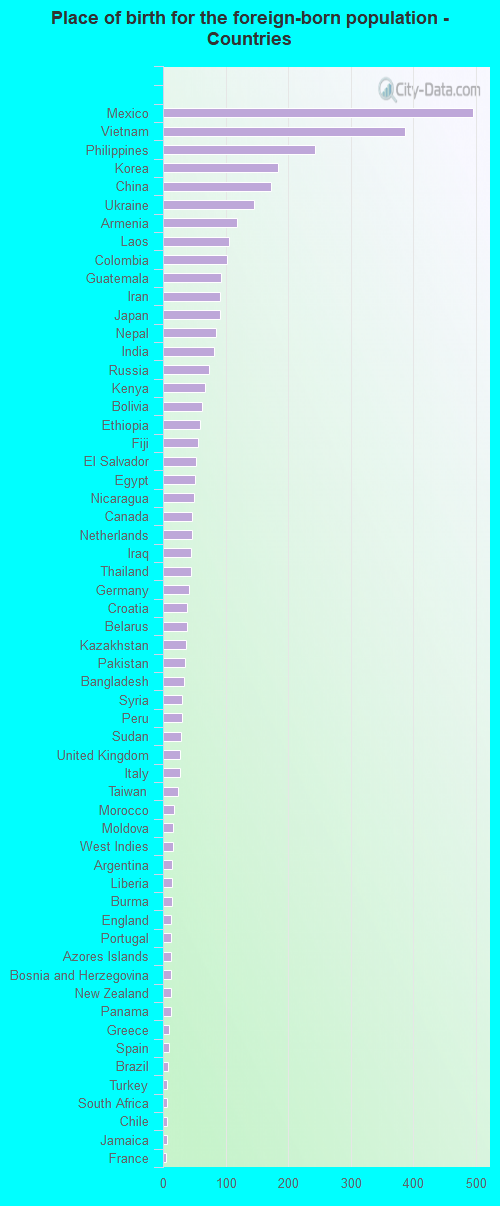
According to 2022 data, the most numerous races in Rosemont, CA are Hispanic (5,515 residents), White alone (10,217 residents), and Asian alone (3,071 residents). 72.8% of Rosemont residents speak English at home. 15.3% of Rosemont, CA residents are foreign-born (7.7% born in Asia, 4.0% born in Latin America, 2.2% born in Europe), which is 70.2% less than the foreign-born rate of 26.0% across the entire state of California.
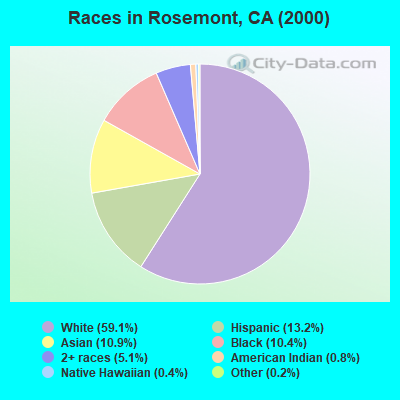
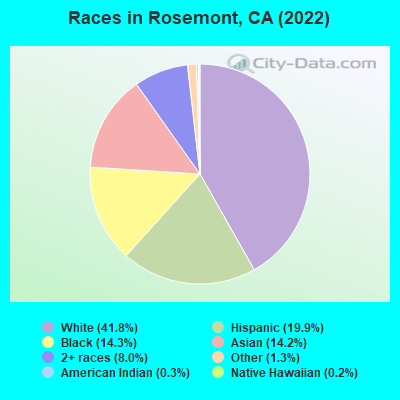
Race distribution in Rosemont
2000 2022
13,531 59.1% White alone 3,023 13.2% Hispanic 2,503 10.9% Asian alone 2,373 10.4% Black alone 1,166 5.1% Two or more races 172 0.8% American Indian alone 89 0.4% Native Hawaiian and Other 47 0.2% Other race alone
10,217 42.4% White alone 5,515 22.9% Hispanic 3,071 12.8% Asian alone 2,758 11.5% Black alone 2,251 9.4% Two or more races 112 0.5% American Indian alone 83 0.3% Native Hawaiian and Other 33 0.1% Other race alone
2000 2022
15,816,790 46.7% White alone 10,966,556 32.4% Hispanic 3,648,860 10.8% Asian alone 2,181,926 6.4% Black alone 903,115 2.7% Two or more races 178,984 0.5% American Indian alone 103,736 0.3% Native Hawaiian and Other 71,681 0.2% Other race alone
15,732,184 40.3% Hispanic 13,160,426 33.7% White alone 5,957,867 15.3% Asian alone 2,025,218 5.2% Black alone 1,663,222 4.3% Two or more races 251,618 0.6% Other race alone 135,777 0.3% Native Hawaiian and Other 103,030 0.3% American Indian alone
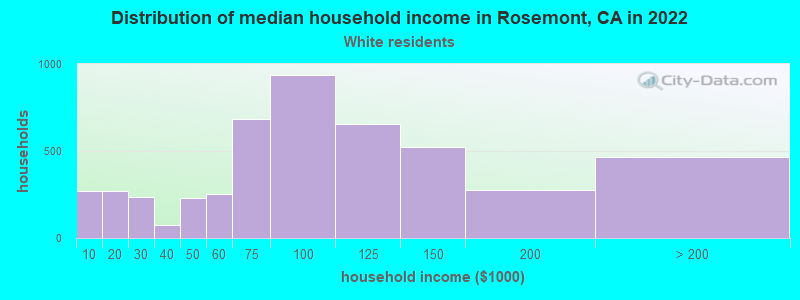
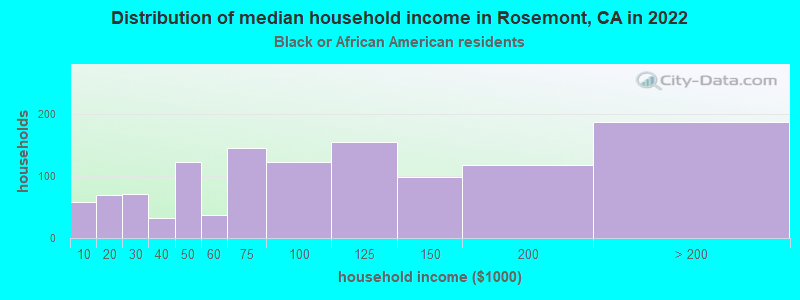
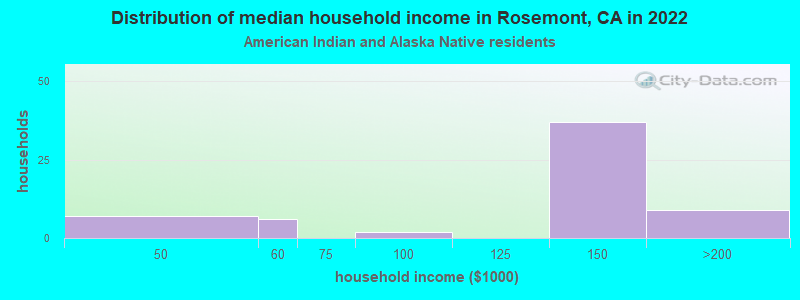
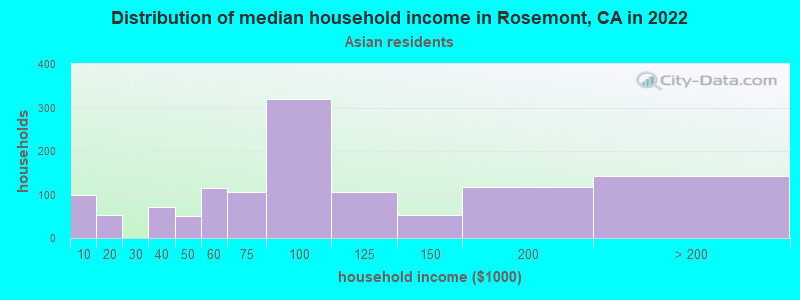
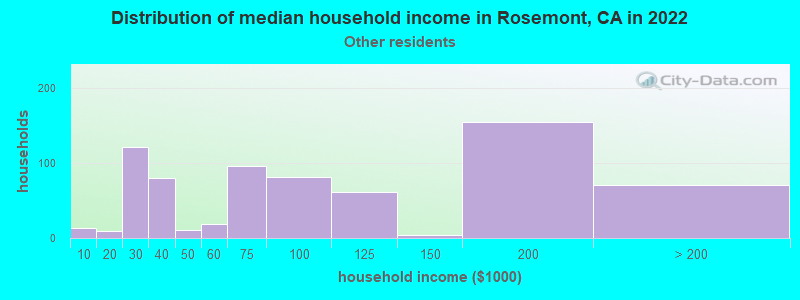
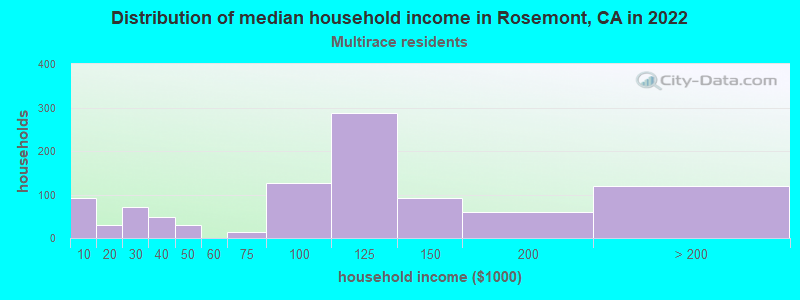
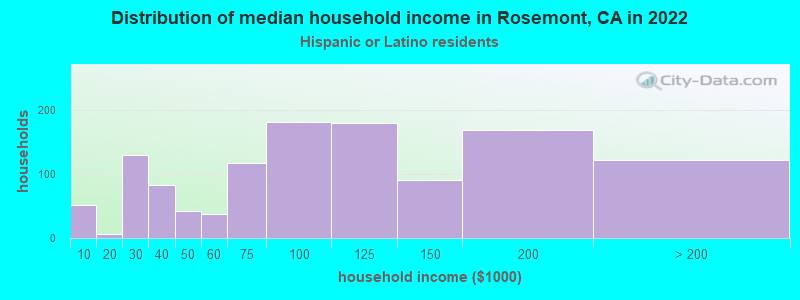
Income and house value in Rosemont Median household income in 2022 $95,693 White non-Hispanic householders$82,912 Black householders$69,499 American Indian and Alaska Native householders$87,071 Asian householders$137,068 Native Hawaiian and other Pacific Islander householders$69,712 Some other race householders$77,121 Two or more races householders$91,383 Hispanic or Latino race householdersMedian 2022 house value $436,594 White Non-Hispanic householders$481,945 Black or African American householders$472,587 American Indian or Alaska Native householders $443,793 Asian householders$438,754 Some other race householders$474,027 Two or more races householders$453,151 Hispanic or Latino householders
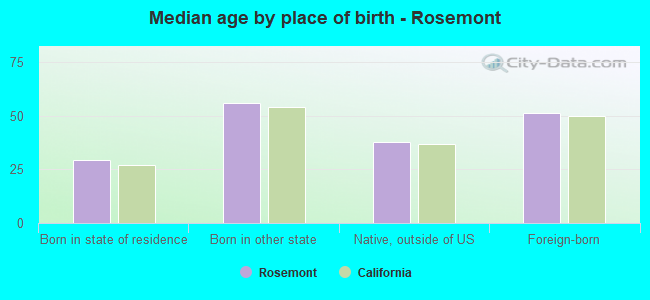
Median age by race in Rosemont
43.2 Median age for White residents41.3 44.9 33.1 Median age for Black or African American residents33.0 33.2 42.2 Median age for American Indian / Alaska Native residents49.7 37.2 39.2 Median age for Asian residents40.3 37.7 34.5 Median age for Native Hawaiian / Pacific Islander residents18.5 46.8 28.3 Median age for Other race residents29.3 25.5 29.3 Median age for Two or more races residents22.6 41.2 42.4 Median age for White alone residents41.2 43.7 28.8 Median age for Hispanic or Latino residents27.5 29.0
Owner/renter occupied households by race in Rosemont
House owners and renters - White residents 2,944 64.3% Owner occupied1,632 35.7% Renter occupiedHouse owners and renters - Black or African American residents 377 34.0% Owner occupied733 66.0% Renter occupiedHouse owners and renters - American Indian / Alaska Native residents 36 100.0% Owner occupiedHouse owners and renters - Asian residents 710 68.6% Owner occupied325 31.4% Renter occupiedHouse owners and renters - Native Hawaiian / Pacific Islander residents 13 100.0% Owner occupiedHouse owners and renters - Other race residents 298 37.7% Owner occupied493 62.3% Renter occupiedHouse owners and renters - Two or more races residents 1,046 50.9% Owner occupied1,007 49.1% Renter occupiedHouse owners and renters - White alone residents 2,841 64.2% Owner occupied1,585 35.8% Renter occupiedHouse owners and renters - Hispanic or Latino residents 730 49.2% Owner occupied755 50.8% Renter occupied
Language usage in Rosemont
English speakers - Total 72.8% of residents of Rosemont speak English at home.
11.1% of residents speak Spanish at home 1,807 72.7% Speak English very well680 27.3% Speak English less than very well16.6% of residents speak other language at home 2,335 62.3% Speak English very well1,410 37.7% Speak English less than very well
English speakers - Born in the United States 92.0% of residents of Rosemont speak English at home.
3.1% of residents speak Spanish at home 118 100.0% Speak English very well5.0% of residents speak other language at home 159 85.0% Speak English very well28 15.0% Speak English less than very well
English speakers - Native, born elsewhere 77.3% of residents of Rosemont speak English at home.
1.4% of residents speak Spanish at home 7 100.0% Speak English less than very well20.7% of residents speak other language at home 56 56.0% Speak English very well44 44.0% Speak English less than very well
English speakers - Foreign-born 15.8% of residents of Rosemont speak English at home.
23.3% of residents speak Spanish at home 299 35.8% Speak English very well537 64.2% Speak English less than very well62.4% of residents speak other language at home 1,078 48.1% Speak English very well1,161 51.9% Speak English less than very well
White (Caucasian) - Speak only English Native:
95.8% (9,146)Foreign-born:
19.2% (158)
White (Caucasian) - Speak another language Native:
7.4% (708)Foreign-born:
81.1% (666)
Black or African American - Speak only English Native:
92.7% (2,262)Foreign-born:
24.9% (55)
Black or African American - Speak another language Native:
8.4% (206)Foreign-born:
74.8% (166)
Asian - Speak only English Native:
48.3% (724)Foreign-born:
20.5% (323)
Asian - Speak another language Native:
51.5% (773)Foreign-born:
81.6% (1,290)
Native Hawaiian / Pacific Islander - Speak another language Native:
97.5% (37)Foreign-born:
98.8% (53)
Other race - Speak only English Native:
55.6% (1,193)Foreign-born:
3.3% (16)
Other race - Speak another language Native:
47.7% (1,022)Foreign-born:
96.1% (479)
Two or more races - Speak only English Native:
70.6% (3,575)Foreign-born:
3.9% (45)
Two or more races - Speak another language Native:
16.4% (832)Foreign-born:
96.9% (1,106)
White alone - Speak only English Native:
91.5% (8,201)Foreign-born:
19.2% (174)
White alone - Speak another language Native:
8.2% (731)Foreign-born:
81.0% (734)
Hispanic or Latino - Speak only English Native:
72.9% (3,219)Foreign-born:
1.9% (16)
Hispanic or Latino - Speak another language Native:
30.5% (1,345)Foreign-born:
97.5% (833)
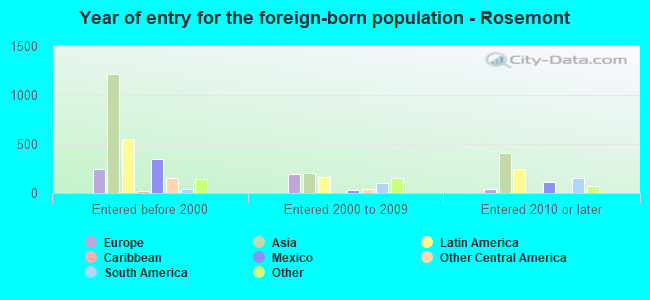
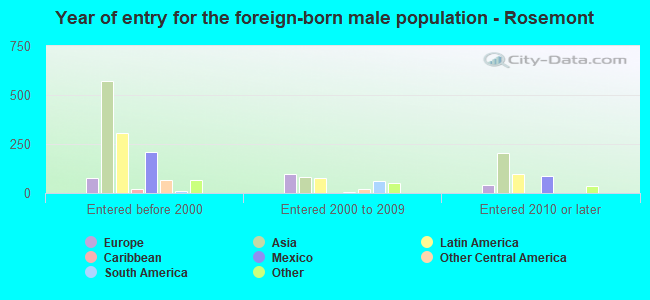
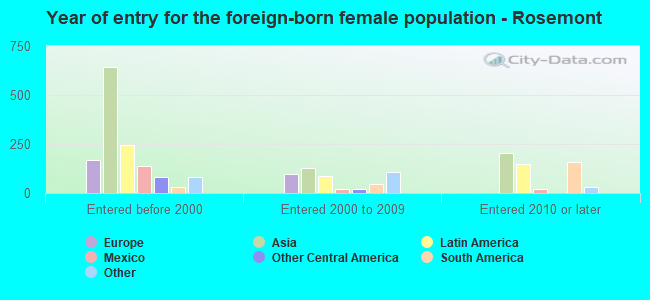
Foreign-born residents in Rosemont 3,678 residents are foreign born (7.7% Asia , 4.0% Latin America , 2.2% Europe ).
This city:
15.3%California:
100.0%
Marital status for residents in Rosemont Marital status - White (Caucasian) population 15 years and over
Males 40.0% Never married42.1% Now married2.6% Separated2.8% Widowed12.6% DivorcedFemales 29.2% Never married41.8% Now married1.9% Separated8.1% Widowed19.0% DivorcedWomen who gave birth in the past 12 months Now married:
57.4% (67)Unmarried:
42.6% (50)
Women who did not give birth in the past 12 months Now married:
40.8% (882)Unmarried:
59.2% (1,280)
Marital status - Black or African American population 15 years and over
Males 54.6% Never married33.8% Now married1.4% Separated1.8% Widowed8.4% DivorcedFemales 53.9% Never married22.8% Now married9.1% Separated5.1% Widowed9.0% DivorcedWomen who gave birth in the past 12 months Now married:
25.0% (22)Unmarried:
75.0% (66)
Women who did not give birth in the past 12 months Now married:
19.1% (142)Unmarried:
80.9% (604)
Marital status - American Indian / Alaska Native population 15 years and over
Males 30.2% Never married69.8% Now married0.0% Separated0.0% Widowed0.0% DivorcedFemales 26.7% Never married30.8% Now married13.0% Separated0.0% Widowed29.5% DivorcedWomen who did not give birth in the past 12 months Now married:
0.0% (0)Unmarried:
100.0% (86)
Marital status - Asian population 15 years and over
Males 37.3% Never married58.4% Now married1.8% Separated1.0% Widowed1.4% DivorcedFemales 37.1% Never married46.0% Now married0.3% Separated7.4% Widowed9.2% DivorcedWomen who gave birth in the past 12 months Now married:
56.4% (23)Unmarried:
43.6% (18)
Women who did not give birth in the past 12 months Now married:
38.2% (379)Unmarried:
61.8% (612)
Marital status - Native Hawaiian / Pacific Islander population 15 years and over
Males 74.0% Never married26.0% Now married0.0% Separated0.0% Widowed0.0% DivorcedFemales 17.6% Never married35.3% Now married0.0% Separated47.1% Widowed0.0% DivorcedWomen who did not give birth in the past 12 months Now married:
66.7% (12)Unmarried:
33.3% (6)
Marital status - Other race population 15 years and over
Males 59.3% Never married31.4% Now married2.8% Separated0.0% Widowed6.5% DivorcedFemales 68.5% Never married30.0% Now married0.0% Separated1.5% Widowed0.0% DivorcedWomen who gave birth in the past 12 months Now married:
0.0% (0)Unmarried:
100.0% (27)
Women who did not give birth in the past 12 months Now married:
24.8% (240)Unmarried:
75.2% (727)
Marital status - Two or more races population 15 years and over
Males 62.7% Never married25.7% Now married1.5% Separated1.8% Widowed8.3% DivorcedFemales 43.2% Never married38.6% Now married0.0% Separated4.6% Widowed13.6% DivorcedWomen who did not give birth in the past 12 months Now married:
40.7% (860)Unmarried:
59.3% (1,254)
Marital status - White alone, not Hispanic / Latino population 15 years and over
Males 37.5% Never married44.4% Now married2.2% Separated3.3% Widowed12.6% DivorcedFemales 28.0% Never married42.4% Now married1.2% Separated8.5% Widowed19.9% DivorcedWomen who gave birth in the past 12 months Now married:
90.5% (69)Unmarried:
9.5% (7)
Women who did not give birth in the past 12 months Now married:
41.2% (911)Unmarried:
58.8% (1,298)
Marital status - Hispanic or Latino population 15 years and over
Males 57.3% Never married29.9% Now married3.3% Separated0.0% Widowed9.5% DivorcedFemales 54.5% Never married32.1% Now married2.3% Separated3.7% Widowed7.3% DivorcedWomen who gave birth in the past 12 months Now married:
12.0% (14)Unmarried:
88.0% (101)
Women who did not give birth in the past 12 months Now married:
28.3% (400)Unmarried:
71.7% (1,015)
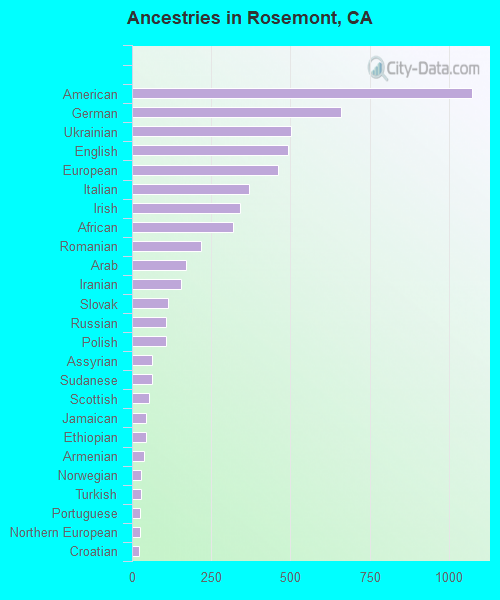
Ancestries in Rosemont
479 4.1% American383 3.3% German342 2.9% English267 2.3% Russian259 2.2% Irish237 2.0% Italian211 1.8% European186 1.6% Iranian176 1.5% Sudanese171 1.5% Armenian97 0.8% African84 0.7% Ukrainian81 0.7% Norwegian56 0.5% Northern European49 0.4% Scottish46 0.4% Dutch41 0.4% Polish37 0.3% British36 0.3% Estonian33 0.3% Croatian32 0.3% Greek27 0.2% Portuguese27 0.2% Jamaican25 0.2% Egyptian24 0.2% Austrian21 0.2% Eastern European18 0.2% Moroccan18 0.2% Ethiopian18 0.2% Canadian15 0.1% Syrian14 0.1% French14 0.1% Romanian14 0.1% West Indian13 0.1% Arab13 0.1% Danish11 0.09% Swedish9 0.08% Scandinavian9 0.08% Scotch-Irish8 0.07% Yugoslavian7 0.06% Swiss5 0.04% Hungarian5 0.04% Maltese
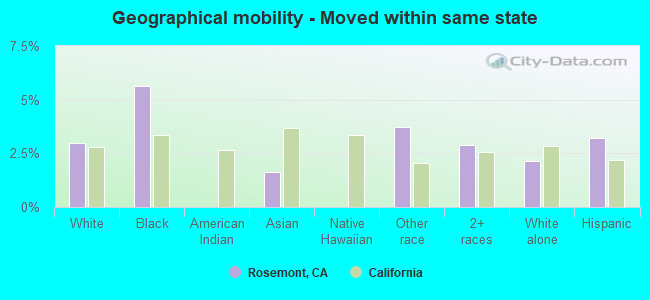
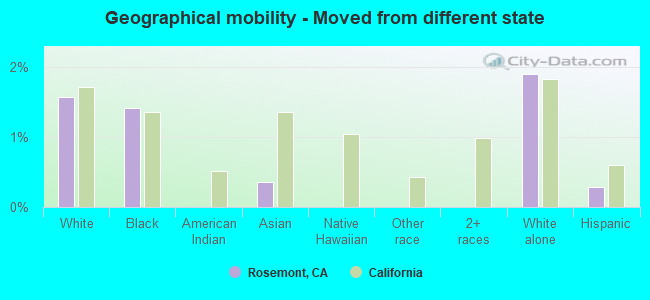
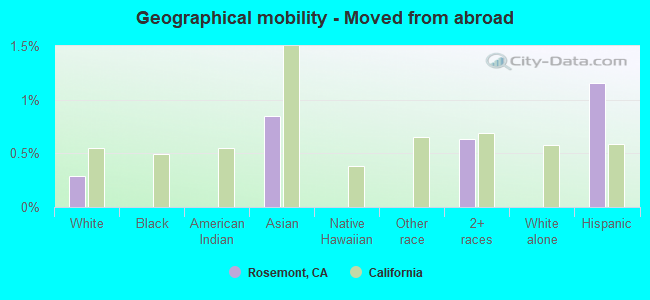
Geographical mobility in Rosemont Same house 1 year ago 8,941 86.3% White (Caucasian)2,123 76.8% Black or African American274 77.9% American Indian / Alaska Native2,744 87.0% Asian85 100.0% Native Hawaiian / Pacific Islander2,419 88.1% Other race5,518 89.2% Two or more races8,890 87.1% White alone, not Hispanic / Latino4,544 87.0% Hispanic or LatinoMoved within same county 878 8.5% White / Caucasian414 15.0% Black or African American81 23.0% American Indian / Alaska Native321 10.2% Asian182 6.6% Other race457 7.4% Two or more races893 8.8% White alone, not Hispanic / Latino415 7.9% Hispanic or LatinoMoved within same state 307 3.0% White / Caucasian156 5.7% Black or African American51 1.6% Asian102 3.7% Other race177 2.9% Two or more races220 2.2% White alone, not Hispanic / Latino168 3.2% Hispanic or LatinoMoved from different state 164 1.6% White / Caucasian39 1.4% Black or African American11 0.4% Asian194 1.9% White alone, not Hispanic / Latino15 0.3% Hispanic or LatinoMoved from abroad 30 0.3% White27 0.8% Asian39 0.6% Two or more races60 1.2% Hispanic or Latino
Children Nativity (place of birth) in Rosemont
Children under 6 years - Living with two parents Both parents native 467 100.0% NativeBoth parents foreign-born 96 94.7% Native5 5.3% Foreign-bornOne native, one foreign-born parent 189 100.0% NativeChildren under 6 years - Living with one parent Native parent 575 100.0% NativeForeign-born parent 31 100.0% NativeChildren 6 to 17 years - Living with two parents Both parents native 1,001 98.4% Native16 1.6% Foreign-bornBoth parents foreign-born 478 92.5% Native39 7.5% Foreign-bornOne native, one foreign-born parent 231 100.0% NativeChildren 6 to 17 years - Living with one parent Native parent 1,214 100.0% NativeForeign-born parent 336 52.5% Native304 47.5% Foreign-born
Grandparents responsible for own grandchildren in Rosemont
Grandparents (30 to 59 years) White / Caucasian 25 48.0% Responsible for grandchildren27 52.0% Not responsible for grandchildrenBlack or African American 15 100.0% Not responsible for grandchildrenAmerican Indian / Alaska Native 9 25.0% Responsible for grandchildren27 75.0% Not responsible for grandchildrenWhite alone, not Hispanic / Latino 25 39.4% Responsible for grandchildren38 60.6% Not responsible for grandchildrenHispanic or Latino 16 100.0% Responsible for grandchildrenGrandparents (60 years and over) White / Caucasian 11 14.9% Responsible for grandchildren64 85.1% Not responsible for grandchildrenBlack or African American 9 68.8% Responsible for grandchildren4 31.2% Not responsible for grandchildrenWhite alone, not Hispanic / Latino 13 12.3% Responsible for grandchildren91 87.7% Not responsible for grandchildrenHispanic or Latino 21 38.9% Responsible for grandchildren33 61.1% Not responsible for grandchildren