Estimated zip code population in 2022: 39,871 Zip code population in 2010: 36,628 Zip code population in 2000: 38,799
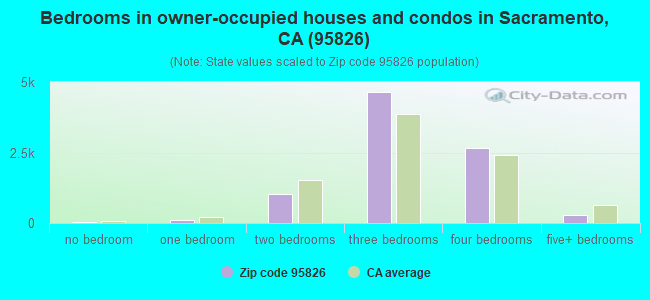
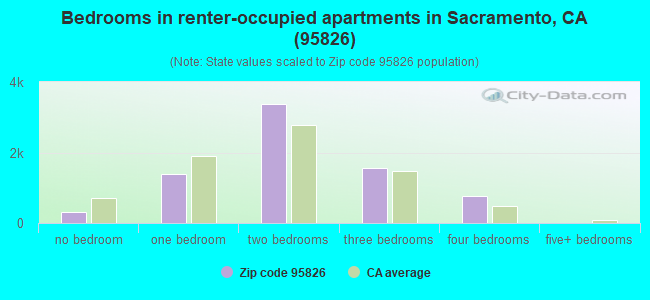
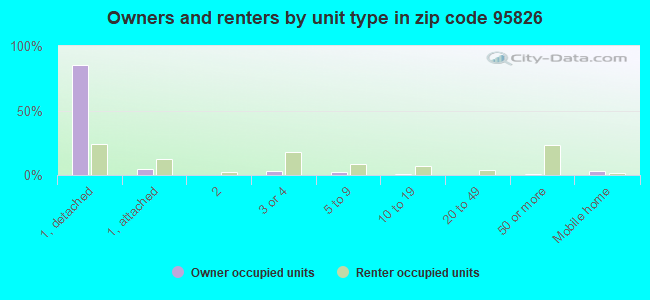
Houses and condos: 16,998 Renter-occupied apartments: 7,445
% of renters here:
46%
State:
44%
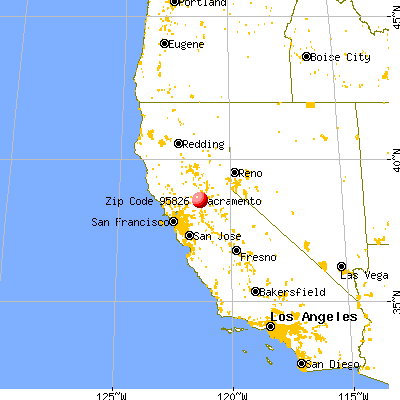
March 2022 cost of living index in zip code 95826: 101.4 (near average, U.S. average is 100)
Land area: 11.5 sq. mi. Water area: 0.2 sq. mi.
Population density: 3,460 people per square mile
(average).
OSM Map
General Map
Google Map
MSN Map
OSM Map
General Map
Google Map
MSN Map
OSM Map
General Map
Google Map
MSN Map
OSM Map
General Map
Google Map
MSN Map
Please wait while loading the map...
Real estate property taxes paid for housing units in 2022:
This zip code:
0.6% ($2,730)
California:
0.7% ($4,831)
Median real estate property taxes paid for housing units with mortgages in 2022: $3,038 (0.7%) Median real estate property taxes paid for housing units with no mortgage in 2022: $1,860 (0.4%)
Averages for the 2020 tax year for zip code 95826, filed in 2021:
Average Adjusted Gross Income (AGI) in 2020: $58,944 (Individual Income Tax Returns)
Here:
$58,944
State:
$95,910
Salary/wage: $52,455 (reported on 81.4% of returns)
Here:
$52,455
State:
$77,331
(% of AGI for various income ranges: 1198.5% for AGIs below $25k, 3840.3% for AGIs $25k-50k, 6855.6% for AGIs $50k-75k, 9709.8% for AGIs $75k-100k, 18383.2% for AGIs $100k-200k, 56557.5% for AGIs over 200k)
Taxable interest for individuals: $687 (reported on 34.6% of returns)
This zip code:
$687
California:
$2,294
(% of AGI for various income ranges: 8.1% for AGIs below $25k, 11.6% for AGIs $25k-50k, 23.7% for AGIs $50k-75k, 47.1% for AGIs $75k-100k, 117.6% for AGIs $100k-200k, 740.8% for AGIs over 200k)
Ordinary dividends: $2,957 (reported on 14.3% of returns)
Here:
$2,957
State:
$10,949
(% of AGI for various income ranges: 11.1% for AGIs below $25k, 18.9% for AGIs $25k-50k, 44.1% for AGIs $50k-75k, 71.4% for AGIs $75k-100k, 205.2% for AGIs $100k-200k, 1634.2% for AGIs over 200k)
Net capital gain/loss in AGI: +$8,130 (reported on 13.6% of returns)
Here:
+$8,130
State:
+$49,306
(% of AGI for various income ranges: 4.7% for AGIs below $25k, 17.6% for AGIs $25k-50k, 53.4% for AGIs $50k-75k, 75.9% for AGIs $75k-100k, 351.8% for AGIs $100k-200k, 10771.7% for AGIs over 200k)
Profit/loss from business: +$9,250 (reported on 13.1% of returns)
Here:
+$9,250
State:
+$15,671
(% of AGI for various income ranges: 67.2% for AGIs below $25k, 125.5% for AGIs $25k-50k, 123.3% for AGIs $50k-75k, 144.8% for AGIs $75k-100k, 393.9% for AGIs $100k-200k, 4296.7% for AGIs over 200k)
Taxable individual retirement arrangement distribution: $14,340 (reported on 6.7% of returns)
95826:
$14,340
California:
$23,505
(% of AGI for various income ranges: 38.1% for AGIs below $25k, 60.4% for AGIs $25k-50k, 129.5% for AGIs $50k-75k, 217.3% for AGIs $75k-100k, 453.9% for AGIs $100k-200k, 1722.5% for AGIs over 200k)
Self-employed (Keogh) retirement plans: $15,725 (reported on 0.2% of returns)
95826:
$15,725
California:
$30,163
(% of AGI for various income ranges: 42.5% for AGIs $100k-200k)
Total itemized deductions: $24,501 (reported on 9.8% of returns)
Here:
$24,501
State:
$39,517
(% of AGI for various income ranges: 34.4% for AGIs below $25k, 89.9% for AGIs $25k-50k, 436.9% for AGIs $50k-75k, 733.1% for AGIs $75k-100k, 1168.9% for AGIs $100k-200k, 3570.8% for AGIs over 200k)
Charity contributions: $5,387 (reported on 7.5% of returns)
Here:
$5,387
State:
$12,598
(% of AGI for various income ranges: 2.0% for AGIs below $25k, 10.0% for AGIs $25k-50k, 49.1% for AGIs $50k-75k, 86.8% for AGIs $75k-100k, 236.5% for AGIs $100k-200k, 1273.3% for AGIs over 200k)
Taxes paid: $7,593 (reported on 9.8% of returns)
95826:
$7,593
State:
$8,807
(% of AGI for various income ranges: 5.7% for AGIs below $25k, 18.5% for AGIs $25k-50k, 123.0% for AGIs $50k-75k, 252.2% for AGIs $75k-100k, 406.3% for AGIs $100k-200k, 993.3% for AGIs over 200k)
Earned income credit: $1,918 (reported on 13.3% of returns)
Here:
$1,918
State:
$2,074
(% of AGI for various income ranges: 71.6% for AGIs below $25k, 49.2% for AGIs $25k-50k, 0.7% for AGIs $50k-75k)
Percentage of individuals using paid preparers for their 2020 taxes: 92.3%
Here:
92%
State:
92%
(% for various income ranges: 91.8% for AGIs below $25k, 93.6% for AGIs $25k-50k, 92.4% for AGIs $50k-75k, 90.6% for AGIs $75k-100k, 92.0% for AGIs $100k-200k, 92.5% for AGIs over 200k)
Averages for the 2012 tax year for zip code 95826, filed in 2013:
Average Adjusted Gross Income (AGI) in 2012: $48,157 (Individual Income Tax Returns)
Here:
$48,157
State:
$72,726
Salary/wage: $41,237 (reported on 81.4% of returns)
Here:
$41,237
State:
$59,079
(% of AGI for various income ranges: 73.8% for AGIs below $25k, 78.8% for AGIs $25k-50k, 73.6% for AGIs $50k-75k, 70.3% for AGIs $75k-100k, 67.8% for AGIs $100k-200k, 28.5% for AGIs over 200k)
Taxable interest for individuals: $946 (reported on 37.5% of returns)
This zip code:
$946
California:
$2,146
(% of AGI for various income ranges: 0.8% for AGIs below $25k, 0.4% for AGIs $25k-50k, 0.6% for AGIs $50k-75k, 0.6% for AGIs $75k-100k, 0.6% for AGIs $100k-200k, 3.5% for AGIs over 200k)
Ordinary dividends: $2,696 (reported on 15.8% of returns)
Here:
$2,696
State:
$9,308
(% of AGI for various income ranges: 0.9% for AGIs below $25k, 0.6% for AGIs $25k-50k, 0.8% for AGIs $50k-75k, 0.9% for AGIs $75k-100k, 1.0% for AGIs $100k-200k, 1.1% for AGIs over 200k)
Net capital gain/loss in AGI: +$11,307 (reported on 11.8% of returns)
Here:
+$11,307
State:
+$30,460
(% of AGI for various income ranges: 0.1% for AGIs $25k-50k, 0.2% for AGIs $50k-75k, 0.4% for AGIs $75k-100k, 0.8% for AGIs $100k-200k, 38.0% for AGIs over 200k)
Profit/loss from business: +$9,751 (reported on 12.7% of returns)
Here:
+$9,751
State:
+$17,064
(% of AGI for various income ranges: 7.5% for AGIs below $25k, 2.1% for AGIs $25k-50k, 1.9% for AGIs $50k-75k, 1.7% for AGIs $75k-100k, 1.4% for AGIs $100k-200k, 5.5% for AGIs over 200k)
Taxable individual retirement arrangement distribution: $12,554 (reported on 8.8% of returns)
95826:
$12,554
California:
$19,557
(% of AGI for various income ranges: 2.1% for AGIs below $25k, 1.9% for AGIs $25k-50k, 2.1% for AGIs $50k-75k, 2.5% for AGIs $75k-100k, 3.3% for AGIs $100k-200k)
Self-employment retirement plans: $11,050 (reported on 0.4% of returns)
95826:
$11,050
California:
$24,530
Total itemized deductions: $21,326 (25% of AGI, reported on 30.8% of returns)
Here:
$21,326
State:
$34,004
Here:
25.3% of AGI
State:
22.7% of AGI
(% of AGI for various income ranges: 7.0% for AGIs below $25k, 9.0% for AGIs $25k-50k, 12.8% for AGIs $50k-75k, 15.1% for AGIs $75k-100k, 14.6% for AGIs $100k-200k, 33.4% for AGIs over 200k)
Charity contributions: $3,637 (reported on 25.7% of returns)
Here:
$3,637
State:
$4,659
(% of AGI for various income ranges: 0.5% for AGIs below $25k, 1.0% for AGIs $25k-50k, 1.5% for AGIs $50k-75k, 1.8% for AGIs $75k-100k, 2.0% for AGIs $100k-200k, 8.9% for AGIs over 200k)
Taxes paid: $6,067 (reported on 30.6% of returns)
95826:
$6,067
State:
$14,448
(% of AGI for various income ranges: 1.2% for AGIs below $25k, 1.9% for AGIs $25k-50k, 3.7% for AGIs $50k-75k, 4.7% for AGIs $75k-100k, 5.7% for AGIs $100k-200k, 5.4% for AGIs over 200k)
Earned income credit: $2,058 (reported on 17.7% of returns)
Here:
$2,058
State:
$2,286
(% of AGI for various income ranges: 5.7% for AGIs below $25k, 0.9% for AGIs $25k-50k)
Percentage of individuals using paid preparers for their 2012 taxes: 47.0%
Here:
47%
State:
64%
(% for various income ranges: 43.8% for AGIs below $25k, 45.9% for AGIs $25k-50k, 49.1% for AGIs $50k-75k, 50.0% for AGIs $75k-100k, 54.1% for AGIs $100k-200k, 75.0% for AGIs over 200k)
Averages for the 2004 tax year for zip code 95826, filed in 2005:
Average Adjusted Gross Income (AGI) in 2004: $44,576 (Individual Income Tax Returns)
Here:
$44,576
State:
$58,600
Salary/wage: $38,082 (reported on 85.1% of returns)
Here:
$38,082
State:
$49,455
(% of AGI for various income ranges: 117.1% for AGIs below $10k, 78.5% for AGIs $10k-25k, 83.3% for AGIs $25k-50k, 79.5% for AGIs $50k-75k, 79.1% for AGIs $75k-100k, 49.1% for AGIs over 100k)
Taxable interest for individuals: $1,053 (reported on 46.8% of returns)
This zip code:
$1,053
California:
$2,365
(% of AGI for various income ranges: 3.0% for AGIs below $10k, 1.4% for AGIs $10k-25k, 0.9% for AGIs $25k-50k, 1.0% for AGIs $50k-75k, 0.8% for AGIs $75k-100k, 1.4% for AGIs over 100k)
Taxable dividends: $1,605 (reported on 19.4% of returns)
Here:
$1,605
State:
$4,746
(% of AGI for various income ranges: 2.6% for AGIs below $10k, 0.9% for AGIs $10k-25k, 0.5% for AGIs $25k-50k, 0.7% for AGIs $50k-75k, 0.6% for AGIs $75k-100k, 0.8% for AGIs over 100k)
Net capital gain/loss: +$10,919 (reported on 15.2% of returns)
Here:
+$10,919
State:
+$23,418
(% of AGI for various income ranges: -2.1% for AGIs below $10k, -0.1% for AGIs $10k-25k, 0.2% for AGIs $25k-50k, 0.5% for AGIs $50k-75k, 1.3% for AGIs $75k-100k, 12.7% for AGIs over 100k)
Profit/loss from business: +$10,557 (reported on 12.3% of returns)
Here:
+$10,557
State:
+$16,826
(% of AGI for various income ranges: 3.9% for AGIs below $10k, 5.1% for AGIs $10k-25k, 2.1% for AGIs $25k-50k, 2.0% for AGIs $50k-75k, 1.8% for AGIs $75k-100k, 4.3% for AGIs over 100k)
IRA payment deduction: $2,682 (reported on 2.1% of returns)
95826:
$2,682
California:
$3,192
(% of AGI for various income ranges: 0.2% for AGIs below $10k, 0.2% for AGIs $10k-25k, 0.2% for AGIs $25k-50k, 0.1% for AGIs $50k-75k, 0.1% for AGIs $75k-100k, 0.1% for AGIs over 100k)
Self-employed pension: $11,106 (reported on 0.6% of returns)
Here:
$11,106
California:
$17,688
(% of AGI for various income ranges: 0.4% for AGIs below $10k, 0.0% for AGIs $25k-50k, 0.1% for AGIs $50k-75k, 0.1% for AGIs $75k-100k, 0.3% for AGIs over 100k)
Total itemized deductions: $18,674 (26% of AGI, reported on 35.7% of returns)
Here:
$18,674
State:
$28,113
Here:
25.8% of AGI
State:
25.3% of AGI
(% of AGI for various income ranges: 11.2% for AGIs below $10k, 8.6% for AGIs $10k-25k, 13.8% for AGIs $25k-50k, 17.6% for AGIs $50k-75k, 18.8% for AGIs $75k-100k, 13.5% for AGIs over 100k)
Charity contributions deductions: $2,461 (3% of AGI, reported on 31.3% of returns)
Here:
$2,461
State:
$3,923
Here:
3.3% of AGI
State:
3.3% of AGI
(% of AGI for various income ranges: 0.5% for AGIs below $10k, 0.8% for AGIs $10k-25k, 1.3% for AGIs $25k-50k, 2.0% for AGIs $50k-75k, 2.5% for AGIs $75k-100k, 1.8% for AGIs over 100k)
Total tax: $5,552 (reported on 80.0% of returns)
95826:
$5,552
State:
$10,761
(% of AGI for various income ranges: 3.0% for AGIs below $10k, 4.6% for AGIs $10k-25k, 7.4% for AGIs $25k-50k, 9.5% for AGIs $50k-75k, 10.5% for AGIs $75k-100k, 14.4% for AGIs over 100k)
Earned income credit: $1,525 (reported on 12.8% of returns)
Here:
$1,525
State:
$1,763
Percentage of individuals using paid preparers for their 2004 taxes: 50.5%
Here:
51%
State:
66%
(% for various income ranges: 41.2% for AGIs below $10k, 49.6% for AGIs $10k-25k, 49.9% for AGIs $25k-50k, 54.1% for AGIs $50k-75k, 58.0% for AGIs $75k-100k, 61.6% for AGIs over 100k)
Likely homosexual households (counted as self-reported same-sex unmarried-partner households)
Lesbian couples: 0.1% of all households
Gay men: 0.1% of all households
Household received Food Stamps/SNAP in the past 12 months: 1,980 Household did not receive Food Stamps/SNAP in the past 12 months: 14,202
Women who had a birth in the past 12 months: 538 (447 now married, 89 unmarried) Women who did not have a birth in the past 12 months: 10,893 (3,564 now married, 7,360 unmarried)
Housing units in zip code 95826 with a mortgage: 5,939 (269 second mortgage, 170 both second mortgage and home equity loan) Houses without a mortgage: 57
Median monthly owner costs for units with a mortgage: $1,930 Median monthly owner costs for units without a mortgage: $583
Residents with income below the poverty level in 2022:
This zip code:
16.6%
Whole state:
12.2%
Residents with income below 50% of the poverty level in 2022:
This zip code:
6.0%
Whole state:
6.2%
Median number of rooms in houses and condos:
Here:
6.0
State:
6.0
Median number of rooms in apartments:
Here:
4.1
State:
3.9
Notable locations in this zip code not listed on our city pages
Notable locations in zip code 95826: Cordova Recreation Golf Course (A), E A Fairbairn Treatment Plant (B), California Youth Authority Corrections Center and Clinic (C), University Union (D), University House (E), Mendocino Hall (F), Douglass Hall (G), W R Ridgeway Family Relations Courthouse (H), Sacramento Metropolitan Fire District Station 64 (I), Sacramento Metropolitan Fire District Station 54 (J), Sacramento City Fire Department Station 60 (K), Sacramento County Sheriff - Rosemont Service Center (L), Carol Miller Justice Center (M). Display/hide their locations on the map
Churches in zip code 95826 include: Calvary Chapel (A), Saint Lukes Community Church (B), Valley Community Church (C), Atonement Lutheran Church (D), Emmanuel Korean Baptist Church (E), Kingdom Hall of Jehovahs Witnesses (F), The Christian Community Church (G), The Family Church (H), Christ Unity Church (I). Display/hide their locations on the map
Parks in zip code 95826 include: Hornet Stadium (1), Glenbrook Park (2), Manlove Park (3), Oki Park (4), Rosemont Community Park (5), Salmon Falls Park (6), Granite Park (7), Jefferson School Park (8), Rosswood Park (9). Display/hide their locations on the map
4,856 married couples with children.
2,314 single-parent households (947 men, 1,367 women).
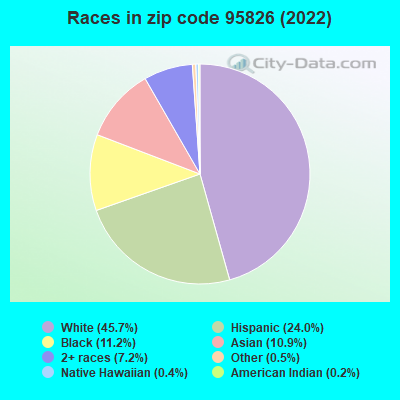
74.0% of residents of 95826 zip code speak English at home.
11.2% of residents speak Spanish at home (79% very well, 13% well, 6% not well, 2% not at all).
4.8% of residents speak other Indo-European language at home (60% very well, 30% well, 5% not well, 5% not at all).
7.2% of residents speak Asian or Pacific Island language at home (53% very well, 28% well, 16% not well, 3% not at all).
2.5% of residents speak other language at home (68% very well, 20% well, 11% not well, 1% not at all).
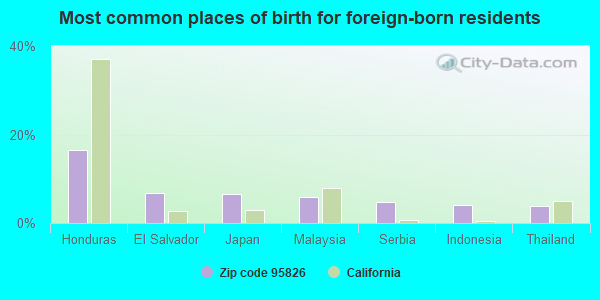
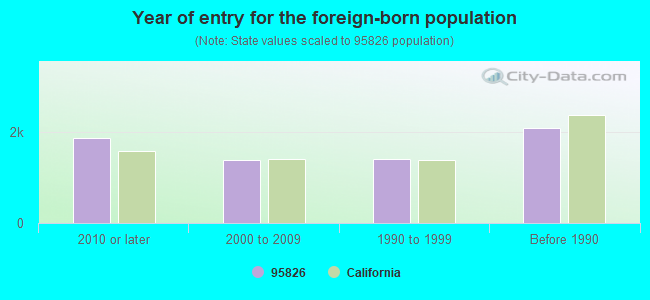
Foreign born population: 6,054 (15.2%) (58.3% of them are naturalized citizens)
Major facilities with environmental interests located in this zip code:
ALOHA CLEANERS (3309 JULLIARD DR in SACRAMENTO, CA)
STATE MASTER (California - Hazardous Waste Tracking) - HAZARDOU WASTE PROGRAM CRITERIA AND HAZARDOUS AIR POLLUTANT INVENTORY (Inventory of air pollution sources) Small Quantity Generators, between 100 kg and 1000 kg of hazardous waste/month (Resource Conservation and Recovery Act (tracking hazardous waste)) Business SIC classification: DRYCLEANING PLANTS, EXCEPT RUG CLEANING
EQUILON ENTERPRISES (9100 KIEFER BLVD in SACRAMENTO, CA) . Federal Facility
STATE MASTER (California - Hazardous Waste Tracking) - HAZARDOU WASTE PROGRAM Small Quantity Generators, between 100 kg and 1000 kg of hazardous waste/month (Resource Conservation and Recovery Act (tracking hazardous waste)) - notification Organizations: EQUILON ENTERPRISES, LLC (CONTACT/OWNER)
Alternative names: SHELL OIL CO
CALIF STATE AUTOMOTIVE ASSOCIATION (49 BICENTENNIAL CIRCLE in SACRAMENTO, CA)
STATE MASTER (California - Hazardous Waste Tracking) - HAZARDOU WASTE PROGRAM Small Quantity Generators, between 100 kg and 1000 kg of hazardous waste/month (Resource Conservation and Recovery Act (tracking hazardous waste)) - notification Organizations: C S A A (CONTACT/OWNER)
CA ARNG HEADQUARTERS (9800 GOETHE RD in SACRAMENTO, CA)
STATE MASTER (California - Hazardous Waste Tracking) - HAZARDOU WASTE PROGRAM Small Quantity Generators, between 100 kg and 1000 kg of hazardous waste/month (Resource Conservation and Recovery Act (tracking hazardous waste)) - notification Organizations: CA ARMY NATIONAL GUARD (CONTACT/OWNER)
CAL STATE COLLISION (7606 FOLSOM BLVD in SACRAMENTO, CA)
STATE MASTER (California - Hazardous Waste Tracking) - HAZARDOU WASTE PROGRAM Small Quantity Generators, between 100 kg and 1000 kg of hazardous waste/month (Resource Conservation and Recovery Act (tracking hazardous waste)) - notification Organizations: JOHN MAJKOVICA (CONTACT/OWNER)
CHEVRON STATION NO 93395 (8099 FOLSOM BLVD in SACRAMENTO, CA)
STATE MASTER (California - Hazardous Waste Tracking) - HAZARDOU WASTE PROGRAM Small Quantity Generators, between 100 kg and 1000 kg of hazardous waste/month (Resource Conservation and Recovery Act (tracking hazardous waste)) - notification Organizations: CHEVRON PRODUCTS CO (CONTACT/OWNER)
GRANITE CONSTRUCTION CO (5848 MAYHEW RD in SACRAMENTO, CA)
STATE MASTER (California - Hazardous Waste Tracking) - HAZARDOU WASTE PROGRAM Small Quantity Generators, between 100 kg and 1000 kg of hazardous waste/month (Resource Conservation and Recovery Act (tracking hazardous waste)) - notification Organizations: GRANITE SONSTRUCTION CO (CONTACT/OWNER)
ERLEWINE (O.W.) ELEMENTARY (2441 STANSBERRY WAY in SACRAMENTO, CA)
(National Center for Education Statistics) - STATE ID-6034177 Organizations: SACRAMENTO CITY UNIFIED (SCHOOL DISTRICT)
BANCROFT (HUBERT H.) ELEMENTARY (2929 BELMAR ST. in SACRAMENTO, CA)
(National Center for Education Statistics) - STATE ID-6034011 Organizations: SACRAMENTO CITY UNIFIED (SCHOOL DISTRICT)
JEFFERSON (THOMAS) ELEMENTARY (2635 CHESTNUT HILL DR. in SACRAMENTO, CA)
(National Center for Education Statistics) - STATE ID-6034300 Organizations: SACRAMENTO CITY UNIFIED (SCHOOL DISTRICT)
GOLDEN EMPIRE ELEMENTARY (9045 CANBERRA DR. in SACRAMENTO, CA)
(National Center for Education Statistics) - STATE ID-6097083 Organizations: SACRAMENTO CITY UNIFIED (SCHOOL DISTRICT)
KIK (NORCAL), INC. (8600 23RD AVE STE B in SACRAMENTO, CA)
(Integrated Compliance Information System) - ICIS-09-1998-0155, FORMAL ENFORCEMENT ACTION COMPLIANCE ACTIVITY (Tracking inspections of insecticide, fungicide, and rodenticide, and toxic substances) Alternative names: KIK(NOCAL) INC
NAGAZYNA (MADELYN) H.S. (3001 RAMONA AVE. in SACRAMENTO, CA)
(National Center for Education Statistics) - STATE ID-3430055 Organizations: CALIFORNIA EDUCATION AUTHORITY (SCHOOL DISTRICT)
Housing units lacking complete plumbing facilities: 0.4% Housing units lacking complete kitchen facilities: 0.9%
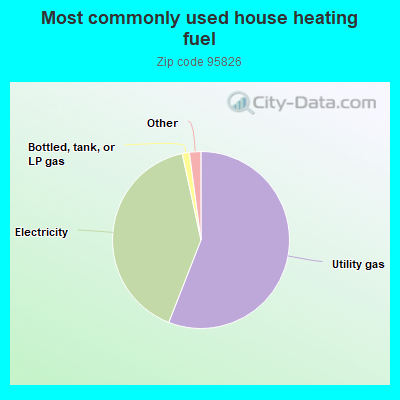
56.0%Utility gas
40.7%Electricity
1.3%Bottled, tank, or LP gas
0.7%No fuel used
0.7%Wood
0.6%Solar energy
Population in 1990: 38,107. Population change in the 1990s: +692 (+1.8%).
Place of birth for U.S.-born residents:
This state: 26,811
Northeast: 1,203
Midwest: 1,613
South: 1,978
West: 1,515
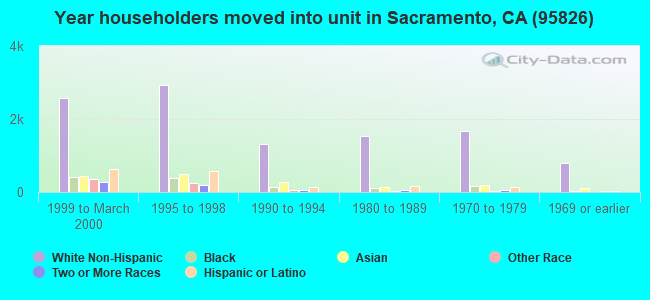
48% of the 95826 zip code residents lived in the same house 5 years ago. Out of people who lived in different houses, 62% lived in this county. Out of people who lived in different counties, 50% lived in California.
83% of the 95826 zip code residents lived in the same house 1 year ago. Out of people who lived in different houses, 62% moved from this county. Out of people who lived in different houses, 26% moved from different county within same state. Out of people who lived in different houses, 4% moved from different state. Out of people who lived in different houses, 4% moved from abroad.
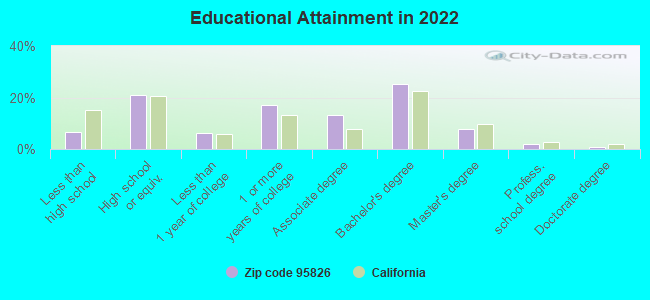
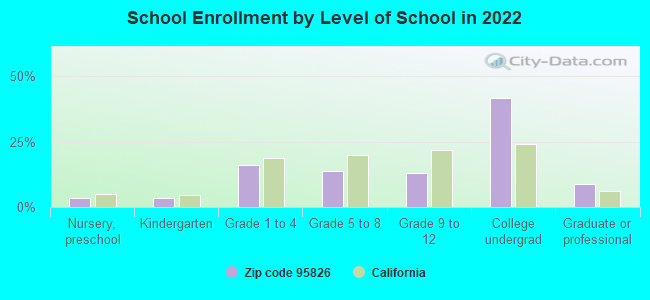
Private vs. public school enrollment:
Students in private schools in grades 1 to 8 (elementary and middle school): 223
Here:
7.0%
California:
10.5%
Students in private schools in grades 9 to 12 (high school): 179
Here:
12.7%
California:
8.5%
Students in private undergraduate colleges: 260
Here:
5.8%
California:
15.9%
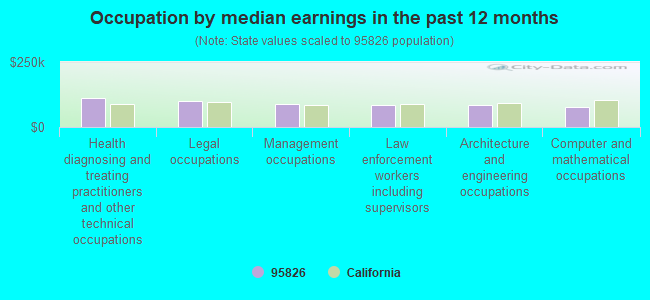
Occupation by median earnings in the past 12 months ($)
112,320Health diagnosing and treating practitioners and other technical occupations
100,712Legal occupations
87,540Management occupations
84,868Law enforcement workers including supervisors
83,678Architecture and engineering occupations
77,319Computer and mathematical occupations
Companies with biggest federal contracts located in this zip code (SACRAMENTO, CA):
GEO-CON, INC (7801 FOLSOM BOULEVARD SUIT) : $24,655,213 in 41 contractsfrom 2000 to 2001
Contracts for Maintenance, Repair or Alteration of Real Property -- Other Non-Building Facilities, Construction of Structures and Facilities -- Other Non-Building Facilities by U.S. Army Corps of Engineers - civil program financing only, Army Signed by year:2000: $11,241,968; 2001: $13,413,245; 2002: $0; 2003: $0; 2004: $0; 2005: $0; 2006: $0.
Biggest contracts:
$3,371,811 with U.S. Army Corps of Engineers - civil program financing only for Maintenance, Repair or Alteration of Real Property -- Other Non-Building Facilities. Signed on 2000-12-28. Completion date: 2000-12-11.
$3,161,600, same as above.Signed on 2001-10-03. Completion date: 2002-02-01.
$3,000,000, same as above.Signed on 2000-03-07. Completion date: 2000-12-31.
$2,864,317, same as above.Signed on 2001-06-28. Completion date: 2002-02-01.
DOLVER COMPANY, INC (8008 CARLTON RD; small business) : $5,982,755 in 44 contractsfrom 1999 to 2006
Contracts for Other Housekeeping Services, Environmental Studies and Assessments, Patent and Trademark Services, Maintenance, Repair and Rebuilding of Equipment -- Instruments and Laboratory Equipment, and moreby Air Force Signed by year:2000: -$264,546; 2001: $412,400; 2002: $313,000; 2003: $700,000; 2004: $825,401; 2005: $0; 2006: $109,000.
Biggest contracts:
$1,760,000 with Air Force for Other Housekeeping Services. Signed on 1999-12-20. Completion date: 2000-09-30.
$796,000, same as above.Signed on 1999-12-20. Completion date: 2000-12-31.
$520,000, same as above.Signed on 1999-12-09. Completion date: 2000-12-31.
$331,500, same as above.Signed on 1999-12-15. Completion date: 2000-12-31.
JOHNSON CONTROLS WORLD SERVICE (8350 FRUITRIDGE RD) : $3,003,055 in 9 contractsfrom 1999 to 2001
Contracts for Audio/Visual Services, General Photographic Services - Still, Miscellaneous Alarm, Signal and Security Detection Systems by Department of Defense, ENERGY, Department of Signed by year:2000: $1,525,928; 2001: $50,000; 2002: $0; 2003: $0; 2004: $0; 2005: $0; 2006: $0.
Biggest contracts:
$752,106 with Department of Defense for Audio/Visual Services. Signed on 2000-01-19. Completion date: 2000-09-30.
$714,743 with Department of Defense for General Photographic Services - Still. Signed on 1999-12-01. Completion date: 2000-09-30.
$459,662, same as above.Signed on 1999-11-01. Completion date: 1996-09-30.
$433,753 with Department of Defense for Audio/Visual Services. Signed on 2000-02-14. Completion date: 2000-09-30.
GOLDEN STATE FLOW MEASUREMENT (8155 BELVEDERE AVE #100; small business) : $1,248,256 in 4 contractsfrom 2004 to 2005
$406,593 with Army for Miscellaneous Items. Signed on 2005-09-26. Completion date: 2005-11-30.
$406,593 with U.S. Army Corps of Engineers - civil program financing only for Miscellaneous Items. Signed on 2005-09-26. Completion date: 2005-11-30.
$217,535 with Army for Waste Disposal Equipment. Signed on 2004-09-27. Completion date: 2004-11-30.
$217,535 with U.S. Army Corps of Engineers - civil program financing only for Waste Disposal Equipment. Signed on 2004-09-27. Completion date: 2004-11-30.
DAMES & MOORE GROUP (8801 FOLSOM BOULEVARD, SUI) : $853,238 in 8 contractsfrom 2000 to 2001
Contracts for Architect - Engineer Services (including landscaping, interior layout, and designing) by U.S. Army Corps of Engineers - civil program financing only Signed by year:2000: $270,436; 2001: $582,802; 2002: $0; 2003: $0; 2004: $0; 2005: $0; 2006: $0.
Biggest contracts:
$308,545 with U.S. Army Corps of Engineers - civil program financing only for Architect - Engineer Services (including landscaping, interior layout, and designing). Taking place in AZ. Signed on 2001-05-09. Completion date: 2001-08-09.
$274,257 with U.S. Army Corps of Engineers - civil program financing only for Architect - Engineer Services (including landscaping, interior layout, and designing). Signed on 2001-06-21. Completion date: 2001-08-09.
$133,844, same as above.Signed on 2000-04-27. Completion date: 2000-08-31.
$63,664, same as above.Signed on 2000-06-22. Completion date: 2000-11-30.
USA MICROCRAFT, INC (8220-C BELVEDERE AVE; small business)
$214,730 with Air Force for Electrical and Electronic Properties Measuring and Testing Instruments. Signed on 2003-02-05. Completion date: 2003-03-10.
RAUMBAU (5400WAREHOUSE WAY SUITE B; small business) : $171,423 in 7 contractsfrom 2000 to 2004
Contracts for Signs, Advertising Displays, and Identification Plates, Operation Training Devices, Other Professional Services, Other Non-Building Structures by U.S. Army Corps of Engineers - civil program financing only, Army Signed by year:2000: $132,783; 2001: $0; 2002: $0; 2003: $0; 2004: $38,640; 2005: $0; 2006: $0.
Biggest contracts:
$70,000 with U.S. Army Corps of Engineers - civil program financing only for Signs, Advertising Displays, and Identification Plates. Taking place in NC. Signed on 2000-09-28. Completion date: 2000-11-01.
$62,783 with U.S. Army Corps of Engineers - civil program financing only for Operation Training Devices. Signed on 2000-02-11. Completion date: 2000-04-14.
$39,000 with Army for Other Professional Services. Taking place in CO. Signed on 2004-04-15. Completion date: 2004-07-12.
$0 with Army for Other Non-Building Structures. Taking place in NC. Signed on 2004-09-08. Completion date: 2003-01-10.
EDWARD R BACON CO INC (5200 FLORIN PERKINS RD; small business) : $146,433 in 3 contractsfrom 2004 to 2005
$122,598 with Navy for Trailers. Signed on 2005-09-09. Completion date: 2005-11-18.
$22,700 with National Park Service for Miscellaneous Service and Trade Equipment. Signed on 2004-08-23. Completion date: 2005-01-31.
$1,135, same as above.Signed on 2004-09-17. Completion date: 2005-02-28.
SAFETYWEB TECHNOLOGY (8440 BELVEDERE AVE SUITE; small business) : $43,429 in 2 contractsfrom 2001 to 2002
$172,066 with Navy for Blocks, Tackle, Rigging, and Slings. Signed on 2001-07-30. Completion date: 2001-09-24.
-$128,637, same as above.Signed on 2002-06-27. Completion date: 2001-09-24.
APPARATUS UNLIMITED (8516 FRUITRUDGE ROAD; small business)
$29,180 with Air Force for Maintenance, Repair and Rebuilding of Equipment -- Communication, Detection, and Coherent Radiation Equipment. Signed on 1999-12-14. Completion date: 2000-01-15.
Top industries in this zip code by the number of employees in 2005:
2005 - 2018 National Fire Incident Reporting System (NFIRS) incidents
Based on the data from the years 2005 - 2018 the average number of fire incidents per year is 129. The highest number of fires - 183 took place in 2018, and the least - 55 in 2005. The data has a growing trend.
When looking into fire subcategories, the most reports belonged to: Outside Fires (53.8%), and Structure Fires (21.8%).
Fire incident types reported to NFIRS in Zip Code 95826


 Nearest zip codes: 95864, 95827, 95825, 95828, 95820, 95819.
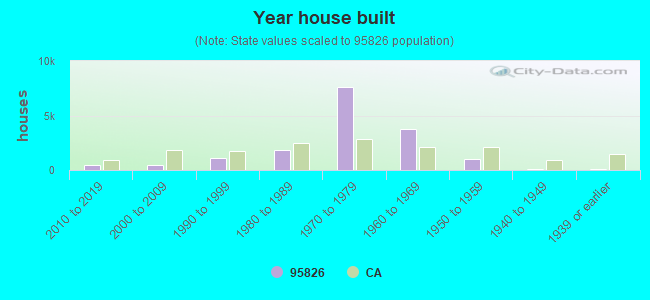


 Based on the data from the years 2005 - 2018 the average number of fire incidents per year is 129. The highest number of fires - 183 took place in 2018, and the least - 55 in 2005. The data has a growing trend.
 When looking into fire subcategories, the most reports belonged to: Outside Fires (53.8%), and Structure Fires (21.8%).