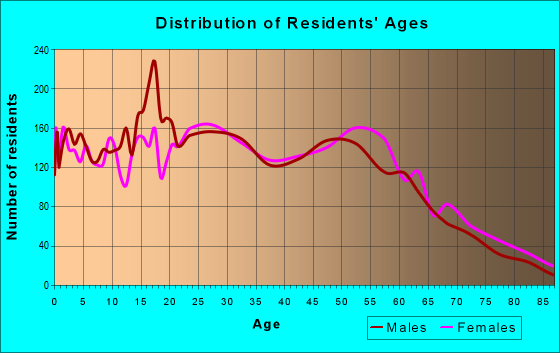
Estimated zip code population in 2022: 20,908 Zip code population in 2010: 20,269 Zip code population in 2000: 19,599
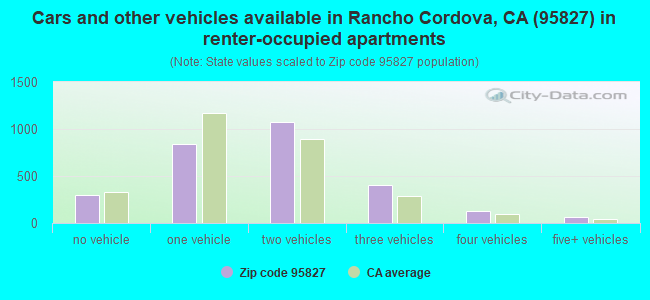
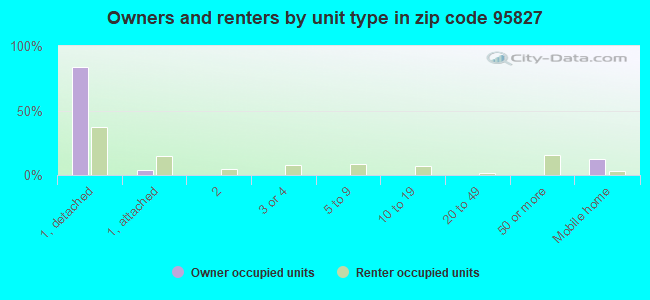
Houses and condos: 7,957 Renter-occupied apartments: 2,829
% of renters here:
37%
State:
44%
March 2022 cost of living index in zip code 95827: 100.9 (near average, U.S. average is 100)
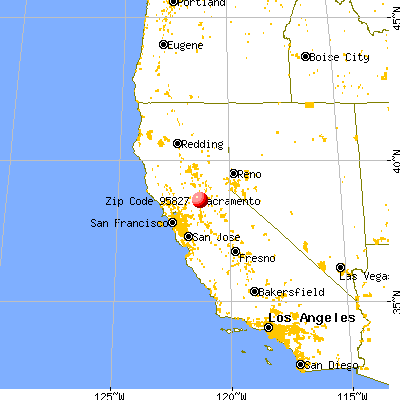
Land area: 7.6 sq. mi. Water area: 0.3 sq. mi.
Population density: 2,747 people per square mile
(average).
OSM Map
General Map
Google Map
MSN Map
OSM Map
General Map
Google Map
MSN Map
OSM Map
General Map
Google Map
MSN Map
OSM Map
General Map
Google Map
MSN Map
Please wait while loading the map...
Real estate property taxes paid for housing units in 2022:
This zip code:
0.6% ($2,587)
California:
0.7% ($4,831)
Median real estate property taxes paid for housing units with mortgages in 2022: $2,946 (0.7%) Median real estate property taxes paid for housing units with no mortgage in 2022: $1,449 (0.4%)
Averages for the 2020 tax year for zip code 95827, filed in 2021:
Average Adjusted Gross Income (AGI) in 2020: $55,268 (Individual Income Tax Returns)
Here:
$55,268
State:
$95,910
Salary/wage: $48,690 (reported on 81.6% of returns)
Here:
$48,690
State:
$77,331
(% of AGI for various income ranges: 1187.2% for AGIs below $25k, 3905.6% for AGIs $25k-50k, 7291.9% for AGIs $50k-75k, 10124.0% for AGIs $75k-100k, 18928.3% for AGIs $100k-200k, 47500.0% for AGIs over 200k)
Taxable interest for individuals: $930 (reported on 30.4% of returns)
This zip code:
$930
California:
$2,294
(% of AGI for various income ranges: 7.6% for AGIs below $25k, 7.8% for AGIs $25k-50k, 22.2% for AGIs $50k-75k, 42.5% for AGIs $75k-100k, 99.7% for AGIs $100k-200k, 2944.0% for AGIs over 200k)
Ordinary dividends: $3,135 (reported on 10.7% of returns)
Here:
$3,135
State:
$10,949
(% of AGI for various income ranges: 11.6% for AGIs below $25k, 17.0% for AGIs $25k-50k, 33.1% for AGIs $50k-75k, 57.2% for AGIs $75k-100k, 190.3% for AGIs $100k-200k, 1784.0% for AGIs over 200k)
Net capital gain/loss in AGI: +$9,819 (reported on 10.8% of returns)
Here:
+$9,819
State:
+$49,306
(% of AGI for various income ranges: 1.7% for AGIs below $25k, 27.0% for AGIs $25k-50k, 40.1% for AGIs $50k-75k, 98.4% for AGIs $75k-100k, 432.6% for AGIs $100k-200k, 13444.0% for AGIs over 200k)
Profit/loss from business: +$10,645 (reported on 16.2% of returns)
Here:
+$10,645
State:
+$15,671
(% of AGI for various income ranges: 125.2% for AGIs below $25k, 184.3% for AGIs $25k-50k, 214.9% for AGIs $50k-75k, 354.1% for AGIs $75k-100k, 651.2% for AGIs $100k-200k, 4266.0% for AGIs over 200k)
Taxable individual retirement arrangement distribution: $14,646 (reported on 5.0% of returns)
95827:
$14,646
California:
$23,505
(% of AGI for various income ranges: 33.0% for AGIs below $25k, 41.9% for AGIs $25k-50k, 88.9% for AGIs $50k-75k, 159.9% for AGIs $75k-100k, 364.6% for AGIs $100k-200k, 3148.0% for AGIs over 200k)
Total itemized deductions: $27,018 (reported on 9.3% of returns)
Here:
$27,018
State:
$39,517
(% of AGI for various income ranges: 59.7% for AGIs below $25k, 108.5% for AGIs $25k-50k, 401.2% for AGIs $50k-75k, 697.9% for AGIs $75k-100k, 1346.3% for AGIs $100k-200k, 8700.0% for AGIs over 200k)
Charity contributions: $6,900 (reported on 7.0% of returns)
Here:
$6,900
State:
$12,598
(% of AGI for various income ranges: 3.5% for AGIs below $25k, 12.4% for AGIs $25k-50k, 59.6% for AGIs $50k-75k, 97.2% for AGIs $75k-100k, 278.8% for AGIs $100k-200k, 3088.0% for AGIs over 200k)
Taxes paid: $7,346 (reported on 9.2% of returns)
95827:
$7,346
State:
$8,807
(% of AGI for various income ranges: 6.7% for AGIs below $25k, 22.7% for AGIs $25k-50k, 115.3% for AGIs $50k-75k, 231.2% for AGIs $75k-100k, 440.0% for AGIs $100k-200k, 1262.0% for AGIs over 200k)
Earned income credit: $2,050 (reported on 16.6% of returns)
Here:
$2,050
State:
$2,074
(% of AGI for various income ranges: 86.3% for AGIs below $25k, 76.0% for AGIs $25k-50k, 1.4% for AGIs $50k-75k)
Percentage of individuals using paid preparers for their 2020 taxes: 92.2%
Here:
92%
State:
92%
(% for various income ranges: 91.7% for AGIs below $25k, 92.4% for AGIs $25k-50k, 91.6% for AGIs $50k-75k, 93.3% for AGIs $75k-100k, 92.1% for AGIs $100k-200k, 100.0% for AGIs over 200k)
Averages for the 2012 tax year for zip code 95827, filed in 2013:
Average Adjusted Gross Income (AGI) in 2012: $45,506 (Individual Income Tax Returns)
Here:
$45,506
State:
$72,726
Salary/wage: $40,191 (reported on 82.7% of returns)
Here:
$40,191
State:
$59,079
(% of AGI for various income ranges: 71.1% for AGIs below $25k, 80.9% for AGIs $25k-50k, 78.5% for AGIs $50k-75k, 72.9% for AGIs $75k-100k, 75.4% for AGIs $100k-200k, 33.2% for AGIs over 200k)
Taxable interest for individuals: $685 (reported on 31.8% of returns)
This zip code:
$685
California:
$2,146
(% of AGI for various income ranges: 0.4% for AGIs below $25k, 0.2% for AGIs $25k-50k, 0.4% for AGIs $50k-75k, 0.5% for AGIs $75k-100k, 0.4% for AGIs $100k-200k, 1.6% for AGIs over 200k)
Ordinary dividends: $3,158 (reported on 11.5% of returns)
Here:
$3,158
State:
$9,308
(% of AGI for various income ranges: 0.5% for AGIs below $25k, 0.4% for AGIs $25k-50k, 0.4% for AGIs $50k-75k, 0.8% for AGIs $75k-100k, 0.8% for AGIs $100k-200k, 3.3% for AGIs over 200k)
Net capital gain/loss in AGI: +$6,545 (reported on 7.7% of returns)
Here:
+$6,545
State:
+$30,460
(% of AGI for various income ranges: 1.0% for AGIs below $25k, 0.5% for AGIs $75k-100k, 0.5% for AGIs $100k-200k, 11.5% for AGIs over 200k)
Profit/loss from business: +$9,735 (reported on 15.1% of returns)
Here:
+$9,735
State:
+$17,064
(% of AGI for various income ranges: 10.8% for AGIs below $25k, 2.5% for AGIs $25k-50k, 1.7% for AGIs $50k-75k, 2.2% for AGIs $75k-100k, 3.9% for AGIs $100k-200k)
Taxable individual retirement arrangement distribution: $12,295 (reported on 6.3% of returns)
95827:
$12,295
California:
$19,557
(% of AGI for various income ranges: 1.4% for AGIs below $25k, 1.0% for AGIs $25k-50k, 1.4% for AGIs $50k-75k, 1.7% for AGIs $75k-100k, 3.7% for AGIs $100k-200k)
Self-employment retirement plans: $12,000 (reported on 0.2% of returns)
95827:
$12,000
California:
$24,530
Total itemized deductions: $20,962 (25% of AGI, reported on 28.4% of returns)
Here:
$20,962
State:
$34,004
Here:
25.3% of AGI
State:
22.7% of AGI
(% of AGI for various income ranges: 7.4% for AGIs below $25k, 9.2% for AGIs $25k-50k, 13.4% for AGIs $50k-75k, 14.6% for AGIs $75k-100k, 16.4% for AGIs $100k-200k, 20.7% for AGIs over 200k)
Charity contributions: $3,124 (reported on 22.7% of returns)
Here:
$3,124
State:
$4,659
(% of AGI for various income ranges: 0.4% for AGIs below $25k, 1.0% for AGIs $25k-50k, 1.5% for AGIs $50k-75k, 1.8% for AGIs $75k-100k, 2.2% for AGIs $100k-200k, 2.7% for AGIs over 200k)
Taxes paid: $6,807 (reported on 28.2% of returns)
95827:
$6,807
State:
$14,448
(% of AGI for various income ranges: 1.2% for AGIs below $25k, 1.8% for AGIs $25k-50k, 3.5% for AGIs $50k-75k, 4.5% for AGIs $75k-100k, 6.3% for AGIs $100k-200k, 11.7% for AGIs over 200k)
Earned income credit: $2,293 (reported on 22.8% of returns)
Here:
$2,293
State:
$2,286
(% of AGI for various income ranges: 7.9% for AGIs below $25k, 1.3% for AGIs $25k-50k)
Percentage of individuals using paid preparers for their 2012 taxes: 49.6%
Here:
50%
State:
64%
(% for various income ranges: 50.0% for AGIs below $25k, 47.0% for AGIs $25k-50k, 50.0% for AGIs $50k-75k, 49.3% for AGIs $75k-100k, 54.5% for AGIs $100k-200k, 85.7% for AGIs over 200k)
Averages for the 2004 tax year for zip code 95827, filed in 2005:
Average Adjusted Gross Income (AGI) in 2004: $44,407 (Individual Income Tax Returns)
Here:
$44,407
State:
$58,600
Salary/wage: $36,995 (reported on 86.6% of returns)
Here:
$36,995
State:
$49,455
(% of AGI for various income ranges: 136.4% for AGIs below $10k, 79.4% for AGIs $10k-25k, 85.4% for AGIs $25k-50k, 84.4% for AGIs $50k-75k, 83.9% for AGIs $75k-100k, 39.6% for AGIs over 100k)
Taxable interest for individuals: $817 (reported on 40.8% of returns)
This zip code:
$817
California:
$2,365
(% of AGI for various income ranges: 2.3% for AGIs below $10k, 0.8% for AGIs $10k-25k, 0.6% for AGIs $25k-50k, 0.7% for AGIs $50k-75k, 0.8% for AGIs $75k-100k, 0.8% for AGIs over 100k)
Taxable dividends: $1,726 (reported on 14.8% of returns)
Here:
$1,726
State:
$4,746
(% of AGI for various income ranges: 1.9% for AGIs below $10k, 0.4% for AGIs $10k-25k, 0.3% for AGIs $25k-50k, 0.5% for AGIs $50k-75k, 0.4% for AGIs $75k-100k, 1.0% for AGIs over 100k)
Net capital gain/loss: +$8,045 (reported on 11.5% of returns)
Here:
+$8,045
State:
+$23,418
(% of AGI for various income ranges: -1.8% for AGIs below $10k, 0.2% for AGIs $10k-25k, 0.2% for AGIs $25k-50k, 0.5% for AGIs $50k-75k, 0.8% for AGIs $75k-100k, 6.5% for AGIs over 100k)
Profit/loss from business: +$9,671 (reported on 14.0% of returns)
Here:
+$9,671
State:
+$16,826
(% of AGI for various income ranges: 7.9% for AGIs below $10k, 6.3% for AGIs $10k-25k, 2.3% for AGIs $25k-50k, 1.5% for AGIs $50k-75k, 2.4% for AGIs $75k-100k, 3.9% for AGIs over 100k)
IRA payment deduction: $2,568 (reported on 1.9% of returns)
95827:
$2,568
California:
$3,192
(% of AGI for various income ranges: 0.4% for AGIs below $10k, 0.2% for AGIs $10k-25k, 0.1% for AGIs $25k-50k, 0.1% for AGIs $50k-75k, 0.2% for AGIs $75k-100k)
Self-employed pension: $10,204 (reported on 0.5% of returns)
Here:
$10,204
California:
$17,688
(% of AGI for various income ranges: 0.1% for AGIs $10k-25k, 0.2% for AGIs $50k-75k, 0.3% for AGIs over 100k)
Total itemized deductions: $19,269 (24% of AGI, reported on 34.7% of returns)
Here:
$19,269
State:
$28,113
Here:
24.2% of AGI
State:
25.3% of AGI
(% of AGI for various income ranges: 16.1% for AGIs below $10k, 9.3% for AGIs $10k-25k, 13.6% for AGIs $25k-50k, 18.2% for AGIs $50k-75k, 18.9% for AGIs $75k-100k, 14.2% for AGIs over 100k)
Charity contributions deductions: $2,571 (3% of AGI, reported on 30.0% of returns)
Here:
$2,571
State:
$3,923
Here:
3.2% of AGI
State:
3.3% of AGI
(% of AGI for various income ranges: 0.9% for AGIs below $10k, 0.8% for AGIs $10k-25k, 1.5% for AGIs $25k-50k, 2.0% for AGIs $50k-75k, 2.3% for AGIs $75k-100k, 1.9% for AGIs over 100k)
Total tax: $6,442 (reported on 76.4% of returns)
95827:
$6,442
State:
$10,761
(% of AGI for various income ranges: 3.9% for AGIs below $10k, 4.2% for AGIs $10k-25k, 7.0% for AGIs $25k-50k, 9.2% for AGIs $50k-75k, 10.6% for AGIs $75k-100k, 19.3% for AGIs over 100k)
Earned income credit: $1,689 (reported on 16.8% of returns)
Here:
$1,689
State:
$1,763
Percentage of individuals using paid preparers for their 2004 taxes: 52.8%
Here:
53%
State:
66%
(% for various income ranges: 48.9% for AGIs below $10k, 54.7% for AGIs $10k-25k, 52.1% for AGIs $25k-50k, 52.8% for AGIs $50k-75k, 52.8% for AGIs $75k-100k, 60.9% for AGIs over 100k)
Likely homosexual households (counted as self-reported same-sex unmarried-partner households)
Lesbian couples: 0.6% of all households
Gay men: 0.2% of all households
Household received Food Stamps/SNAP in the past 12 months: 893 Household did not receive Food Stamps/SNAP in the past 12 months: 6,666
Women who had a birth in the past 12 months: 147 (131 now married, 16 unmarried) Women who did not have a birth in the past 12 months: 5,484 (2,099 now married, 3,387 unmarried)
Housing units in zip code 95827 with a mortgage: 3,168 (188 second mortgage, 129 both second mortgage and home equity loan) Median monthly owner costs for units with a mortgage: $1,820 Median monthly owner costs for units without a mortgage: $613
Residents with income below the poverty level in 2022:
This zip code:
11.9%
Whole state:
12.2%
Residents with income below 50% of the poverty level in 2022:
This zip code:
5.3%
Whole state:
6.2%
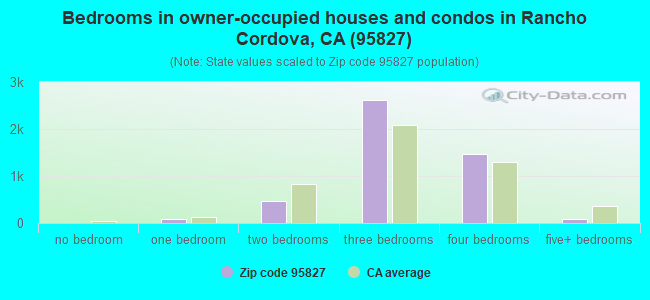
Median number of rooms in houses and condos:
Here:
5.8
State:
6.0
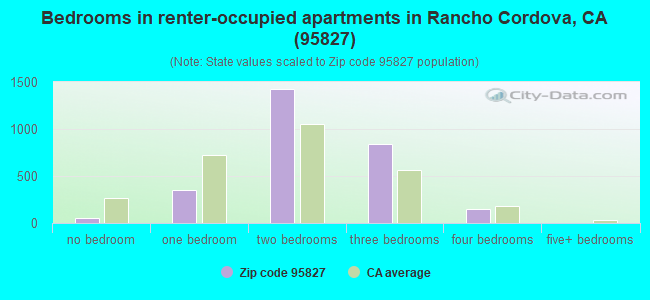
Median number of rooms in apartments:
Here:
4.3
State:
3.9
Notable locations in this zip code not listed on our city pages
Notable locations in zip code 95827: Sacramento 6 Drive-In (A), Safetyville USA (B), Sacramento County Animal Pound (C), B T Collins Juvenile Center (D), First Responder Emergency Medical Services (E), Sacramento County Office of Education (F), Rancho Cordova Community Library (G), Sacramento Metropolitan Fire District Station 62 (H), Rancho Cordova Police Station (I). Display/hide their locations on the map
Churches in zip code 95827 include: Cordova Church (A), Gedatsu Church of America (B), Grace Missionary Baptist Church (C), Mount Zion Church of God in Christ (D), Union Gospel Mission Womens Ministries (E), Greater Hill Zion Missionary Baptist Church (F). Display/hide their locations on the map
3,019 married couples with children.
998 single-parent households (369 men, 629 women).
65.3% of residents of 95827 zip code speak English at home.
14.6% of residents speak Spanish at home (61% very well, 16% well, 16% not well, 8% not at all).
12.5% of residents speak other Indo-European language at home (48% very well, 32% well, 16% not well, 4% not at all).
7.2% of residents speak Asian or Pacific Island language at home (39% very well, 22% well, 27% not well, 11% not at all).
0.4% of residents speak other language at home (94% very well, 6% not at all).
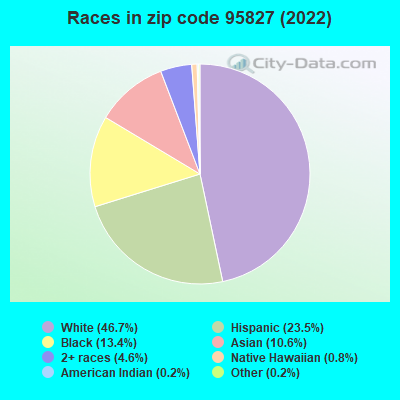
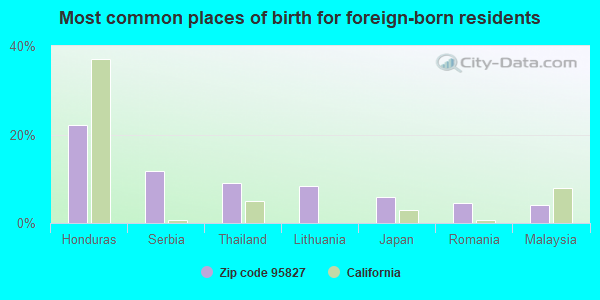
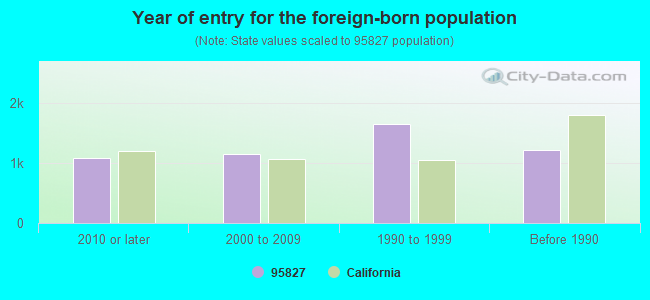
Foreign born population: 4,652 (22.3%) (64.4% of them are naturalized citizens)
Major facilities with environmental interests located in this zip code:
GOLDEN WEST HOMES INCORPORATED (9998 OLD PLACERVILLE ROAD in SACRAMENTO, CA)
STATE MASTER (California - Hazardous Waste Tracking) - HAZARDOU WASTE PROGRAM CRITERIA AND HAZARDOUS AIR POLLUTANT INVENTORY (Inventory of air pollution sources) (Resource Conservation and Recovery Act (tracking hazardous waste)) Business SIC classification: MOBILE HOMES Organizations: CORPORATION (CONTACT/OWNER)
FORMER PARATRANSIT INC (1931 30TH ST in SACRAMENTO, CA)
STATE MASTER (California - Hazardous Waste Tracking) - HAZARDOU WASTE PROGRAM HAZARDOUS WASTE BIENNIAL REPORTER (Resource Conservation and Recovery Act (tracking hazardous waste)) Large Quantity Generators, more that 1000 kg of hazardous waste/month (Resource Conservation and Recovery Act (tracking hazardous waste))
L AND D LANDFILL CO (8635 FRUITRIDGE ROAD in SACRAMENTO, CA)
STATE MASTER (California Solid Waste disposal sites tracking) - REFUSE DISPOSAL REFUSE DISPOSAL (Solid waste facilities tracking) Organizations: L AND D LANDFILL COMPANY (CONTACT/OPERATOR)
, FRUITRIDGE ROAD LAND COMPANY (CONTACT/OWNER)
A M WIN ELEMENTARY SCHOOL (3351 EXPLORER DR in SACRAMENTO, CA)
(Geographic Names Information System) (National Center for Education Statistics) - STATE ID-6033765 Organizations: SACRAMENTO CITY UNIFIED (SCHOOL DISTRICT)
Alternative names: WINN (A.M.) ELEMENTARY
LES SCHWAB (3606 BRADSHAW RD in SACRAMENTO, CA)
STATE MASTER (California - Hazardous Waste Tracking) - HAZARDOU WASTE PROGRAM Small Quantity Generators, between 100 kg and 1000 kg of hazardous waste/month (Resource Conservation and Recovery Act (tracking hazardous waste)) - notification Organizations: LES SCHWAB TIRE CNTRS OF CA (CONTACT/OWNER)
MAACO INC (1216 ARDEN WY in SACRAMENTO, CA)
STATE MASTER (California - Hazardous Waste Tracking) - HAZARDOU WASTE PROGRAM Small Quantity Generators, between 100 kg and 1000 kg of hazardous waste/month (Resource Conservation and Recovery Act (tracking hazardous waste)) - notification
CHEVRON STATION 90081 (3300 BRADSHAW RD in SACRAMENTO, CA)
STATE MASTER (California - Hazardous Waste Tracking) - HAZARDOU WASTE PROGRAM Small Quantity Generators, between 100 kg and 1000 kg of hazardous waste/month (Resource Conservation and Recovery Act (tracking hazardous waste)) - notification Organizations: CHEVRON PRODUCTS CO (CONTACT/OWNER)
LINCOLN (ABRAHAM) ELEMENTARY (3324 GLENMOOR DR. in SACRAMENTO, CA)
(National Center for Education Statistics) - STATE ID-6099808 Organizations: SACRAMENTO CITY UNIFIED (SCHOOL DISTRICT)
MARSHALL (JAMES) ELEMENTARY (9525 GOETHE ROAD in SACRAMENTO, CA)
(National Center for Education Statistics) - STATE ID-6096150 Organizations: SACRAMENTO CITY UNIFIED (SCHOOL DISTRICT)
FRANCHISE TAX BOARD (9645 BUTTERFIED WAY in SACRAMENTO, CA)
(Resource Conservation and Recovery Act (tracking hazardous waste)) Organizations: STATE OF CALIFORNIA (CONTACT/OWNER)
ANACOMP INC (9795 BUSINESS PARK DR STE A in SACRAMENTO, CA)
Small Quantity Generators, between 100 kg and 1000 kg of hazardous waste/month (Resource Conservation and Recovery Act (tracking hazardous waste)) - notification
ERTHCO ENVIRONMENTAL SVC (3774 BRADVIEW DR in SACRAMENTO, CA)
J L HALEY ENTERPRISES INC (3150 BRADSHAW RD in SACRAMENTO, CA)
Small Quantity Generators, between 100 kg and 1000 kg of hazardous waste/month (Resource Conservation and Recovery Act (tracking hazardous waste)) - notification
Housing units lacking complete plumbing facilities: 0.2% Housing units lacking complete kitchen facilities: 0.7%
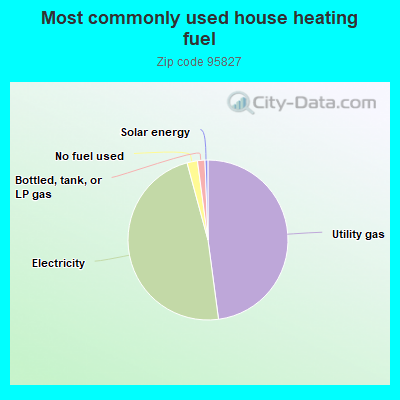
47.8%Utility gas
47.8%Electricity
2.1%No fuel used
1.5%Bottled, tank, or LP gas
0.6%Solar energy
Population in 1990: 19,471. Population change in the 1990s: +128 (+0.7%).
Place of birth for U.S.-born residents:
This state: 12,769
Northeast: 639
Midwest: 697
South: 1,035
West: 644
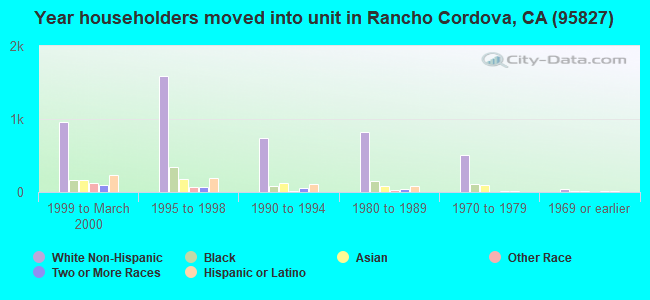
51% of the 95827 zip code residents lived in the same house 5 years ago. Out of people who lived in different houses, 71% lived in this county. Out of people who lived in different counties, 50% lived in California.
88% of the 95827 zip code residents lived in the same house 1 year ago. Out of people who lived in different houses, 62% moved from this county. Out of people who lived in different houses, 20% moved from different county within same state. Out of people who lived in different houses, 10% moved from different state. Out of people who lived in different houses, 6% moved from abroad.
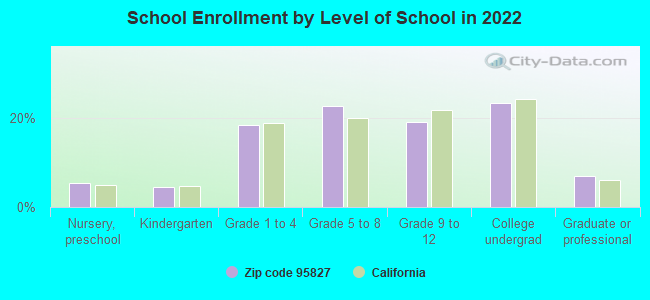
Private vs. public school enrollment:
Students in private schools in grades 1 to 8 (elementary and middle school): 317
Here:
13.8%
California:
10.5%
Students in private schools in grades 9 to 12 (high school): 160
Here:
15.1%
California:
8.5%
Students in private undergraduate colleges: 84
Here:
6.5%
California:
15.9%
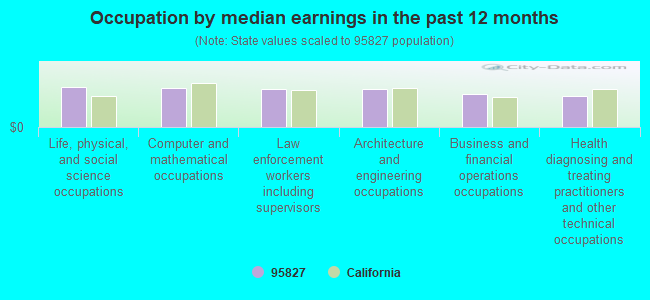
Occupation by median earnings in the past 12 months ($)
95,009Life, physical, and social science occupations
92,890Computer and mathematical occupations
89,625Law enforcement workers including supervisors
89,410Architecture and engineering occupations
77,530Business and financial operations occupations
72,505Health diagnosing and treating practitioners and other technical occupations
Companies with federal contracts located in this zip code (SACRAMENTO, CA):
SACRAMENTO COUNTY (9660 ECOLOGY LANE, TRAILER) : $6,859,636 in 14 contractsfrom 2000 to 2006
Contracts for Rescue Vessels, Other Utilities, Water Services by U.S. Coast Guard, Army, Department of Veterans Affairs Signed by year:2000: $240,000; 2001: $197,055; 2002: $135,000; 2003: $149,020; 2004: $1,823,763; 2005: $4,152,654; 2006: $162,144.
Biggest contracts:
$4,005,246 with U.S. Coast Guard for Rescue Vessels. Signed on 2005-10-01. Completion date: 2005-01-19.
$1,689,759, same as above.Signed on 2004-11-29. Effective on 2004-12-01. Completion date: 2005-09-30.
$162,144 with Army for Other Utilities. Signed on 2006-03-08. Completion date: 2006-04-30.
$147,408, same as above.Signed on 2005-06-16. Completion date: 2006-04-30.
KLEINFELDER, INC (3077 FITE CIRCLE) : $1,442,158 in 16 contractsfrom 2001 to 2002
Contracts for Architect - Engineer Services (including landscaping, interior layout, and designing) by U.S. Army Corps of Engineers - civil program financing only Signed by year:2000: $0; 2001: $1,130,648; 2002: $311,510; 2003: $0; 2004: $0; 2005: $0; 2006: $0.
Biggest contracts:
$789,747 with U.S. Army Corps of Engineers - civil program financing only for Architect - Engineer Services (including landscaping, interior layout, and designing). Signed on 2001-07-09. Completion date: 2002-05-01.
$166,869, same as above.Signed on 2002-07-03. Completion date: 2002-05-13.
$146,197, same as above.Signed on 2001-05-10. Completion date: 2001-11-09.
$134,554, same as above.Signed on 2002-03-26. Completion date: 2002-05-13.
PATEL VIJAY D (3343 BRADSHAW RD; small business) : $418,676 in 7 contractsfrom 1999 to 2000
Contracts for Lodging - Hotel/Motel by Army Signed by year:2000: $77,076; 2001: $0; 2002: $0; 2003: $0; 2004: $0; 2005: $0; 2006: $0.
Biggest contracts:
$170,800 with Army for Lodging - Hotel/Motel. Signed on 1999-10-26. Completion date: 1999-12-31.
$170,800, same as above.Signed on 2000-03-29. Completion date: 2000-06-30.
$170,800, same as above.Signed on 1999-12-31. Completion date: 2000-03-31.
$31,785, same as above.Signed on 2000-07-12. Completion date: 2000-07-21.
PETERS SHORTHAND REPORTING COR (3336 BRADSHAW RD STE 240; small business) : $294,779 in 7 contractsfrom 2000 to 2006
Contracts for Court Reporting Services, Legal Services by Offices, Boards and Divisions (includes Attorney General, Deputy Attorney General, etc.), Army Signed by year:2000: $5,000; 2001: $143,000; 2002: $0; 2003: $141,866; 2004: $0; 2005: $0; 2006: $4,913.
Biggest contracts:
$141,866 with Offices, Boards and Divisions (includes Attorney General, Deputy Attorney General, etc.) for Court Reporting Services. Signed on 2003-10-01. Completion date: 2004-09-30.
$77,000, same as above.Signed on 2001-04-15. Completion date: 2001-09-15.
$75,000, same as above.Signed on 2001-10-15. Completion date: 2005-09-15.
$5,000, same as above.Signed on 2000-07-15. Completion date: 2001-09-15.
DEPARTMENT OF MILITARY CALIFOR (9800 GOETHE RD; small business) : $229,965 in 11 contractsfrom 2002 to 2005
Contracts for Food Services, Passenger Motor Charter Service, Facilities Operations Support Services, Construction of Structures and Facilities -- Recreation Facilities (Non-Building) by Army Signed by year:2000: $0; 2001: $0; 2002: $44,331; 2003: $42,240; 2004: $67,924; 2005: $75,470; 2006: $0.
Biggest contracts:
$45,540 with Army for Food Services. Signed on 2005-02-08. Completion date: 2005-03-26.
$44,418, same as above.Signed on 2004-04-01. Completion date: 2004-04-19.
$24,090, same as above.Signed on 2005-02-09. Completion date: 2005-06-25.
$23,506, same as above.Signed on 2004-07-26. Completion date: 2004-08-15.
THYSSEN ELEVATOR CO (840 EMBARCADERO DR STE 30; small business) : $74,000 in 2 contractsfrom 2000 to 2001
$41,000 with Department of Veterans Affairs for Maintenance, Repair and Rebuilding of Equipment -- Miscellaneous. Signed on 2000-04-15. Completion date: 2000-09-15.
$33,000 with Bureau of Reclamation for Maintenance, Repair and Rebuilding of Equipment -- Materials Handling Equipment. Signed on 2001-03-15. Completion date: 2001-06-15.
VALLEY RUBBER & GASKET CO , IN (10182 CROYDON WAY; small business) : $25,334 in 2 contractsfrom 2004 to 2005
$14,606 with Navy for Hose and Flexible Tubing. Signed on 2005-08-04. Completion date: 2005-09-16.
$10,728 with Navy for Packing and Gasket Materials. Signed on 2004-12-15. Completion date: 2005-01-10.
INNOVATIVE BUSINESS SYSTEMS IN (9901 HORN RD STE C; small business) : $23,751 in 4 contractsfrom 2003 to 2006
$17,450 with Department of Defense for Miscellaneous Items. Signed on 2003-03-10. Completion date: 2003-05-05.
$5,550 with Army for Cabinets, Lockers, Bins, and Shelving. Signed on 2006-04-18. Completion date: 2006-04-21.
$695 with Bureau of Reclamation for Maintenance, Repair and Rebuilding of Equipment -- Office Machines, Text Processing Systems and Visible Record Equipment. Signed on 2004-08-18. Completion date: 2005-08-31.
$56 with Department of Defense for Miscellaneous Items. Signed on 2003-03-10. Completion date: 2003-05-05.
PROBERTS TROPHIES & AWARDS CUS (10392 ROCKINGHAM DR; small business)
$4,651 with Air Force for Signs, Advertising Displays, and Identification Plates. Signed on 2005-02-15. Completion date: 2005-03-03.
IMBSEN & ASSOCIATES, INC (9912 BUSINESS PARK DRIVE)
$2,600 with U.S. Army Corps of Engineers - civil program financing only for ADP Software. Signed on 2001-08-23. Completion date: 2001-08-31.
Top industries in this zip code by the number of employees in 2005:
Information: Cellular and Other Wireless Telecommunications (over 1000 employees: 1 establishment, 10-19 employees: 1 establishment, 1-4 employees: 2 establishments)
2005 - 2018 National Fire Incident Reporting System (NFIRS) incidents
Based on the data from the years 2005 - 2018 the average number of fire incidents per year is 41. The highest number of fires - 58 took place in 2017, and the least - 18 in 2007. The data has a growing trend.
When looking into fire subcategories, the most reports belonged to: Outside Fires (45.8%), and Structure Fires (27.9%).
Fire incident types reported to NFIRS in Zip Code 95827


 Nearest zip codes: 95655, 95826, 95864, 95670, 95829, 95608.
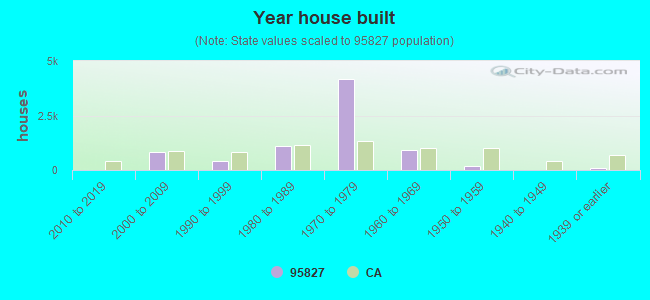


 Based on the data from the years 2005 - 2018 the average number of fire incidents per year is 41. The highest number of fires - 58 took place in 2017, and the least - 18 in 2007. The data has a growing trend.
 When looking into fire subcategories, the most reports belonged to: Outside Fires (45.8%), and Structure Fires (27.9%).