Estimated zip code population in 2022: 25,514 Zip code population in 2010: 22,447 Zip code population in 2000: 23,355
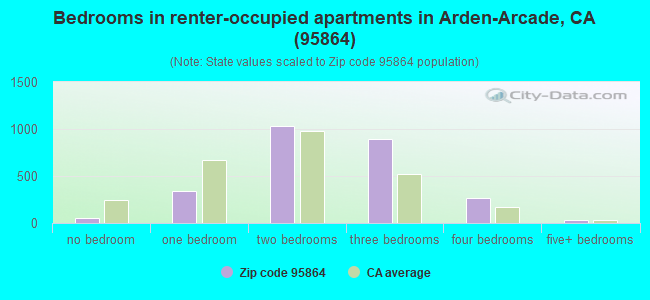
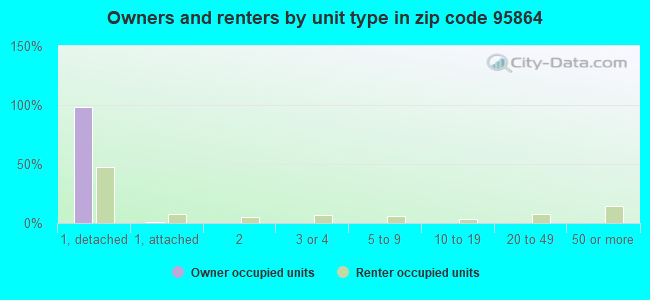
Houses and condos: 10,520 Renter-occupied apartments: 2,615
% of renters here:
26%
State:
44%
March 2022 cost of living index in zip code 95864: 102.3 (near average, U.S. average is 100)
Land area: 6.4 sq. mi. Water area: 0.1 sq. mi.
Population density: 3,977 people per square mile
(average).
OSM Map
General Map
Google Map
MSN Map
OSM Map
General Map
Google Map
MSN Map
OSM Map
General Map
Google Map
MSN Map
OSM Map
General Map
Google Map
MSN Map
Please wait while loading the map...
Real estate property taxes paid for housing units in 2022:
This zip code:
0.6% ($4,793)
California:
0.7% ($4,831)
Median real estate property taxes paid for housing units with mortgages in 2022: $5,008 (0.7%) Median real estate property taxes paid for housing units with no mortgage in 2022: $3,991 (0.5%)
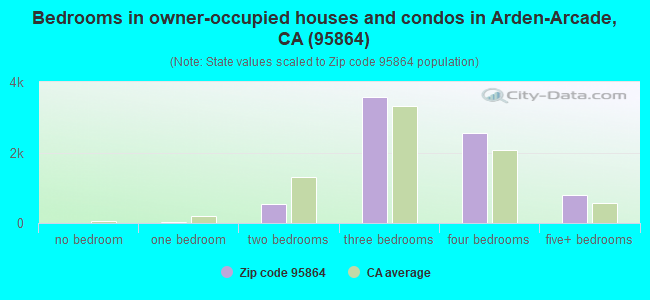
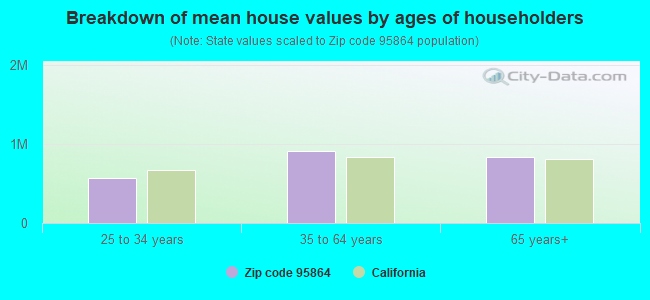
Estimated median house/condo value in 2022: $779,314
95864:
$779,314
California:
$715,900
According to our research of California and other state lists, there were 15 registered sex offenders living in 95864 zip code as of April 27, 2024. The ratio of all residents to sex offenders in zip code 95864 is 1,591 to 1. The ratio of registered sex offenders to all residents in this zip code is lower than the state average.
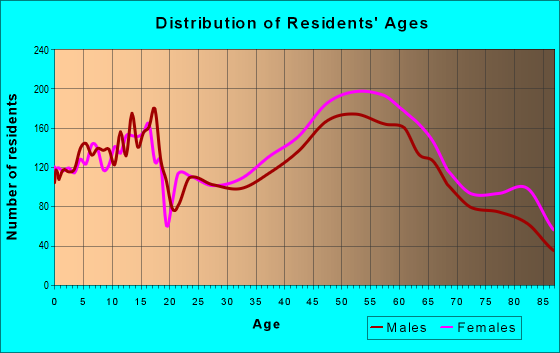
Median resident age:
This zip code:
44.5 years
California median age:
37.9 years
Average household size:
This zip code:
2.5 people
California:
2.8 people
Averages for the 2020 tax year for zip code 95864, filed in 2021:
Average Adjusted Gross Income (AGI) in 2020: $167,245 (Individual Income Tax Returns)
Here:
$167,245
State:
$95,910
Salary/wage: $114,445 (reported on 74.0% of returns)
Here:
$114,445
State:
$77,331
(% of AGI for various income ranges: 1232.4% for AGIs below $25k, 3737.4% for AGIs $25k-50k, 6675.0% for AGIs $50k-75k, 9613.4% for AGIs $75k-100k, 18477.3% for AGIs $100k-200k, 105849.3% for AGIs over 200k)
Taxable interest for individuals: $2,866 (reported on 55.0% of returns)
This zip code:
$2,866
California:
$2,294
(% of AGI for various income ranges: 21.5% for AGIs below $25k, 41.1% for AGIs $25k-50k, 79.8% for AGIs $50k-75k, 141.5% for AGIs $75k-100k, 314.4% for AGIs $100k-200k, 2203.6% for AGIs over 200k)
Ordinary dividends: $13,109 (reported on 36.5% of returns)
Here:
$13,109
State:
$10,949
(% of AGI for various income ranges: 61.9% for AGIs below $25k, 102.5% for AGIs $25k-50k, 190.6% for AGIs $50k-75k, 397.7% for AGIs $75k-100k, 912.8% for AGIs $100k-200k, 6959.3% for AGIs over 200k)
Net capital gain/loss in AGI: +$53,026 (reported on 34.5% of returns)
Here:
+$53,026
State:
+$49,306
(% of AGI for various income ranges: 33.5% for AGIs below $25k, 73.0% for AGIs $25k-50k, 278.3% for AGIs $50k-75k, 379.7% for AGIs $75k-100k, 969.0% for AGIs $100k-200k, 34388.6% for AGIs over 200k)
Profit/loss from business: +$35,306 (reported on 18.4% of returns)
Here:
+$35,306
State:
+$15,671
(% of AGI for various income ranges: 104.0% for AGIs below $25k, 171.6% for AGIs $25k-50k, 432.8% for AGIs $50k-75k, 473.2% for AGIs $75k-100k, 1082.1% for AGIs $100k-200k, 9342.4% for AGIs over 200k)
Taxable individual retirement arrangement distribution: $28,985 (reported on 13.0% of returns)
95864:
$28,985
California:
$23,505
(% of AGI for various income ranges: 68.1% for AGIs below $25k, 118.2% for AGIs $25k-50k, 266.5% for AGIs $50k-75k, 605.2% for AGIs $75k-100k, 1345.3% for AGIs $100k-200k, 3700.0% for AGIs over 200k)
Self-employed (Keogh) retirement plans: $31,776 (reported on 2.7% of returns)
95864:
$31,776
California:
$30,163
(% of AGI for various income ranges: 60.5% for AGIs $75k-100k, 105.3% for AGIs $100k-200k, 1519.2% for AGIs over 200k)
Total itemized deductions: $38,504 (reported on 24.5% of returns)
Here:
$38,504
State:
$39,517
(% of AGI for various income ranges: 171.3% for AGIs below $25k, 286.6% for AGIs $25k-50k, 574.0% for AGIs $50k-75k, 1251.8% for AGIs $75k-100k, 2531.2% for AGIs $100k-200k, 11204.2% for AGIs over 200k)
Charity contributions: $10,972 (reported on 21.3% of returns)
Here:
$10,972
State:
$12,598
(% of AGI for various income ranges: 8.6% for AGIs below $25k, 23.8% for AGIs $25k-50k, 50.2% for AGIs $50k-75k, 145.5% for AGIs $75k-100k, 422.4% for AGIs $100k-200k, 3686.3% for AGIs over 200k)
Taxes paid: $8,954 (reported on 24.5% of returns)
95864:
$8,954
State:
$8,807
(% of AGI for various income ranges: 21.3% for AGIs below $25k, 49.3% for AGIs $25k-50k, 158.8% for AGIs $50k-75k, 371.8% for AGIs $75k-100k, 746.0% for AGIs $100k-200k, 2274.4% for AGIs over 200k)
Earned income credit: $1,866 (reported on 7.4% of returns)
Here:
$1,866
State:
$2,074
(% of AGI for various income ranges: 63.5% for AGIs below $25k, 50.9% for AGIs $25k-50k)
Percentage of individuals using paid preparers for their 2020 taxes: 91.4%
Here:
91%
State:
92%
(% for various income ranges: 89.4% for AGIs below $25k, 91.6% for AGIs $25k-50k, 91.8% for AGIs $50k-75k, 91.2% for AGIs $75k-100k, 91.0% for AGIs $100k-200k, 93.5% for AGIs over 200k)
Averages for the 2012 tax year for zip code 95864, filed in 2013:
Average Adjusted Gross Income (AGI) in 2012: $133,099 (Individual Income Tax Returns)
Here:
$133,099
State:
$72,726
Salary/wage: $92,394 (reported on 71.6% of returns)
Here:
$92,394
State:
$59,079
(% of AGI for various income ranges: 62.7% for AGIs below $25k, 66.5% for AGIs $25k-50k, 60.3% for AGIs $50k-75k, 56.8% for AGIs $75k-100k, 58.5% for AGIs $100k-200k, 43.0% for AGIs over 200k)
Taxable interest for individuals: $3,214 (reported on 57.8% of returns)
This zip code:
$3,214
California:
$2,146
(% of AGI for various income ranges: 1.9% for AGIs below $25k, 1.4% for AGIs $25k-50k, 1.5% for AGIs $50k-75k, 1.0% for AGIs $75k-100k, 1.3% for AGIs $100k-200k, 1.4% for AGIs over 200k)
Ordinary dividends: $10,298 (reported on 38.8% of returns)
Here:
$10,298
State:
$9,308
(% of AGI for various income ranges: 4.2% for AGIs below $25k, 2.3% for AGIs $25k-50k, 2.6% for AGIs $50k-75k, 3.1% for AGIs $75k-100k, 3.0% for AGIs $100k-200k, 3.0% for AGIs over 200k)
Net capital gain/loss in AGI: +$65,049 (reported on 34.1% of returns)
Here:
+$65,049
State:
+$30,460
(% of AGI for various income ranges: 0.6% for AGIs below $25k, 0.2% for AGIs $25k-50k, 0.9% for AGIs $50k-75k, 1.5% for AGIs $75k-100k, 2.0% for AGIs $100k-200k, 26.8% for AGIs over 200k)
Profit/loss from business: +$37,132 (reported on 18.5% of returns)
Here:
+$37,132
State:
+$17,064
(% of AGI for various income ranges: 10.0% for AGIs below $25k, 5.1% for AGIs $25k-50k, 3.0% for AGIs $50k-75k, 4.3% for AGIs $75k-100k, 4.5% for AGIs $100k-200k, 5.5% for AGIs over 200k)
Taxable individual retirement arrangement distribution: $27,614 (reported on 17.1% of returns)
95864:
$27,614
California:
$19,557
(% of AGI for various income ranges: 4.5% for AGIs below $25k, 3.4% for AGIs $25k-50k, 3.9% for AGIs $50k-75k, 4.5% for AGIs $75k-100k, 4.8% for AGIs $100k-200k, 3.0% for AGIs over 200k)
Self-employment retirement plans: $30,522 (reported on 2.9% of returns)
95864:
$30,522
California:
$24,530
(% of AGI for various income ranges: 0.4% for AGIs $50k-75k, 0.5% for AGIs $100k-200k, 0.9% for AGIs over 200k)
Total itemized deductions: $43,000 (19% of AGI, reported on 49.9% of returns)
Here:
$43,000
State:
$34,004
Here:
18.7% of AGI
State:
22.7% of AGI
(% of AGI for various income ranges: 14.4% for AGIs below $25k, 13.8% for AGIs $25k-50k, 15.5% for AGIs $50k-75k, 17.3% for AGIs $75k-100k, 18.6% for AGIs $100k-200k, 15.5% for AGIs over 200k)
Charity contributions: $5,742 (reported on 44.3% of returns)
Here:
$5,742
State:
$4,659
(% of AGI for various income ranges: 0.9% for AGIs below $25k, 1.2% for AGIs $25k-50k, 1.7% for AGIs $50k-75k, 1.9% for AGIs $75k-100k, 2.1% for AGIs $100k-200k, 2.0% for AGIs over 200k)
Taxes paid: $22,331 (reported on 49.9% of returns)
95864:
$22,331
State:
$14,448
(% of AGI for various income ranges: 2.8% for AGIs below $25k, 3.5% for AGIs $25k-50k, 4.1% for AGIs $50k-75k, 5.6% for AGIs $75k-100k, 7.4% for AGIs $100k-200k, 10.1% for AGIs over 200k)
Earned income credit: $1,965 (reported on 9.9% of returns)
Here:
$1,965
State:
$2,286
(% of AGI for various income ranges: 4.7% for AGIs below $25k, 0.7% for AGIs $25k-50k)
Percentage of individuals using paid preparers for their 2012 taxes: 58.3%
Here:
58%
State:
64%
(% for various income ranges: 48.5% for AGIs below $25k, 50.8% for AGIs $25k-50k, 57.1% for AGIs $50k-75k, 59.6% for AGIs $75k-100k, 63.5% for AGIs $100k-200k, 81.2% for AGIs over 200k)
Averages for the 2004 tax year for zip code 95864, filed in 2005:
Average Adjusted Gross Income (AGI) in 2004: $99,348 (Individual Income Tax Returns)
Here:
$99,348
State:
$58,600
Salary/wage: $72,096 (reported on 71.5% of returns)
Here:
$72,096
State:
$49,455
(% of AGI for various income ranges: 60.1% for AGIs $10k-25k, 66.6% for AGIs $25k-50k, 63.2% for AGIs $50k-75k, 59.4% for AGIs $75k-100k, 46.0% for AGIs over 100k)
Taxable interest for individuals: $3,635 (reported on 67.0% of returns)
This zip code:
$3,635
California:
$2,365
(% of AGI for various income ranges: 4.6% for AGIs $10k-25k, 2.4% for AGIs $25k-50k, 2.3% for AGIs $50k-75k, 2.4% for AGIs $75k-100k, 2.2% for AGIs over 100k)
Taxable dividends: $6,155 (reported on 45.0% of returns)
Here:
$6,155
State:
$4,746
(% of AGI for various income ranges: 3.7% for AGIs $10k-25k, 2.6% for AGIs $25k-50k, 2.6% for AGIs $50k-75k, 2.5% for AGIs $75k-100k, 2.6% for AGIs over 100k)
Net capital gain/loss: +$26,122 (reported on 38.9% of returns)
Here:
+$26,122
State:
+$23,418
(% of AGI for various income ranges: 1.2% for AGIs $10k-25k, 0.8% for AGIs $25k-50k, 1.2% for AGIs $50k-75k, 2.0% for AGIs $75k-100k, 13.3% for AGIs over 100k)
Profit/loss from business: +$38,645 (reported on 18.6% of returns)
Here:
+$38,645
State:
+$16,826
(% of AGI for various income ranges: 7.8% for AGIs $10k-25k, 4.1% for AGIs $25k-50k, 4.8% for AGIs $50k-75k, 5.6% for AGIs $75k-100k, 7.8% for AGIs over 100k)
Profit/loss from farming: +$875 (reported on 0.3% of returns)
Here:
+$875
State:
-$7,562
IRA payment deduction: $3,231 (reported on 2.9% of returns)
95864:
$3,231
California:
$3,192
(% of AGI for various income ranges: 0.3% for AGIs $10k-25k, 0.2% for AGIs $25k-50k, 0.1% for AGIs $50k-75k, 0.2% for AGIs $75k-100k, 0.1% for AGIs over 100k)
Self-employed pension: $21,576 (reported on 3.9% of returns)
Here:
$21,576
California:
$17,688
(% of AGI for various income ranges: 0.2% for AGIs $10k-25k, 0.2% for AGIs $25k-50k, 0.4% for AGIs $50k-75k, 0.4% for AGIs $75k-100k, 1.0% for AGIs over 100k)
Total itemized deductions: $33,800 (20% of AGI, reported on 50.1% of returns)
Here:
$33,800
State:
$28,113
Here:
19.6% of AGI
State:
25.3% of AGI
(% of AGI for various income ranges: 17.4% for AGIs $10k-25k, 15.5% for AGIs $25k-50k, 18.8% for AGIs $50k-75k, 19.7% for AGIs $75k-100k, 16.1% for AGIs over 100k)
Charity contributions deductions: $5,350 (3% of AGI, reported on 46.1% of returns)
Here:
$5,350
State:
$3,923
Here:
3.0% of AGI
State:
3.3% of AGI
(% of AGI for various income ranges: 1.3% for AGIs $10k-25k, 1.6% for AGIs $25k-50k, 2.2% for AGIs $50k-75k, 2.6% for AGIs $75k-100k, 2.6% for AGIs over 100k)
Total tax: $21,861 (reported on 84.1% of returns)
95864:
$21,861
State:
$10,761
(% of AGI for various income ranges: 5.0% for AGIs $10k-25k, 8.0% for AGIs $25k-50k, 10.1% for AGIs $50k-75k, 11.3% for AGIs $75k-100k, 21.6% for AGIs over 100k)
Earned income credit: $1,493 (reported on 6.2% of returns)
Here:
$1,493
State:
$1,763
Percentage of individuals using paid preparers for their 2004 taxes: 62.3%
Here:
62%
State:
66%
(% for various income ranges: 56.1% for AGIs below $10k, 56.4% for AGIs $10k-25k, 55.8% for AGIs $25k-50k, 63.2% for AGIs $50k-75k, 62.3% for AGIs $75k-100k, 75.1% for AGIs over 100k)
Likely homosexual households (counted as self-reported same-sex unmarried-partner households)
Lesbian couples: 0.0% of all households
Gay men: 0.2% of all households
Household received Food Stamps/SNAP in the past 12 months: 781 Household did not receive Food Stamps/SNAP in the past 12 months: 9,215
Women who had a birth in the past 12 months: 218 (196 now married, 21 unmarried) Women who did not have a birth in the past 12 months: 5,248 (2,266 now married, 2,974 unmarried)
Housing units in zip code 95864 with a mortgage: 4,952 (427 second mortgage, 12 home equity loan, 336 both second mortgage and home equity loan) Houses without a mortgage: 73
Median monthly owner costs for units with a mortgage: $2,797 Median monthly owner costs for units without a mortgage: $933
Residents with income below the poverty level in 2022:
This zip code:
9.6%
Whole state:
12.2%
Residents with income below 50% of the poverty level in 2022:
This zip code:
5.3%
Whole state:
6.2%
Median number of rooms in houses and condos:
Here:
6.7
State:
6.0
Median number of rooms in apartments:
Here:
4.8
State:
3.9
Notable locations in this zip code not listed on our city pages
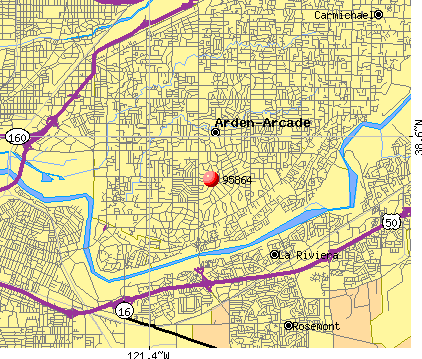
Notable locations in zip code 95864: Arden-Dimick Community Library (A), Sacramento Metropolitan Fire District Station 110 (B), Sacramento Metro Fire Station Number 107 (C). Display/hide their locations on the map
Shopping Centers: Pavilions Shopping Center (1), Bel Air Shopping Center (2), Arden Town Shopping Center (3), Arden Plaza Shopping Center (4), Arden Morse Shopping Center (5). Display/hide their locations on the map
Churches in zip code 95864 include: Arden Christian Church (A), Arden Hills Christian Church (B), Good Shepherd Lutheran Church (C), Grace Presbyterian Church (D), Kingdom Hall of Jehovahs Witnesses (E), Saint Marks United Methodist Church (F), Sierra Arden United Church of Christ (G), Vedanta Society of Sacramento (H). Display/hide their locations on the map
Parks in zip code 95864 include: Deterding Park (1), Oak Meadow Park (2), Crabtree Park (3), Jonas Larkspur Park (4), Winterstein Park (5), Ashton Park (6), Cresta Park (7), La Sierra Park (8), Orville Wright Park (9). Display/hide their locations on the map
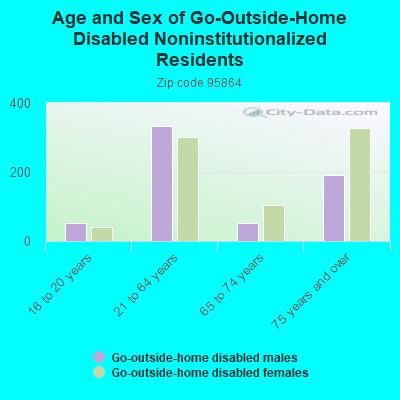
In group quarters: 70 (-1 institutionalized population)
Size of family households: 3,680 2-persons, 1,582 3-persons, 1,429 4-persons, 611 5-persons, 109 6-persons, 60 7-or-more-persons
Size of nonfamily households: 2,094 1-person, 470 2-persons, 71 3-persons
3,942 married couples with children.
1,594 single-parent households (502 men, 1,092 women).
82.3% of residents of 95864 zip code speak English at home.
6.6% of residents speak Spanish at home (75% very well, 6% well, 11% not well, 9% not at all).
7.7% of residents speak other Indo-European language at home (62% very well, 25% well, 8% not well, 6% not at all).
2.8% of residents speak Asian or Pacific Island language at home (76% very well, 18% well, 7% not well).
0.9% of residents speak other language at home (97% very well, 3% well).
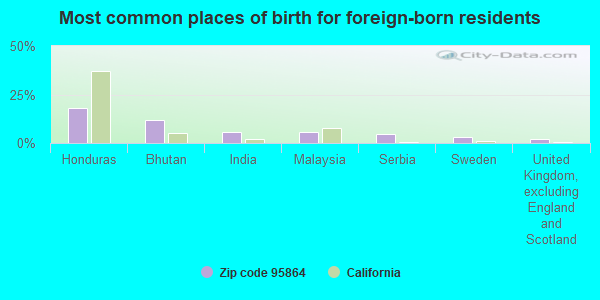
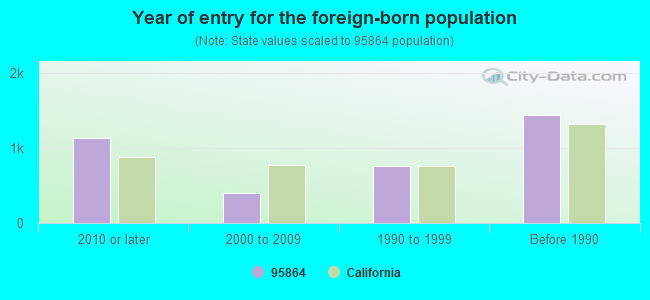
Foreign born population: 3,232 (12.7%) (55.2% of them are naturalized citizens)
Facilities with environmental interests located in this zip code:
CHEVRON STATION 91743 (3481 FAIR OAKS BLVD in SACRAMENTO, CA)
STATE MASTER (California - Hazardous Waste Tracking) - HAZARDOU WASTE PROGRAM Small Quantity Generators, between 100 kg and 1000 kg of hazardous waste/month (Resource Conservation and Recovery Act (tracking hazardous waste)) - notification Organizations: CHEVRON PRODUCTS CO (CONTACT/OWNER)
EDISON (THOMAS) (1500 DOM WAY in SACRAMENTO, CA)
(National Center for Education Statistics) - STATE ID-6034540 Organizations: SAN JUAN UNIFIED (SCHOOL DISTRICT)
MARIEMONT ELEMENTARY (1401 CORTA WAY in SACRAMENTO, CA)
(National Center for Education Statistics) - STATE ID-6034706 Organizations: SAN JUAN UNIFIED (SCHOOL DISTRICT)
MITCHELL (BILLY) ELEMENTARY (4425 LAURELWOOD WAY in SACRAMENTO, CA)
(National Center for Education Statistics) - STATE ID-6034748 Organizations: SAN JUAN UNIFIED (SCHOOL DISTRICT)
TRANSPORTER (Resource Conservation and Recovery Act (tracking hazardous waste)) Organizations: WILLIAM ALKIRE (CONTACT/OWNER)
NORMAN JACOBSEN MANAGEMENT CO. (451 PARKFAIR DR. in SACRAMENTO, CA)
COMPLIANCE ACTIVITY (Tracking inspections of insecticide, fungicide, and rodenticide, and toxic substances)
A & W CLEANERS (3437 ARDEN WAY in SACRAMENTO, CA)
CRITERIA AND HAZARDOUS AIR POLLUTANT INVENTORY (Inventory of air pollution sources) Business SIC classification: DRYCLEANING PLANTS, EXCEPT RUG CLEANING
Housing units lacking complete plumbing facilities: 1.0% Housing units lacking complete kitchen facilities: 1.1%
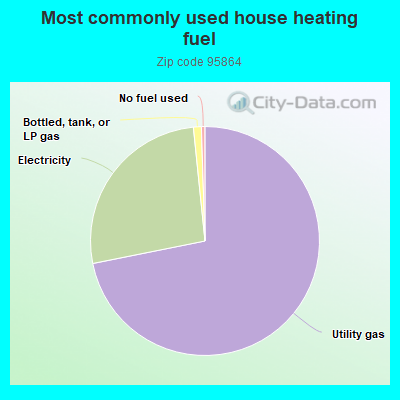
71.5%Utility gas
26.4%Electricity
1.1%Bottled, tank, or LP gas
0.5%No fuel used
Population in 1990: 25,105.
Place of birth for U.S.-born residents:
This state: 16,376
Northeast: 1,022
Midwest: 1,840
South: 1,084
West: 1,400
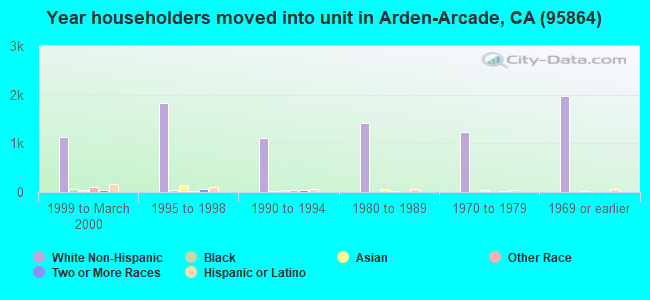
63% of the 95864 zip code residents lived in the same house 5 years ago. Out of people who lived in different houses, 67% lived in this county. Out of people who lived in different counties, 50% lived in California.
91% of the 95864 zip code residents lived in the same house 1 year ago. Out of people who lived in different houses, 52% moved from this county. Out of people who lived in different houses, 32% moved from different county within same state. Out of people who lived in different houses, 13% moved from different state. Out of people who lived in different houses, 3% moved from abroad.
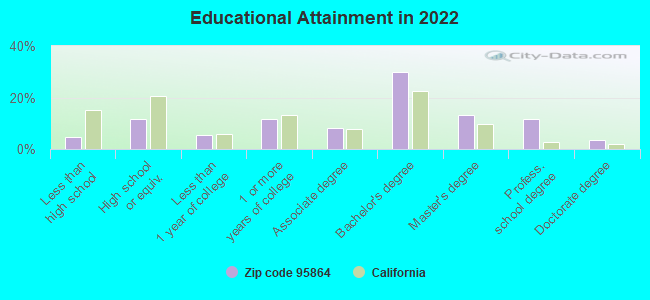
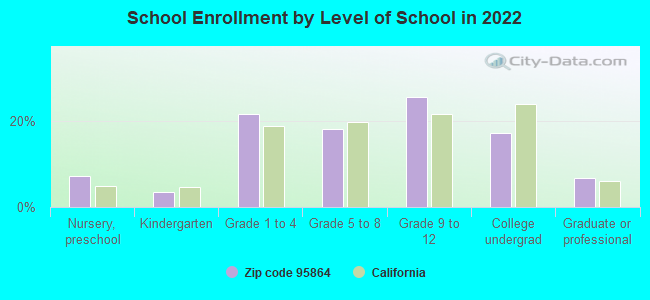
Private vs. public school enrollment:
Students in private schools in grades 1 to 8 (elementary and middle school): 648
Here:
24.4%
California:
10.5%
Students in private schools in grades 9 to 12 (high school): 518
Here:
30.7%
California:
8.5%
Students in private undergraduate colleges: 144
Here:
12.7%
California:
15.9%
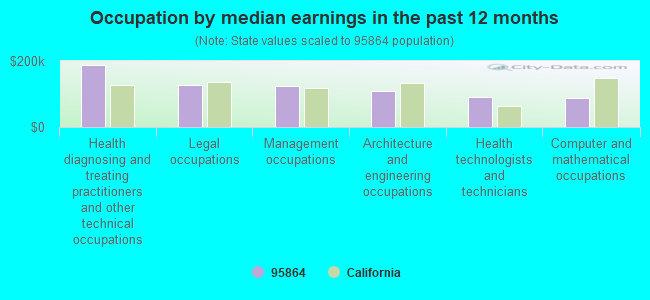
Occupation by median earnings in the past 12 months ($)
189,010Health diagnosing and treating practitioners and other technical occupations
128,633Legal occupations
123,006Management occupations
108,232Architecture and engineering occupations
89,959Health technologists and technicians
88,395Computer and mathematical occupations
Companies with federal contracts located in this zip code (SACRAMENTO, CA):
EASTER SEAL SOCIETY OF SUPERIO (3205 HURLEY WAY) : $2,324,690 in 23 contractsfrom 1999 to 2005
Contracts for Guard Services, Other Housekeeping Services, Custodial Janitorial Services, Landscaping/Groundskeeping Services by Department of Veterans Affairs, Navy Signed by year:2000: $0; 2001: $400,000; 2002: $358,172; 2003: $442,787; 2004: $460,404; 2005: $441,327; 2006: $0.
Biggest contracts:
$442,452 with Department of Veterans Affairs for Guard Services. Signed on 2004-10-01. Completion date: 2005-09-30.
$424,766, same as above.Signed on 2005-10-01. Completion date: 2006-09-30.
$405,375 with Department of Veterans Affairs for Other Housekeeping Services. Signed on 2003-10-02. Effective on 2004-09-30. Completion date: 2004-09-30.
$272,228 with Department of Veterans Affairs for Custodial Janitorial Services. Signed on 2002-10-15. Completion date: 2003-09-15.
NANTICOKE (3436 AMERICAN RIVER DR STE; small business) : $8,820 in 2 contractsfrom 2005 to 2006
$4,720 with Army for Communications Services. Signed on 2005-11-22. Completion date: 2005-12-30.
$4,100, same as above.Signed on 2006-04-18. Completion date: 2006-09-30.
NORTHERN CALIFORNIA COURT REPO (3610 AMERICAN RIVER DR STE; small business)
$4,732 with Army for Legal Services. Signed on 2005-12-30. Completion date: 2005-12-30.
ORTECH, INC (1035 MORSE AVE; small business) : $0 in 2 contractsin 2006
$3,857 with Navy for Plate, Sheet, Strip, and Foil; Nonferrous Base Metal. Signed on 2006-03-29. Completion date: 2006-04-26.
-$3,857, same as above.Signed on 2006-05-20. Completion date: 2006-04-26.
Top industries in this zip code by the number of employees in 2005:
2005 - 2018 National Fire Incident Reporting System (NFIRS) incidents
Based on the data from the years 2005 - 2018 the average number of fire incidents per year is 57. The highest number of reported fire incidents - 106 took place in 2014, and the least - 4 in 2007. The data has an increasing trend.
When looking into fire subcategories, the most reports belonged to: Outside Fires (46.5%), and Structure Fires (30.8%).
Fire incident types reported to NFIRS in Zip Code 95864


+$875
-$7,562
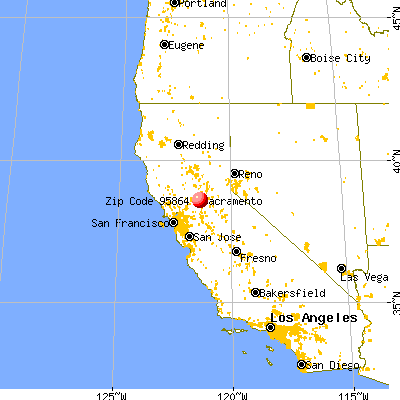
 Nearest zip codes: 95825, 95826, 95821, 95827, 95608, 95819.
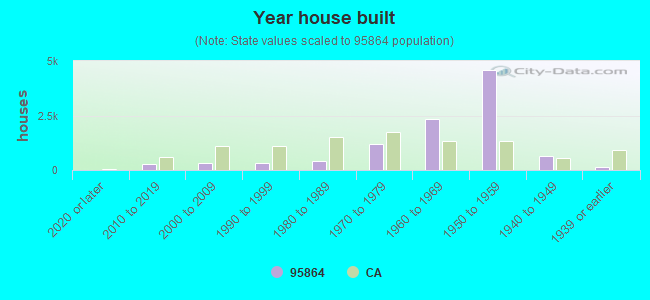


 Based on the data from the years 2005 - 2018 the average number of fire incidents per year is 57. The highest number of reported fire incidents - 106 took place in 2014, and the least - 4 in 2007. The data has an increasing trend.
 When looking into fire subcategories, the most reports belonged to: Outside Fires (46.5%), and Structure Fires (30.8%).