Races in Saco, Maine (ME) Detailed Stats
Data:
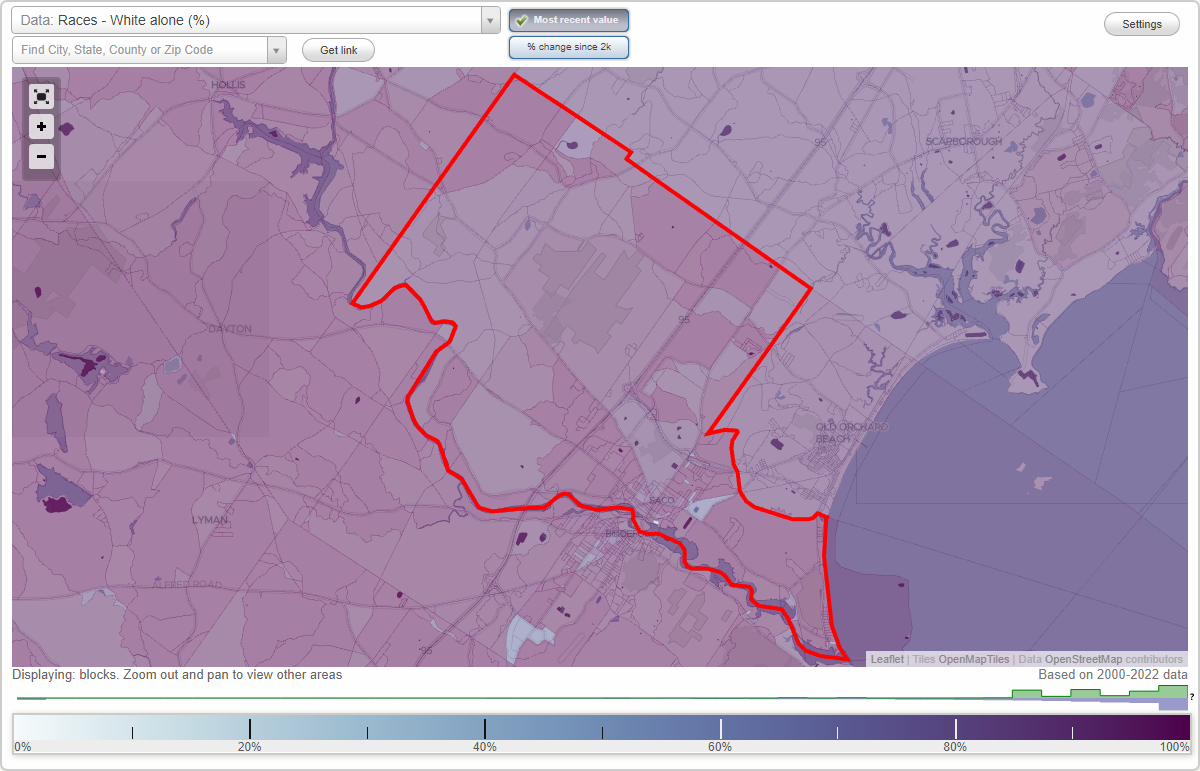
Races - White alone (%)
Races - White alone (% change since 2000)
Races - Black alone (%)
Races - Black alone (% change since 2000)
Races - American Indian alone (%)
Races - American Indian alone (% change since 2000)
Races - Asian alone (%)
Races - Asian alone (% change since 2000)
Races - Hispanic (%)
Races - Hispanic (% change since 2000)
Races - Native Hawaiian and Other Pacific Islander alone (%)
Races - Native Hawaiian and Other Pacific Islander alone (% change since 2000)
Races - Two or more races(%)
Races - Two or more races(% change since 2000)
Races - Other race alone (%)
Races - Other race alone (% change since 2000)
Racial diversity
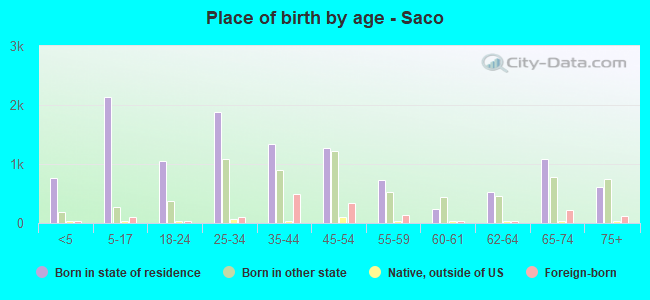
Place of birth - Born in state of residence (%)
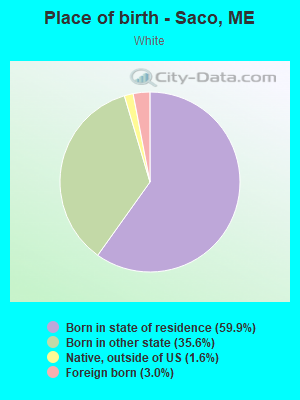
Place of birth - Born in state of residence (%) - White
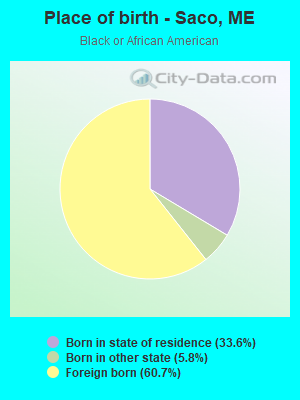
Place of birth - Born in state of residence (%) - Black or African American
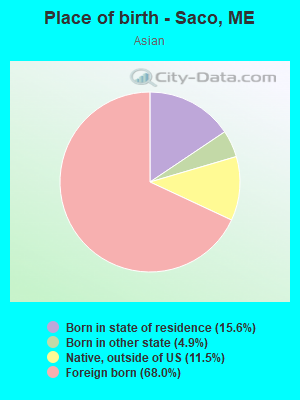
Place of birth - Born in state of residence (%) - Asian
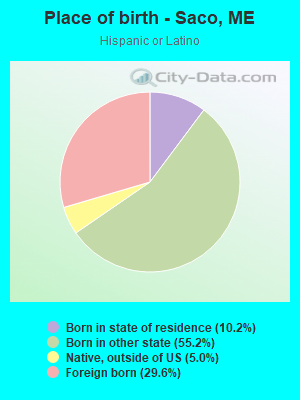
Place of birth - Born in state of residence (%) - Hispanic or Latino
Place of birth - Born in state of residence (%) - American Indian and Alaska Native
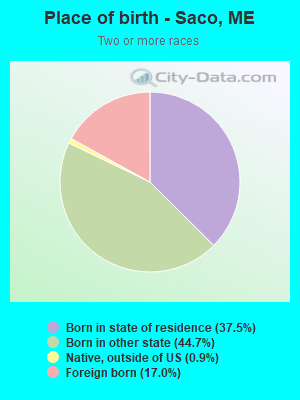
Place of birth - Born in state of residence (%) - Multirace
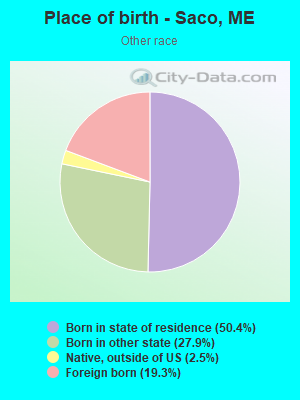
Place of birth - Born in state of residence (%) - Other Race
Place of birth - Born in other state (%)
Place of birth - Born in other state (%) - White
Place of birth - Born in other state (%) - Black or African American
Place of birth - Born in other state (%) - Asian
Place of birth - Born in other state (%) - Hispanic or Latino
Place of birth - Born in other state (%) - American Indian and Alaska Native
Place of birth - Born in other state (%) - Multirace
Place of birth - Born in other state (%) - Other Race
Place of birth - Native, outside of US (%)
Place of birth - Native, outside of US (%) - White
Place of birth - Native, outside of US (%) - Black or African American
Place of birth - Native, outside of US (%) - Asian
Place of birth - Native, outside of US (%) - Hispanic or Latino
Place of birth - Native, outside of US (%) - American Indian and Alaska Native
Place of birth - Native, outside of US (%) - Multirace
Place of birth - Native, outside of US (%) - Other Race
Place of birth - Foreign born (%)
Place of birth - Foreign born (%) - White
Place of birth - Foreign born (%) - Black or African American
Place of birth - Foreign born (%) - Asian
Place of birth - Foreign born (%) - Hispanic or Latino
Place of birth - Foreign born (%) - American Indian and Alaska Native
Place of birth - Foreign born (%) - Multirace
Place of birth - Foreign born (%) - Other Race
Residents speaking English at home (%)
Residents speaking English at home - Born in the United States (%)
Residents speaking English at home - Native, born elsewhere (%)
Residents speaking English at home - Foreign born (%)
Residents speaking Spanish at home (%)
Residents speaking Spanish at home - Born in the United States (%)
Residents speaking Spanish at home - Native, born elsewhere (%)
Residents speaking Spanish at home - Foreign born (%)
Residents speaking other language at home (%)
Residents speaking other language at home - Born in the United States (%)
Residents speaking other language at home - Native, born elsewhere (%)
Residents speaking other language at home - Foreign born (%)
Marital status - Never married (%)
Marital status - Now married (%)
Marital status - Separated (%)
Marital status - Widowed (%)
Marital status - Divorced (%)
Ancestries Reported - Arab (%)
Ancestries Reported - Czech (%)
Ancestries Reported - Danish (%)
Ancestries Reported - Dutch (%)
Ancestries Reported - English (%)
Ancestries Reported - French (%)
Ancestries Reported - French Canadian (%)
Ancestries Reported - German (%)
Ancestries Reported - Greek (%)
Ancestries Reported - Hungarian (%)
Ancestries Reported - Irish (%)
Ancestries Reported - Italian (%)
Ancestries Reported - Lithuanian (%)
Ancestries Reported - Norwegian (%)
Ancestries Reported - Polish (%)
Ancestries Reported - Portuguese (%)
Ancestries Reported - Russian (%)
Ancestries Reported - Scotch-Irish (%)
Ancestries Reported - Scottish (%)
Ancestries Reported - Slovak (%)
Ancestries Reported - Subsaharan African (%)
Ancestries Reported - Swedish (%)
Ancestries Reported - Swiss (%)
Ancestries Reported - Ukrainian (%)
Ancestries Reported - United States (%)
Ancestries Reported - Welsh (%)
Ancestries Reported - West Indian (%)
Ancestries Reported - Other (%)
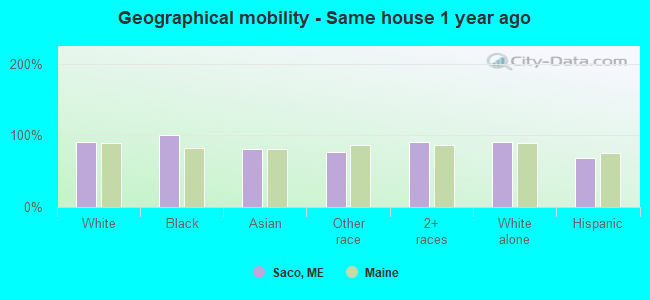
Geographical mobility - Same house 1 year ago (%)
Geographical mobility - Same house 1 year ago (%) - White
Geographical mobility - Same house 1 year ago (%) - Black or African American
Geographical mobility - Same house 1 year ago (%) - Asian
Geographical mobility - Same house 1 year ago (%) - Hispanic or Latino
Geographical mobility - Same house 1 year ago (%) - American Indian and Alaska Native
Geographical mobility - Same house 1 year ago (%) - Multirace
Geographical mobility - Same house 1 year ago (%) - Other Race
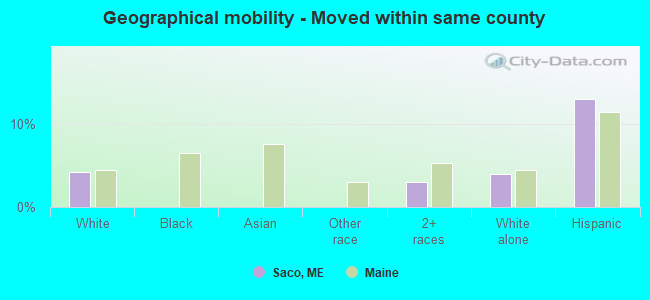
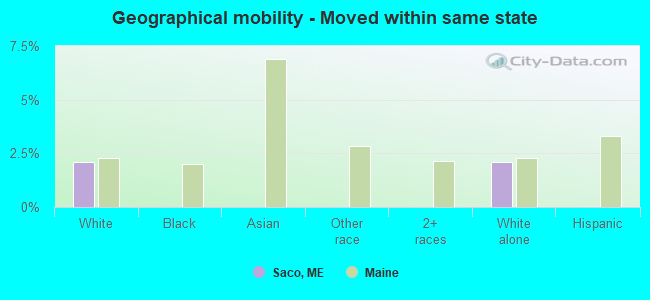
Geographical mobility - Moved within same county (%)
Geographical mobility - Moved within same county (%) - White
Geographical mobility - Moved within same county (%) - Black or African American
Geographical mobility - Moved within same county (%) - Asian
Geographical mobility - Moved within same county (%) - Hispanic or Latino
Geographical mobility - Moved within same county (%) - American Indian and Alaska Native
Geographical mobility - Moved within same county (%) - Multirace
Geographical mobility - Moved within same county (%) - Other Race
Geographical mobility - Moved from different county within same state (%)
Geographical mobility - Moved from different county within same state (%) - White
Geographical mobility - Moved from different county within same state (%) - Black or African American
Geographical mobility - Moved from different county within same state (%) - Asian
Geographical mobility - Moved from different county within same state (%) - Hispanic or Latino
Geographical mobility - Moved from different county within same state (%) - American Indian and Alaska Native
Geographical mobility - Moved from different county within same state (%) - Multirace
Geographical mobility - Moved from different county within same state (%) - Other Race
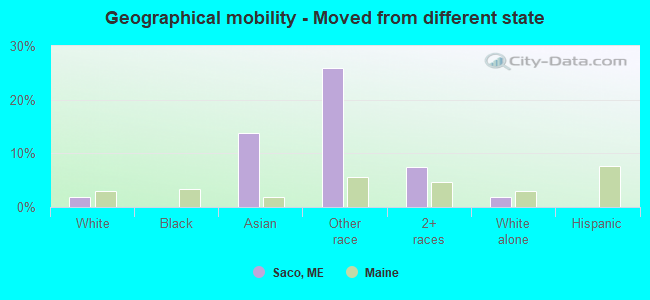
Geographical mobility - Moved from different state (%)
Geographical mobility - Moved from different state (%) - White
Geographical mobility - Moved from different state (%) - Black or African American
Geographical mobility - Moved from different state (%) - Asian
Geographical mobility - Moved from different state (%) - Hispanic or Latino
Geographical mobility - Moved from different state (%) - American Indian and Alaska Native
Geographical mobility - Moved from different state (%) - Multirace
Geographical mobility - Moved from different state (%) - Other Race
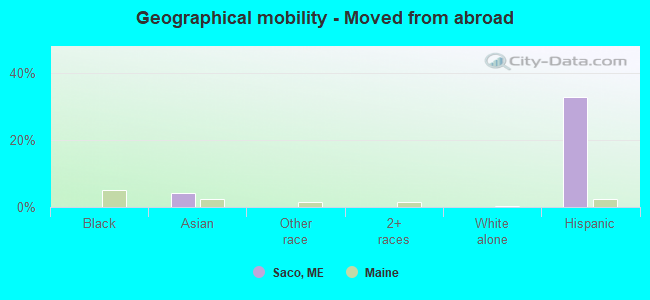
Geographical mobility - Moved from abroad (%)
Geographical mobility - Moved from abroad (%) - White
Geographical mobility - Moved from abroad (%) - Black or African American
Geographical mobility - Moved from abroad (%) - Asian
Geographical mobility - Moved from abroad (%) - Hispanic or Latino
Geographical mobility - Moved from abroad (%) - American Indian and Alaska Native
Geographical mobility - Moved from abroad (%) - Multirace
Geographical mobility - Moved from abroad (%) - Other Race
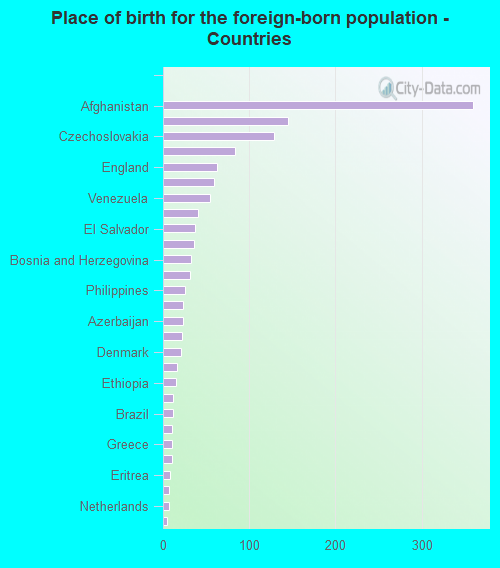
Place of birth for the foreign-born population - Ireland (%)
Place of birth for the foreign-born population - Denmark (%)
Place of birth for the foreign-born population - Norway (%)
Place of birth for the foreign-born population - Sweden (%)
Place of birth for the foreign-born population - United Kingdom (%)
Place of birth for the foreign-born population - England (%)
Place of birth for the foreign-born population - Scotland (%)
Place of birth for the foreign-born population - Other Northern Europe (%)
Place of birth for the foreign-born population - Austria (%)
Place of birth for the foreign-born population - Belgium (%)
Place of birth for the foreign-born population - France (%)
Place of birth for the foreign-born population - Germany (%)
Place of birth for the foreign-born population - Netherlands (%)
Place of birth for the foreign-born population - Switzerland (%)
Place of birth for the foreign-born population - Other Western Europe (%)
Place of birth for the foreign-born population - Greece (%)
Place of birth for the foreign-born population - Italy (%)
Place of birth for the foreign-born population - Portugal (%)
Place of birth for the foreign-born population - Spain (%)
Place of birth for the foreign-born population - Other Southern Europe (%)
Place of birth for the foreign-born population - Albania (%)
Place of birth for the foreign-born population - Belarus (%)
Place of birth for the foreign-born population - Bosnia and Herzegovina (%)
Place of birth for the foreign-born population - Bulgaria (%)
Place of birth for the foreign-born population - Croatia (%)
Place of birth for the foreign-born population - Czechoslovakia (%)
Place of birth for the foreign-born population - Hungary (%)
Place of birth for the foreign-born population - Latvia (%)
Place of birth for the foreign-born population - Lithuania (%)
Place of birth for the foreign-born population - North Macedonia (Macedonia) (%)
Place of birth for the foreign-born population - Moldova (%)
Place of birth for the foreign-born population - Poland (%)
Place of birth for the foreign-born population - Romania (%)
Place of birth for the foreign-born population - Russia (%)
Place of birth for the foreign-born population - Serbia (%)
Place of birth for the foreign-born population - Ukraine (%)
Place of birth for the foreign-born population - Other Eastern Europe (%)
Place of birth for the foreign-born population - China (%)
Place of birth for the foreign-born population - Hong Kong (%)
Place of birth for the foreign-born population - Taiwan (%)
Place of birth for the foreign-born population - Japan (%)
Place of birth for the foreign-born population - Korea (%)
Place of birth for the foreign-born population - Other Eastern Asia (%)
Place of birth for the foreign-born population - Afghanistan (%)
Place of birth for the foreign-born population - Bangladesh (%)
Place of birth for the foreign-born population - India (%)
Place of birth for the foreign-born population - Iran (%)
Place of birth for the foreign-born population - Kazakhstan (%)
Place of birth for the foreign-born population - Nepal (%)
Place of birth for the foreign-born population - Pakistan (%)
Place of birth for the foreign-born population - Sri Lanka (%)
Place of birth for the foreign-born population - Uzbekistan (%)
Place of birth for the foreign-born population - Other South Central Asia (%)
Place of birth for the foreign-born population - Burma (%)
Place of birth for the foreign-born population - Cambodia (%)
Place of birth for the foreign-born population - Indonesia (%)
Place of birth for the foreign-born population - Laos (%)
Place of birth for the foreign-born population - Malaysia (%)
Place of birth for the foreign-born population - Philippines (%)
Place of birth for the foreign-born population - Singapore (%)
Place of birth for the foreign-born population - Thailand (%)
Place of birth for the foreign-born population - Vietnam (%)
Place of birth for the foreign-born population - Other South Eastern Asia (%)
Place of birth for the foreign-born population - Armenia (%)
Place of birth for the foreign-born population - Iraq (%)
Place of birth for the foreign-born population - Israel (%)
Place of birth for the foreign-born population - Jordan (%)
Place of birth for the foreign-born population - Kuwait (%)
Place of birth for the foreign-born population - Lebanon (%)
Place of birth for the foreign-born population - Saudi Arabia (%)
Place of birth for the foreign-born population - Syria (%)
Place of birth for the foreign-born population - Turkey (%)
Place of birth for the foreign-born population - Yemen (%)
Place of birth for the foreign-born population - Other Western Asia (%)
Place of birth for the foreign-born population - Eritrea (%)
Place of birth for the foreign-born population - Ethiopia (%)
Place of birth for the foreign-born population - Kenya (%)
Place of birth for the foreign-born population - Somalia (%)
Place of birth for the foreign-born population - Uganda (%)
Place of birth for the foreign-born population - Zimbabwe (%)
Place of birth for the foreign-born population - Other Eastern Africa (%)
Place of birth for the foreign-born population - Cameroon (%)
Place of birth for the foreign-born population - Congo (%)
Place of birth for the foreign-born population - Democratic Republic of Congo (Zaire) (%)
Place of birth for the foreign-born population - Other Middle Africa (%)
Place of birth for the foreign-born population - Egypt (%)
Place of birth for the foreign-born population - Morocco (%)
Place of birth for the foreign-born population - Sudan (%)
Place of birth for the foreign-born population - Other Northern Africa (%)
Place of birth for the foreign-born population - South Africa (%)
Place of birth for the foreign-born population - Other Southern Africa (%)
Place of birth for the foreign-born population - Cabo Verde (%)
Place of birth for the foreign-born population - Ghana (%)
Place of birth for the foreign-born population - Liberia (%)
Place of birth for the foreign-born population - Nigeria (%)
Place of birth for the foreign-born population - Senegal (%)
Place of birth for the foreign-born population - Sierra Leone (%)
Place of birth for the foreign-born population - Other Western Africa (%)
Place of birth for the foreign-born population - Australia (%)
Place of birth for the foreign-born population - New Zealand (%)
Place of birth for the foreign-born population - Fiji (%)
Place of birth for the foreign-born population - Micronesia (%)
Place of birth for the foreign-born population - Bahamas (%)
Place of birth for the foreign-born population - Barbados (%)
Place of birth for the foreign-born population - Cuba (%)
Place of birth for the foreign-born population - Dominica (%)
Place of birth for the foreign-born population - Dominican Republic (%)
Place of birth for the foreign-born population - Grenada (%)
Place of birth for the foreign-born population - Haiti (%)
Place of birth for the foreign-born population - Jamaica (%)
Place of birth for the foreign-born population - St. Vincent and the Grenadines (%)
Place of birth for the foreign-born population - Trinidad and Tobago (%)
Place of birth for the foreign-born population - West Indies (%)
Place of birth for the foreign-born population - Other Caribbean (%)
Place of birth for the foreign-born population - Belize (%)
Place of birth for the foreign-born population - Costa Rica (%)
Place of birth for the foreign-born population - El Salvador (%)
Place of birth for the foreign-born population - Guatemala (%)
Place of birth for the foreign-born population - Honduras (%)
Place of birth for the foreign-born population - Mexico (%)
Place of birth for the foreign-born population - Nicaragua (%)
Place of birth for the foreign-born population - Panama (%)
Place of birth for the foreign-born population - Other Central America (%)
Place of birth for the foreign-born population - Argentina (%)
Place of birth for the foreign-born population - Bolivia (%)
Place of birth for the foreign-born population - Brazil (%)
Place of birth for the foreign-born population - Chile (%)
Place of birth for the foreign-born population - Colombia (%)
Place of birth for the foreign-born population - Ecuador (%)
Place of birth for the foreign-born population - Guyana (%)
Place of birth for the foreign-born population - Peru (%)
Place of birth for the foreign-born population - Uruguay (%)
Place of birth for the foreign-born population - Venezuela (%)
Place of birth for the foreign-born population - Other South America (%)
Place of birth for the foreign-born population - Canada (%)
Place of birth for the foreign-born population - Other Northern America (%)
Place of birth for the foreign-born population - Other (%)
Latest news about races in Saco, ME collected exclusively by city-data.com from local newspapers, TV, and radio stations
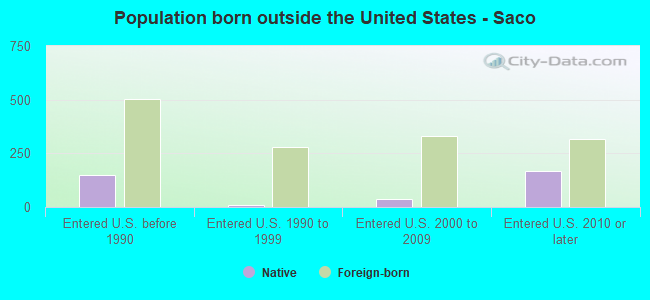
According to 2022 data, the most numerous races in Saco, ME are White alone (18,567 residents), Two or more races (975 residents), and Hispanic (397 residents). 90.2% of Saco residents speak English at home. 7.0% of Saco, ME residents are foreign-born (2.5% born in Asia, 1.6% born in Europe, 1.1% born in Africa, 1.1% born in Latin America), which is 57.3% greater than the foreign-born rate of 3.0% across the entire state of Maine.
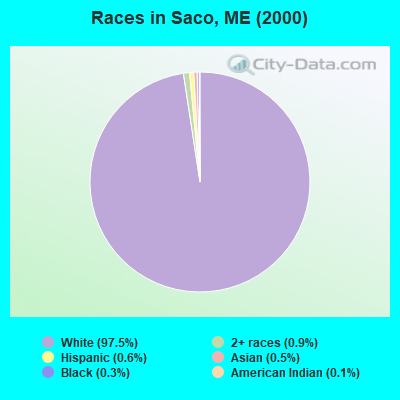
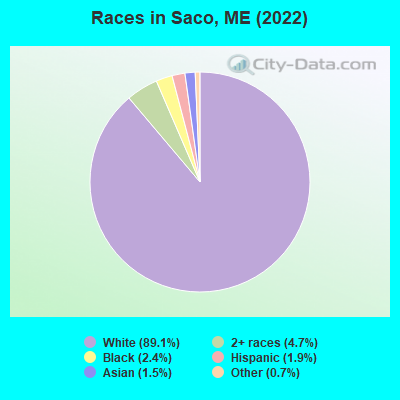
Race distribution in Saco
2000 2022
1,230,297 96.5% White alone 11,731 0.9% Two or more races 9,360 0.7% Hispanic 9,014 0.7% Asian alone 6,440 0.5% Black alone 6,911 0.5% American Indian alone 836 0.07% Other race alone 334 0.03% Native Hawaiian and Other
1,249,233 90.2% White alone 58,357 4.2% Two or more races 28,717 2.1% Hispanic 21,583 1.6% Black alone 16,151 1.2% Asian alone 5,873 0.4% Other race alone 5,205 0.4% American Indian alone 221 0.02% Native Hawaiian and Other
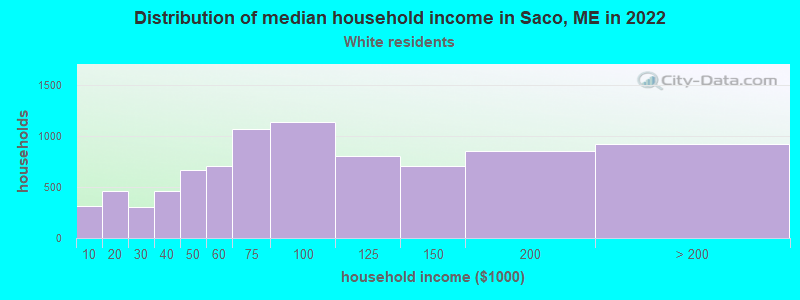
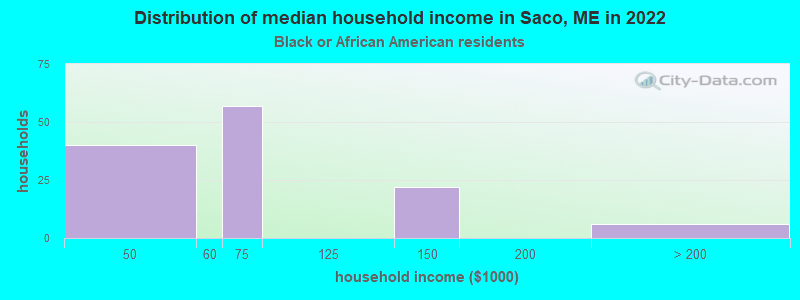
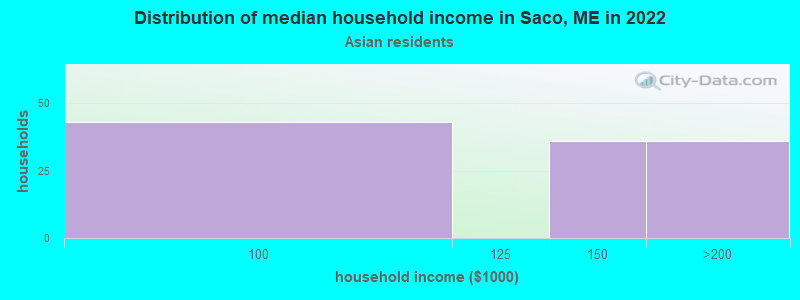
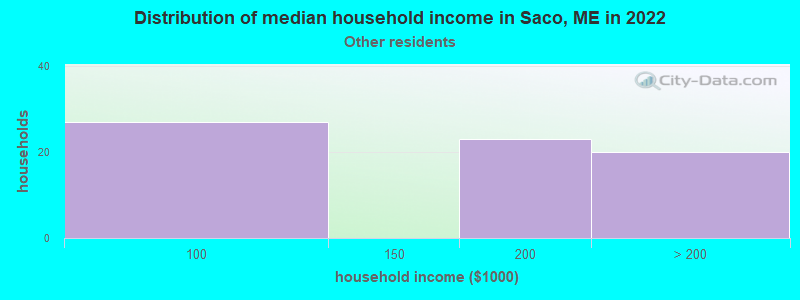
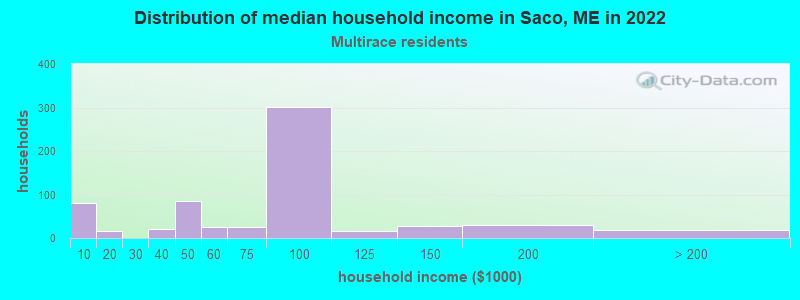
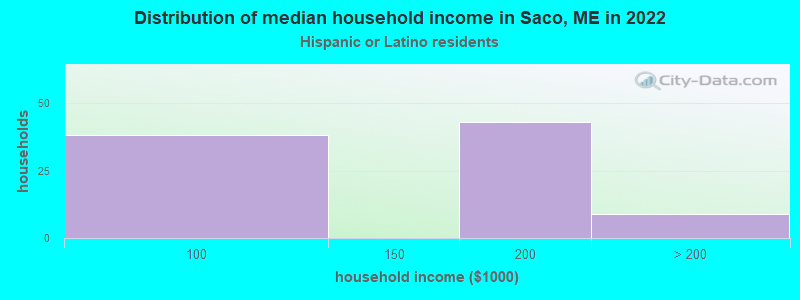
Income and house value in Saco Median household income in 2022 $81,565 White non-Hispanic householders$182,786 Asian householders$171,696 Some other race householders$91,767 Two or more races householders$170,450 Hispanic or Latino race householdersMedian 2022 house value $417,774 White Non-Hispanic householders $85,858 Asian householders$570,993 Two or more races householders$157,058 Hispanic or Latino householders
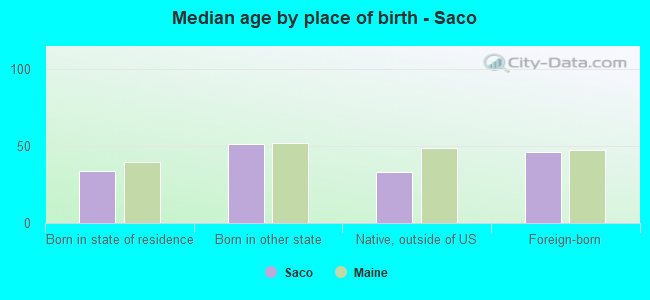
Median age by race in Saco
44.3 Median age for White residents43.2 44.7 28.1 Median age for Black or African American residents28.3 15.8 -896,024,463.9 Median age for American Indian / Alaska Native residents-673,777,777.1 -1,172,897,195.1 36.7 Median age for Asian residents31.2 37.2 -442,352,940.7 Median age for Native Hawaiian / Pacific Islander residents-666,666,666.0 -666,666,666.0 56.6 Median age for Other race residents59.7 31.5 43.5 Median age for Two or more races residents54.3 32.4 44.5 Median age for White alone residents43.0 45.0 39.4 Median age for Hispanic or Latino residents49.4 27.4
Owner/renter occupied households by race in Saco
House owners and renters - White residents 6,000 72.0% Owner occupied2,332 28.0% Renter occupiedHouse owners and renters - Black or African American residents 26 26.8% Owner occupied70 73.2% Renter occupiedHouse owners and renters - Asian residents 121 75.1% Owner occupied40 24.9% Renter occupiedHouse owners and renters - Other race residents 59 100.0% Owner occupiedHouse owners and renters - Two or more races residents 340 65.0% Owner occupied183 35.0% Renter occupiedHouse owners and renters - White alone residents 5,970 71.6% Owner occupied2,371 28.4% Renter occupiedHouse owners and renters - Hispanic or Latino residents 47 100.0% Owner occupied
Language usage in Saco
English speakers - Total 90.2% of residents of Saco speak English at home.
1.2% of residents speak Spanish at home 213 91.8% Speak English very well19 8.2% Speak English less than very well8.5% of residents speak other language at home 1,255 74.7% Speak English very well424 25.3% Speak English less than very well
English speakers - Born in the United States 96.5% of residents of Saco speak English at home.
0.7% of residents speak Spanish at home 46 100.0% Speak English very well3.0% of residents speak other language at home 204 100.0% Speak English very well
English speakers - Native, born elsewhere 65.0% of residents of Saco speak English at home.
9.5% of residents speak Spanish at home 33 100.0% Speak English very well35.8% of residents speak other language at home 124 100.0% Speak English very well
English speakers - Foreign-born 25.5% of residents of Saco speak English at home.
6.8% of residents speak Spanish at home 83 83.8% Speak English very well16 16.2% Speak English less than very well69.6% of residents speak other language at home 666 65.6% Speak English very well349 34.4% Speak English less than very well
White (Caucasian) - Speak only English Native:
96.2% (16,577)Foreign-born:
42.4% (232)
White (Caucasian) - Speak another language Native:
3.8% (655)Foreign-born:
58.5% (320)
Black or African American - Speak only English Native:
60.8% (122)Foreign-born:
19.8% (36)
Black or African American - Speak another language Native:
51.0% (102)Foreign-born:
79.3% (145)
Asian - Speak another language Native:
21.4% (17)Foreign-born:
100.0% (234)
Other race - Speak another language Native:
5.8% (11)Foreign-born:
82.2% (40)
Two or more races - Speak only English Native:
91.8% (830)Foreign-born:
0.4% (2)
Two or more races - Speak another language Native:
7.0% (63)Foreign-born:
93.9% (383)
White alone - Speak only English Native:
96.3% (16,604)Foreign-born:
43.1% (221)
White alone - Speak another language Native:
3.6% (624)Foreign-born:
58.5% (299)
Hispanic or Latino - Speak only English Native:
85.9% (202)Foreign-born:
21.3% (26)
Hispanic or Latino - Speak another language Native:
14.1% (33)Foreign-born:
76.9% (92)
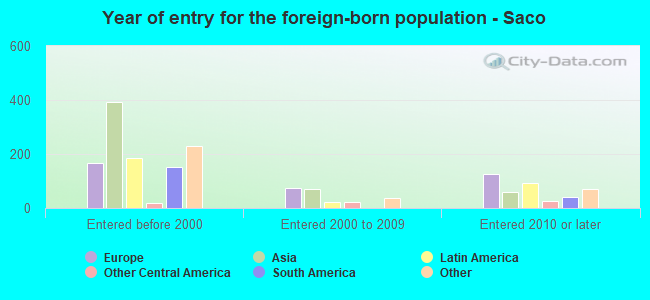
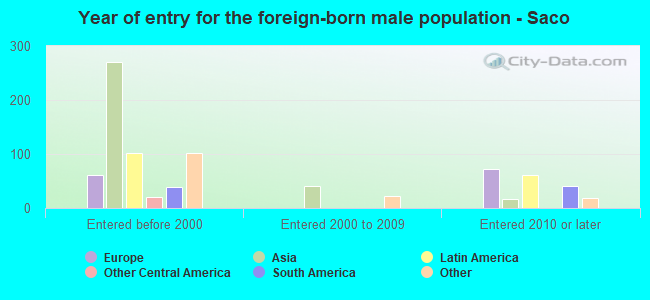
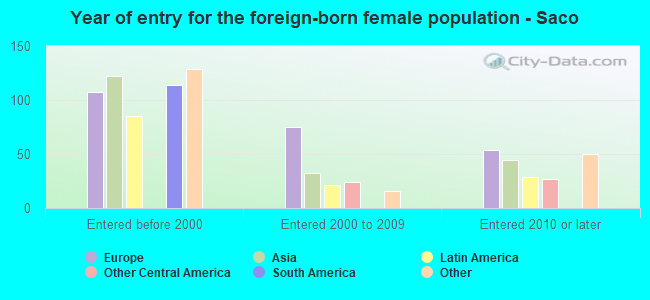
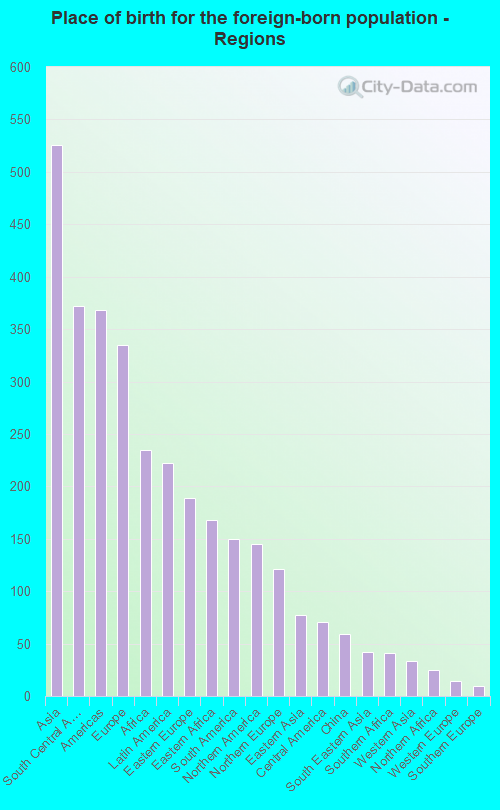
Foreign-born residents in Saco 1,465 residents are foreign born (2.5% Asia , 1.6% Europe , 1.1% Africa , 1.1% Latin America ).
Marital status for residents in Saco Marital status - White (Caucasian) population 15 years and over
Males 32.1% Never married52.2% Now married0.4% Separated2.2% Widowed13.1% DivorcedFemales 30.0% Never married48.1% Now married1.1% Separated6.6% Widowed14.2% DivorcedWomen who gave birth in the past 12 months Now married:
85.8% (141)Unmarried:
14.2% (23)
Women who did not give birth in the past 12 months Now married:
42.6% (1,862)Unmarried:
57.4% (2,513)
Marital status - Black or African American population 15 years and over
Males 88.4% Never married11.6% Now married0.0% Separated0.0% Widowed0.0% DivorcedFemales 80.2% Never married19.8% Now married0.0% Separated0.0% Widowed0.0% DivorcedWomen who gave birth in the past 12 months Now married:
100.0% (26)Unmarried:
0.0% (0)
Women who did not give birth in the past 12 months Now married:
0.0% (0)Unmarried:
100.0% (99)
Marital status - Asian population 15 years and over
Males 18.2% Never married81.8% Now married0.0% Separated0.0% Widowed0.0% DivorcedFemales 11.3% Never married77.4% Now married11.3% Separated0.0% Widowed0.0% DivorcedWomen who gave birth in the past 12 months Now married:
100.0% (20)Unmarried:
0.0% (0)
Women who did not give birth in the past 12 months Now married:
75.4% (40)Unmarried:
24.6% (13)
Marital status - Other race population 15 years and over
Males 42.4% Never married57.6% Now married0.0% Separated0.0% Widowed0.0% DivorcedFemales 13.3% Never married72.3% Now married0.0% Separated14.5% Widowed0.0% DivorcedWomen who did not give birth in the past 12 months Now married:
84.5% (79)Unmarried:
15.5% (15)
Marital status - Two or more races population 15 years and over
Males 14.2% Never married58.6% Now married0.0% Separated0.0% Widowed27.2% DivorcedFemales 37.0% Never married40.5% Now married0.0% Separated6.2% Widowed16.3% DivorcedWomen who did not give birth in the past 12 months Now married:
47.6% (246)Unmarried:
52.4% (271)
Marital status - White alone, not Hispanic / Latino population 15 years and over
Males 32.4% Never married51.7% Now married0.4% Separated2.2% Widowed13.3% DivorcedFemales 29.6% Never married48.3% Now married1.1% Separated6.7% Widowed14.3% DivorcedWomen who gave birth in the past 12 months Now married:
85.8% (141)Unmarried:
14.2% (23)
Women who did not give birth in the past 12 months Now married:
43.0% (1,864)Unmarried:
57.0% (2,468)
Marital status - Hispanic or Latino population 15 years and over
Males 11.6% Never married88.4% Now married0.0% Separated0.0% Widowed0.0% DivorcedFemales 27.7% Never married40.8% Now married0.0% Separated0.0% Widowed31.6% DivorcedWomen who did not give birth in the past 12 months Now married:
43.0% (84)Unmarried:
57.0% (112)
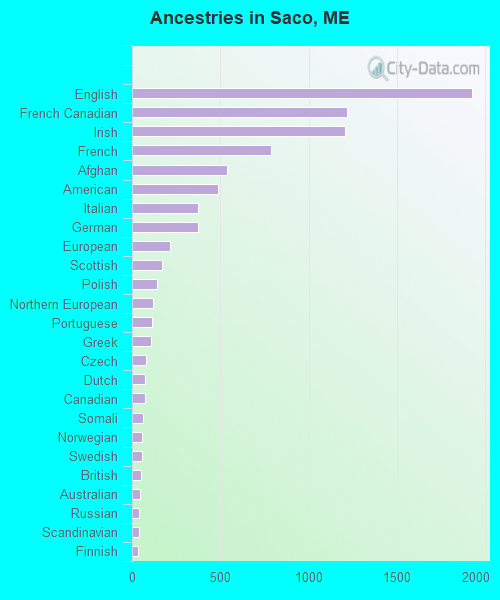
Ancestries in Saco
1,925 19.7% English1,220 12.5% French Canadian1,205 12.3% Irish786 8.0% French537 5.5% Afghan486 5.0% American376 3.8% Italian376 3.8% German213 2.2% European171 1.7% Scottish140 1.4% Polish118 1.2% Northern European114 1.2% Portuguese106 1.1% Greek81 0.8% Czech76 0.8% Dutch72 0.7% Canadian60 0.6% Somali58 0.6% Norwegian56 0.6% Swedish53 0.5% British46 0.5% Australian42 0.4% Russian37 0.4% Scandinavian36 0.4% Finnish34 0.3% Danish27 0.3% Scotch-Irish19 0.2% Slovene17 0.2% Hungarian17 0.2% Albanian16 0.2% Ethiopian13 0.1% Brazilian11 0.1% Welsh6 0.06% Ukrainian5 0.05% Eastern European4 0.04% African3 0.03% Romanian
Children Nativity (place of birth) in Saco
Children under 6 years - Living with two parents Both parents native 594 100.0% NativeBoth parents foreign-born 163 100.0% NativeOne native, one foreign-born parent 133 91.7% Native12 8.3% Foreign-bornChildren under 6 years - Living with one parent Native parent 145 100.0% NativeChildren 6 to 17 years - Living with two parents Both parents native 1,347 98.1% Native26 1.9% Foreign-bornBoth parents foreign-born 63 69.5% Native28 30.5% Foreign-bornOne native, one foreign-born parent 86 100.0% NativeChildren 6 to 17 years - Living with one parent Native parent 602 100.0% NativeForeign-born parent 106 50.0% Native106 50.0% Foreign-born
Grandparents responsible for own grandchildren in Saco
Grandparents (30 to 59 years) White / Caucasian 23 35.3% Responsible for grandchildren42 64.7% Not responsible for grandchildrenWhite alone, not Hispanic / Latino 23 35.3% Responsible for grandchildren42 64.7% Not responsible for grandchildrenGrandparents (60 years and over) White / Caucasian 24 17.0% Responsible for grandchildren118 83.0% Not responsible for grandchildrenWhite alone, not Hispanic / Latino 24 17.0% Responsible for grandchildren118 83.0% Not responsible for grandchildren