Saco, Maine Submit your own pictures of this city and show them to the world
OSM Map
General Map
Google Map
MSN Map
OSM Map
General Map
Google Map
MSN Map
OSM Map
General Map
Google Map
MSN Map
OSM Map
General Map
Google Map
MSN Map
Please wait while loading the map...
Population in 2022: 20,872 (79% urban, 21% rural). Population change since 2000: +24.1%Males: 10,165 Females: 10,707
March 2022 cost of living index in Saco: 112.5 (more than average, U.S. average is 100) Percentage of residents living in poverty in 2022: 8.0%for White Non-Hispanic residents , 10.2% for two or more races residents )
Profiles of local businesses
Business Search - 14 Million verified businesses
Data:
Median household income ($)
Median household income (% change since 2000)
Household income diversity
Ratio of average income to average house value (%)
Ratio of average income to average rent
Median household income ($) - White
Median household income ($) - Black or African American
Median household income ($) - Asian
Median household income ($) - Hispanic or Latino
Median household income ($) - American Indian and Alaska Native
Median household income ($) - Multirace
Median household income ($) - Other Race
Median household income for houses/condos with a mortgage ($)
Median household income for apartments without a mortgage ($)
Races - White alone (%)
Races - White alone (% change since 2000)
Races - Black alone (%)
Races - Black alone (% change since 2000)
Races - American Indian alone (%)
Races - American Indian alone (% change since 2000)
Races - Asian alone (%)
Races - Asian alone (% change since 2000)
Races - Hispanic (%)
Races - Hispanic (% change since 2000)
Races - Native Hawaiian and Other Pacific Islander alone (%)
Races - Native Hawaiian and Other Pacific Islander alone (% change since 2000)
Races - Two or more races (%)
Races - Two or more races (% change since 2000)
Races - Other race alone (%)
Races - Other race alone (% change since 2000)
Racial diversity
Unemployment (%)
Unemployment (% change since 2000)
Unemployment (%) - White
Unemployment (%) - Black or African American
Unemployment (%) - Asian
Unemployment (%) - Hispanic or Latino
Unemployment (%) - American Indian and Alaska Native
Unemployment (%) - Multirace
Unemployment (%) - Other Race
Population density (people per square mile)
Population - Males (%)
Population - Females (%)
Population - Males (%) - White
Population - Males (%) - Black or African American
Population - Males (%) - Asian
Population - Males (%) - Hispanic or Latino
Population - Males (%) - American Indian and Alaska Native
Population - Males (%) - Multirace
Population - Males (%) - Other Race
Population - Females (%) - White
Population - Females (%) - Black or African American
Population - Females (%) - Asian
Population - Females (%) - Hispanic or Latino
Population - Females (%) - American Indian and Alaska Native
Population - Females (%) - Multirace
Population - Females (%) - Other Race
Coronavirus confirmed cases (Apr 27, 2024)
Deaths caused by coronavirus (Apr 27, 2024)
Coronavirus confirmed cases (per 100k population) (Apr 27, 2024)
Deaths caused by coronavirus (per 100k population) (Apr 27, 2024)
Daily increase in number of cases (Apr 27, 2024)
Weekly increase in number of cases (Apr 27, 2024)
Cases doubled (in days) (Apr 27, 2024)
Hospitalized patients (Apr 18, 2022)
Negative test results (Apr 18, 2022)
Total test results (Apr 18, 2022)
COVID Vaccine doses distributed (per 100k population) (Sep 19, 2023)
COVID Vaccine doses administered (per 100k population) (Sep 19, 2023)
COVID Vaccine doses distributed (Sep 19, 2023)
COVID Vaccine doses administered (Sep 19, 2023)
Likely homosexual households (%)
Likely homosexual households (% change since 2000)
Likely homosexual households - Lesbian couples (%)
Likely homosexual households - Lesbian couples (% change since 2000)
Likely homosexual households - Gay men (%)
Likely homosexual households - Gay men (% change since 2000)
Cost of living index
Median gross rent ($)
Median contract rent ($)
Median monthly housing costs ($)
Median house or condo value ($)
Median house or condo value ($ change since 2000)
Mean house or condo value by units in structure - 1, detached ($)
Mean house or condo value by units in structure - 1, attached ($)
Mean house or condo value by units in structure - 2 ($)
Mean house or condo value by units in structure by units in structure - 3 or 4 ($)
Mean house or condo value by units in structure - 5 or more ($)
Mean house or condo value by units in structure - Boat, RV, van, etc. ($)
Mean house or condo value by units in structure - Mobile home ($)
Median house or condo value ($) - White
Median house or condo value ($) - Black or African American
Median house or condo value ($) - Asian
Median house or condo value ($) - Hispanic or Latino
Median house or condo value ($) - American Indian and Alaska Native
Median house or condo value ($) - Multirace
Median house or condo value ($) - Other Race
Median resident age
Resident age diversity
Median resident age - Males
Median resident age - Females
Median resident age - White
Median resident age - Black or African American
Median resident age - Asian
Median resident age - Hispanic or Latino
Median resident age - American Indian and Alaska Native
Median resident age - Multirace
Median resident age - Other Race
Median resident age - Males - White
Median resident age - Males - Black or African American
Median resident age - Males - Asian
Median resident age - Males - Hispanic or Latino
Median resident age - Males - American Indian and Alaska Native
Median resident age - Males - Multirace
Median resident age - Males - Other Race
Median resident age - Females - White
Median resident age - Females - Black or African American
Median resident age - Females - Asian
Median resident age - Females - Hispanic or Latino
Median resident age - Females - American Indian and Alaska Native
Median resident age - Females - Multirace
Median resident age - Females - Other Race
Commute - mean travel time to work (minutes)
Travel time to work - Less than 5 minutes (%)
Travel time to work - Less than 5 minutes (% change since 2000)
Travel time to work - 5 to 9 minutes (%)
Travel time to work - 5 to 9 minutes (% change since 2000)
Travel time to work - 10 to 19 minutes (%)
Travel time to work - 10 to 19 minutes (% change since 2000)
Travel time to work - 20 to 29 minutes (%)
Travel time to work - 20 to 29 minutes (% change since 2000)
Travel time to work - 30 to 39 minutes (%)
Travel time to work - 30 to 39 minutes (% change since 2000)
Travel time to work - 40 to 59 minutes (%)
Travel time to work - 40 to 59 minutes (% change since 2000)
Travel time to work - 60 to 89 minutes (%)
Travel time to work - 60 to 89 minutes (% change since 2000)
Travel time to work - 90 or more minutes (%)
Travel time to work - 90 or more minutes (% change since 2000)
Marital status - Never married (%)
Marital status - Now married (%)
Marital status - Separated (%)
Marital status - Widowed (%)
Marital status - Divorced (%)
Median family income ($)
Median family income (% change since 2000)
Median non-family income ($)
Median non-family income (% change since 2000)
Median per capita income ($)
Median per capita income (% change since 2000)
Median family income ($) - White
Median family income ($) - Black or African American
Median family income ($) - Asian
Median family income ($) - Hispanic or Latino
Median family income ($) - American Indian and Alaska Native
Median family income ($) - Multirace
Median family income ($) - Other Race
Median year house/condo built
Median year apartment built
Year house built - Built 2005 or later (%)
Year house built - Built 2000 to 2004 (%)
Year house built - Built 1990 to 1999 (%)
Year house built - Built 1980 to 1989 (%)
Year house built - Built 1970 to 1979 (%)
Year house built - Built 1960 to 1969 (%)
Year house built - Built 1950 to 1959 (%)
Year house built - Built 1940 to 1949 (%)
Year house built - Built 1939 or earlier (%)
Average household size
Household density (households per square mile)
Average household size - White
Average household size - Black or African American
Average household size - Asian
Average household size - Hispanic or Latino
Average household size - American Indian and Alaska Native
Average household size - Multirace
Average household size - Other Race
Occupied housing units (%)
Vacant housing units (%)
Owner occupied housing units (%)
Renter occupied housing units (%)
Vacancy status - For rent (%)
Vacancy status - For sale only (%)
Vacancy status - Rented or sold, not occupied (%)
Vacancy status - For seasonal, recreational, or occasional use (%)
Vacancy status - For migrant workers (%)
Vacancy status - Other vacant (%)
Residents with income below the poverty level (%)
Residents with income below 50% of the poverty level (%)
Children below poverty level (%)
Poor families by family type - Married-couple family (%)
Poor families by family type - Male, no wife present (%)
Poor families by family type - Female, no husband present (%)
Poverty status for native-born residents (%)
Poverty status for foreign-born residents (%)
Poverty among high school graduates not in families (%)
Poverty among people who did not graduate high school not in families (%)
Residents with income below the poverty level (%) - White
Residents with income below the poverty level (%) - Black or African American
Residents with income below the poverty level (%) - Asian
Residents with income below the poverty level (%) - Hispanic or Latino
Residents with income below the poverty level (%) - American Indian and Alaska Native
Residents with income below the poverty level (%) - Multirace
Residents with income below the poverty level (%) - Other Race
Air pollution - Air Quality Index (AQI)
Air pollution - CO
Air pollution - NO2
Air pollution - SO2
Air pollution - Ozone
Air pollution - PM10
Air pollution - PM25
Air pollution - Pb
Crime - Murders per 100,000 population
Crime - Rapes per 100,000 population
Crime - Robberies per 100,000 population
Crime - Assaults per 100,000 population
Crime - Burglaries per 100,000 population
Crime - Thefts per 100,000 population
Crime - Auto thefts per 100,000 population
Crime - Arson per 100,000 population
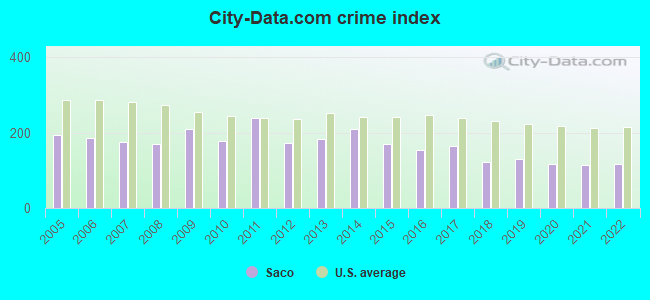
Crime - City-data.com crime index
Crime - Violent crime index
Crime - Property crime index
Crime - Murders per 100,000 population (5 year average)
Crime - Rapes per 100,000 population (5 year average)
Crime - Robberies per 100,000 population (5 year average)
Crime - Assaults per 100,000 population (5 year average)
Crime - Burglaries per 100,000 population (5 year average)
Crime - Thefts per 100,000 population (5 year average)
Crime - Auto thefts per 100,000 population (5 year average)
Crime - Arson per 100,000 population (5 year average)
Crime - City-data.com crime index (5 year average)
Crime - Violent crime index (5 year average)
Crime - Property crime index (5 year average)
1996 Presidential Elections Results (%) - Democratic Party (Clinton)
1996 Presidential Elections Results (%) - Republican Party (Dole)
1996 Presidential Elections Results (%) - Other
2000 Presidential Elections Results (%) - Democratic Party (Gore)
2000 Presidential Elections Results (%) - Republican Party (Bush)
2000 Presidential Elections Results (%) - Other
2004 Presidential Elections Results (%) - Democratic Party (Kerry)
2004 Presidential Elections Results (%) - Republican Party (Bush)
2004 Presidential Elections Results (%) - Other
2008 Presidential Elections Results (%) - Democratic Party (Obama)
2008 Presidential Elections Results (%) - Republican Party (McCain)
2008 Presidential Elections Results (%) - Other
2012 Presidential Elections Results (%) - Democratic Party (Obama)
2012 Presidential Elections Results (%) - Republican Party (Romney)
2012 Presidential Elections Results (%) - Other
2016 Presidential Elections Results (%) - Democratic Party (Clinton)
2016 Presidential Elections Results (%) - Republican Party (Trump)
2016 Presidential Elections Results (%) - Other
2020 Presidential Elections Results (%) - Democratic Party (Biden)
2020 Presidential Elections Results (%) - Republican Party (Trump)
2020 Presidential Elections Results (%) - Other
Ancestries Reported - Arab (%)
Ancestries Reported - Czech (%)
Ancestries Reported - Danish (%)
Ancestries Reported - Dutch (%)
Ancestries Reported - English (%)
Ancestries Reported - French (%)
Ancestries Reported - French Canadian (%)
Ancestries Reported - German (%)
Ancestries Reported - Greek (%)
Ancestries Reported - Hungarian (%)
Ancestries Reported - Irish (%)
Ancestries Reported - Italian (%)
Ancestries Reported - Lithuanian (%)
Ancestries Reported - Norwegian (%)
Ancestries Reported - Polish (%)
Ancestries Reported - Portuguese (%)
Ancestries Reported - Russian (%)
Ancestries Reported - Scotch-Irish (%)
Ancestries Reported - Scottish (%)
Ancestries Reported - Slovak (%)
Ancestries Reported - Subsaharan African (%)
Ancestries Reported - Swedish (%)
Ancestries Reported - Swiss (%)
Ancestries Reported - Ukrainian (%)
Ancestries Reported - United States (%)
Ancestries Reported - Welsh (%)
Ancestries Reported - West Indian (%)
Ancestries Reported - Other (%)
Educational Attainment - No schooling completed (%)
Educational Attainment - Less than high school (%)
Educational Attainment - High school or equivalent (%)
Educational Attainment - Less than 1 year of college (%)
Educational Attainment - 1 or more years of college (%)
Educational Attainment - Associate degree (%)
Educational Attainment - Bachelor's degree (%)
Educational Attainment - Master's degree (%)
Educational Attainment - Professional school degree (%)
Educational Attainment - Doctorate degree (%)
School Enrollment - Nursery, preschool (%)
School Enrollment - Kindergarten (%)
School Enrollment - Grade 1 to 4 (%)
School Enrollment - Grade 5 to 8 (%)
School Enrollment - Grade 9 to 12 (%)
School Enrollment - College undergrad (%)
School Enrollment - Graduate or professional (%)
School Enrollment - Not enrolled in school (%)
School enrollment - Public schools (%)
School enrollment - Private schools (%)
School enrollment - Not enrolled (%)
Median number of rooms in houses and condos
Median number of rooms in apartments
Housing units lacking complete plumbing facilities (%)
Housing units lacking complete kitchen facilities (%)
Density of houses
Urban houses (%)
Rural houses (%)
Households with people 60 years and over (%)
Households with people 65 years and over (%)
Households with people 75 years and over (%)
Households with one or more nonrelatives (%)
Households with no nonrelatives (%)
Population in households (%)
Family households (%)
Nonfamily households (%)
Population in families (%)
Family households with own children (%)
Median number of bedrooms in owner occupied houses
Mean number of bedrooms in owner occupied houses
Median number of bedrooms in renter occupied houses
Mean number of bedrooms in renter occupied houses
Median number of vehichles in owner occupied houses
Mean number of vehichles in owner occupied houses
Median number of vehichles in renter occupied houses
Mean number of vehichles in renter occupied houses
Mortgage status - with mortgage (%)
Mortgage status - with second mortgage (%)
Mortgage status - with home equity loan (%)
Mortgage status - with both second mortgage and home equity loan (%)
Mortgage status - without a mortgage (%)
Average family size
Average family size - White
Average family size - Black or African American
Average family size - Asian
Average family size - Hispanic or Latino
Average family size - American Indian and Alaska Native
Average family size - Multirace
Average family size - Other Race
Geographical mobility - Same house 1 year ago (%)
Geographical mobility - Moved within same county (%)
Geographical mobility - Moved from different county within same state (%)
Geographical mobility - Moved from different state (%)
Geographical mobility - Moved from abroad (%)
Place of birth - Born in state of residence (%)
Place of birth - Born in other state (%)
Place of birth - Native, outside of US (%)
Place of birth - Foreign born (%)
Housing units in structures - 1, detached (%)
Housing units in structures - 1, attached (%)
Housing units in structures - 2 (%)
Housing units in structures - 3 or 4 (%)
Housing units in structures - 5 to 9 (%)
Housing units in structures - 10 to 19 (%)
Housing units in structures - 20 to 49 (%)
Housing units in structures - 50 or more (%)
Housing units in structures - Mobile home (%)
Housing units in structures - Boat, RV, van, etc. (%)
House/condo owner moved in on average (years ago)
Renter moved in on average (years ago)
Year householder moved into unit - Moved in 1999 to March 2000 (%)
Year householder moved into unit - Moved in 1995 to 1998 (%)
Year householder moved into unit - Moved in 1990 to 1994 (%)
Year householder moved into unit - Moved in 1980 to 1989 (%)
Year householder moved into unit - Moved in 1970 to 1979 (%)
Year householder moved into unit - Moved in 1969 or earlier (%)
Means of transportation to work - Drove car alone (%)
Means of transportation to work - Carpooled (%)
Means of transportation to work - Public transportation (%)
Means of transportation to work - Bus or trolley bus (%)
Means of transportation to work - Streetcar or trolley car (%)
Means of transportation to work - Subway or elevated (%)
Means of transportation to work - Railroad (%)
Means of transportation to work - Ferryboat (%)
Means of transportation to work - Taxicab (%)
Means of transportation to work - Motorcycle (%)
Means of transportation to work - Bicycle (%)
Means of transportation to work - Walked (%)
Means of transportation to work - Other means (%)
Working at home (%)
Industry diversity
Most Common Industries - Agriculture, forestry, fishing and hunting, and mining (%)
Most Common Industries - Agriculture, forestry, fishing and hunting (%)
Most Common Industries - Mining, quarrying, and oil and gas extraction (%)
Most Common Industries - Construction (%)
Most Common Industries - Manufacturing (%)
Most Common Industries - Wholesale trade (%)
Most Common Industries - Retail trade (%)
Most Common Industries - Transportation and warehousing, and utilities (%)
Most Common Industries - Transportation and warehousing (%)
Most Common Industries - Utilities (%)
Most Common Industries - Information (%)
Most Common Industries - Finance and insurance, and real estate and rental and leasing (%)
Most Common Industries - Finance and insurance (%)
Most Common Industries - Real estate and rental and leasing (%)
Most Common Industries - Professional, scientific, and management, and administrative and waste management services (%)
Most Common Industries - Professional, scientific, and technical services (%)
Most Common Industries - Management of companies and enterprises (%)
Most Common Industries - Administrative and support and waste management services (%)
Most Common Industries - Educational services, and health care and social assistance (%)
Most Common Industries - Educational services (%)
Most Common Industries - Health care and social assistance (%)
Most Common Industries - Arts, entertainment, and recreation, and accommodation and food services (%)
Most Common Industries - Arts, entertainment, and recreation (%)
Most Common Industries - Accommodation and food services (%)
Most Common Industries - Other services, except public administration (%)
Most Common Industries - Public administration (%)
Occupation diversity
Most Common Occupations - Management, business, science, and arts occupations (%)
Most Common Occupations - Management, business, and financial occupations (%)
Most Common Occupations - Management occupations (%)
Most Common Occupations - Business and financial operations occupations (%)
Most Common Occupations - Computer, engineering, and science occupations (%)
Most Common Occupations - Computer and mathematical occupations (%)
Most Common Occupations - Architecture and engineering occupations (%)
Most Common Occupations - Life, physical, and social science occupations (%)
Most Common Occupations - Education, legal, community service, arts, and media occupations (%)
Most Common Occupations - Community and social service occupations (%)
Most Common Occupations - Legal occupations (%)
Most Common Occupations - Education, training, and library occupations (%)
Most Common Occupations - Arts, design, entertainment, sports, and media occupations (%)
Most Common Occupations - Healthcare practitioners and technical occupations (%)
Most Common Occupations - Health diagnosing and treating practitioners and other technical occupations (%)
Most Common Occupations - Health technologists and technicians (%)
Most Common Occupations - Service occupations (%)
Most Common Occupations - Healthcare support occupations (%)
Most Common Occupations - Protective service occupations (%)
Most Common Occupations - Fire fighting and prevention, and other protective service workers including supervisors (%)
Most Common Occupations - Law enforcement workers including supervisors (%)
Most Common Occupations - Food preparation and serving related occupations (%)
Most Common Occupations - Building and grounds cleaning and maintenance occupations (%)
Most Common Occupations - Personal care and service occupations (%)
Most Common Occupations - Sales and office occupations (%)
Most Common Occupations - Sales and related occupations (%)
Most Common Occupations - Office and administrative support occupations (%)
Most Common Occupations - Natural resources, construction, and maintenance occupations (%)
Most Common Occupations - Farming, fishing, and forestry occupations (%)
Most Common Occupations - Construction and extraction occupations (%)
Most Common Occupations - Installation, maintenance, and repair occupations (%)
Most Common Occupations - Production, transportation, and material moving occupations (%)
Most Common Occupations - Production occupations (%)
Most Common Occupations - Transportation occupations (%)
Most Common Occupations - Material moving occupations (%)
People in Group quarters - Institutionalized population (%)
People in Group quarters - Correctional institutions (%)
People in Group quarters - Federal prisons and detention centers (%)
People in Group quarters - Halfway houses (%)
People in Group quarters - Local jails and other confinement facilities (including police lockups) (%)
People in Group quarters - Military disciplinary barracks (%)
People in Group quarters - State prisons (%)
People in Group quarters - Other types of correctional institutions (%)
People in Group quarters - Nursing homes (%)
People in Group quarters - Hospitals/wards, hospices, and schools for the handicapped (%)
People in Group quarters - Hospitals/wards and hospices for chronically ill (%)
People in Group quarters - Hospices or homes for chronically ill (%)
People in Group quarters - Military hospitals or wards for chronically ill (%)
People in Group quarters - Other hospitals or wards for chronically ill (%)
People in Group quarters - Hospitals or wards for drug/alcohol abuse (%)
People in Group quarters - Mental (Psychiatric) hospitals or wards (%)
People in Group quarters - Schools, hospitals, or wards for the mentally retarded (%)
People in Group quarters - Schools, hospitals, or wards for the physically handicapped (%)
People in Group quarters - Institutions for the deaf (%)
People in Group quarters - Institutions for the blind (%)
People in Group quarters - Orthopedic wards and institutions for the physically handicapped (%)
People in Group quarters - Wards in general hospitals for patients who have no usual home elsewhere (%)
People in Group quarters - Wards in military hospitals for patients who have no usual home elsewhere (%)
People in Group quarters - Juvenile institutions (%)
People in Group quarters - Long-term care (%)
People in Group quarters - Homes for abused, dependent, and neglected children (%)
People in Group quarters - Residential treatment centers for emotionally disturbed children (%)
People in Group quarters - Training schools for juvenile delinquents (%)
People in Group quarters - Short-term care, detention or diagnostic centers for delinquent children (%)
People in Group quarters - Type of juvenile institution unknown (%)
People in Group quarters - Noninstitutionalized population (%)
People in Group quarters - College dormitories (includes college quarters off campus) (%)
People in Group quarters - Military quarters (%)
People in Group quarters - On base (%)
People in Group quarters - Barracks, unaccompanied personnel housing (UPH), (Enlisted/Officer), ;and similar group living quarters for military personnel (%)
People in Group quarters - Transient quarters for temporary residents (%)
People in Group quarters - Military ships (%)
People in Group quarters - Group homes (%)
People in Group quarters - Homes or halfway houses for drug/alcohol abuse (%)
People in Group quarters - Homes for the mentally ill (%)
People in Group quarters - Homes for the mentally retarded (%)
People in Group quarters - Homes for the physically handicapped (%)
People in Group quarters - Other group homes (%)
People in Group quarters - Religious group quarters (%)
People in Group quarters - Dormitories (%)
People in Group quarters - Agriculture workers' dormitories on farms (%)
People in Group quarters - Job Corps and vocational training facilities (%)
People in Group quarters - Other workers' dormitories (%)
People in Group quarters - Crews of maritime vessels (%)
People in Group quarters - Other nonhousehold living situations (%)
People in Group quarters - Other noninstitutional group quarters (%)
Residents speaking English at home (%)
Residents speaking English at home - Born in the United States (%)
Residents speaking English at home - Native, born elsewhere (%)
Residents speaking English at home - Foreign born (%)
Residents speaking Spanish at home (%)
Residents speaking Spanish at home - Born in the United States (%)
Residents speaking Spanish at home - Native, born elsewhere (%)
Residents speaking Spanish at home - Foreign born (%)
Residents speaking other language at home (%)
Residents speaking other language at home - Born in the United States (%)
Residents speaking other language at home - Native, born elsewhere (%)
Residents speaking other language at home - Foreign born (%)
Class of Workers - Employee of private company (%)
Class of Workers - Self-employed in own incorporated business (%)
Class of Workers - Private not-for-profit wage and salary workers (%)
Class of Workers - Local government workers (%)
Class of Workers - State government workers (%)
Class of Workers - Federal government workers (%)
Class of Workers - Self-employed workers in own not incorporated business and Unpaid family workers (%)
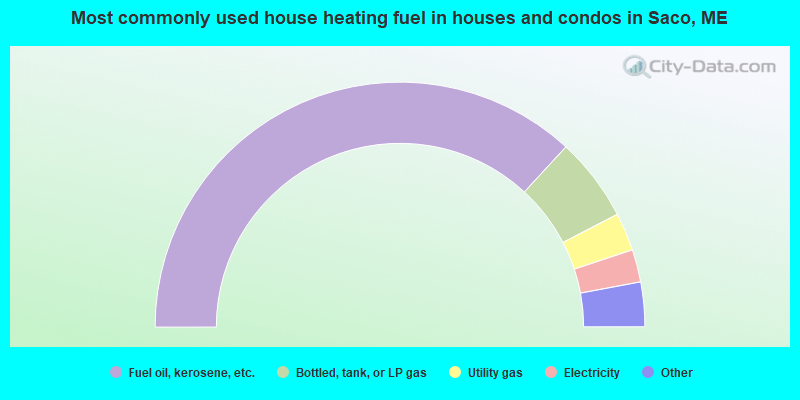
House heating fuel used in houses and condos - Utility gas (%)
House heating fuel used in houses and condos - Bottled, tank, or LP gas (%)
House heating fuel used in houses and condos - Electricity (%)
House heating fuel used in houses and condos - Fuel oil, kerosene, etc. (%)
House heating fuel used in houses and condos - Coal or coke (%)
House heating fuel used in houses and condos - Wood (%)
House heating fuel used in houses and condos - Solar energy (%)
House heating fuel used in houses and condos - Other fuel (%)
House heating fuel used in houses and condos - No fuel used (%)
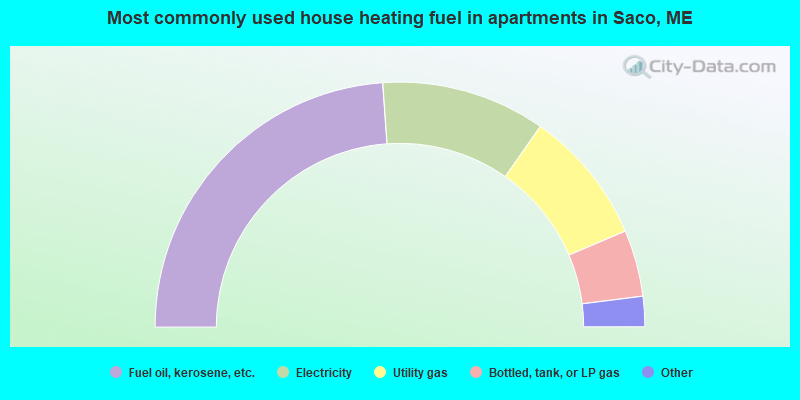
House heating fuel used in apartments - Utility gas (%)
House heating fuel used in apartments - Bottled, tank, or LP gas (%)
House heating fuel used in apartments - Electricity (%)
House heating fuel used in apartments - Fuel oil, kerosene, etc. (%)
House heating fuel used in apartments - Coal or coke (%)
House heating fuel used in apartments - Wood (%)
House heating fuel used in apartments - Solar energy (%)
House heating fuel used in apartments - Other fuel (%)
House heating fuel used in apartments - No fuel used (%)
Armed forces status - In Armed Forces (%)
Armed forces status - Civilian (%)
Armed forces status - Civilian - Veteran (%)
Armed forces status - Civilian - Nonveteran (%)
Fatal accidents locations in years 2005-2021
Fatal accidents locations in 2005
Fatal accidents locations in 2006
Fatal accidents locations in 2007
Fatal accidents locations in 2008
Fatal accidents locations in 2009
Fatal accidents locations in 2010
Fatal accidents locations in 2011
Fatal accidents locations in 2012
Fatal accidents locations in 2013
Fatal accidents locations in 2014
Fatal accidents locations in 2015
Fatal accidents locations in 2016
Fatal accidents locations in 2017
Fatal accidents locations in 2018
Fatal accidents locations in 2019
Fatal accidents locations in 2020
Fatal accidents locations in 2021
Alcohol use - People drinking some alcohol every month (%)
Alcohol use - People not drinking at all (%)
Alcohol use - Average days/month drinking alcohol
Alcohol use - Average drinks/week
Alcohol use - Average days/year people drink much
Audiometry - Average condition of hearing (%)
Audiometry - People that can hear a whisper from across a quiet room (%)
Audiometry - People that can hear normal voice from across a quiet room (%)
Audiometry - Ears ringing, roaring, buzzing (%)
Audiometry - Had a job exposure to loud noise (%)
Audiometry - Had off-work exposure to loud noise (%)
Blood Pressure & Cholesterol - Has high blood pressure (%)
Blood Pressure & Cholesterol - Checking blood pressure at home (%)
Blood Pressure & Cholesterol - Frequently checking blood cholesterol (%)
Blood Pressure & Cholesterol - Has high cholesterol level (%)
Consumer Behavior - Money monthly spent on food at supermarket/grocery store
Consumer Behavior - Money monthly spent on food at other stores
Consumer Behavior - Money monthly spent on eating out
Consumer Behavior - Money monthly spent on carryout/delivered foods
Consumer Behavior - Income spent on food at supermarket/grocery store (%)
Consumer Behavior - Income spent on food at other stores (%)
Consumer Behavior - Income spent on eating out (%)
Consumer Behavior - Income spent on carryout/delivered foods (%)
Current Health Status - General health condition (%)
Current Health Status - Blood donors (%)
Current Health Status - Has blood ever tested for HIV virus (%)
Current Health Status - Left-handed people (%)
Dermatology - People using sunscreen (%)
Diabetes - Diabetics (%)
Diabetes - Had a blood test for high blood sugar (%)
Diabetes - People taking insulin (%)
Diet Behavior & Nutrition - Diet health (%)
Diet Behavior & Nutrition - Milk product consumption (# of products/month)
Diet Behavior & Nutrition - Meals not home prepared (#/week)
Diet Behavior & Nutrition - Meals from fast food or pizza place (#/week)
Diet Behavior & Nutrition - Ready-to-eat foods (#/month)
Diet Behavior & Nutrition - Frozen meals/pizza (#/month)
Drug Use - People that ever used marijuana or hashish (%)
Drug Use - Ever used hard drugs (%)
Drug Use - Ever used any form of cocaine (%)
Drug Use - Ever used heroin (%)
Drug Use - Ever used methamphetamine (%)
Health Insurance - People covered by health insurance (%)
Kidney Conditions-Urology - Avg. # of times urinating at night
Medical Conditions - People with asthma (%)
Medical Conditions - People with anemia (%)
Medical Conditions - People with psoriasis (%)
Medical Conditions - People with overweight (%)
Medical Conditions - Elderly people having difficulties in thinking or remembering (%)
Medical Conditions - People who ever received blood transfusion (%)
Medical Conditions - People having trouble seeing even with glass/contacts (%)
Medical Conditions - People with arthritis (%)
Medical Conditions - People with gout (%)
Medical Conditions - People with congestive heart failure (%)
Medical Conditions - People with coronary heart disease (%)
Medical Conditions - People with angina pectoris (%)
Medical Conditions - People who ever had heart attack (%)
Medical Conditions - People who ever had stroke (%)
Medical Conditions - People with emphysema (%)
Medical Conditions - People with thyroid problem (%)
Medical Conditions - People with chronic bronchitis (%)
Medical Conditions - People with any liver condition (%)
Medical Conditions - People who ever had cancer or malignancy (%)
Mental Health - People who have little interest in doing things (%)
Mental Health - People feeling down, depressed, or hopeless (%)
Mental Health - People who have trouble sleeping or sleeping too much (%)
Mental Health - People feeling tired or having little energy (%)
Mental Health - People with poor appetite or overeating (%)
Mental Health - People feeling bad about themself (%)
Mental Health - People who have trouble concentrating on things (%)
Mental Health - People moving or speaking slowly or too fast (%)
Mental Health - People having thoughts they would be better off dead (%)
Oral Health - Average years since last visit a dentist
Oral Health - People embarrassed because of mouth (%)
Oral Health - People with gum disease (%)
Oral Health - General health of teeth and gums (%)
Oral Health - Average days a week using dental floss/device
Oral Health - Average days a week using mouthwash for dental problem
Oral Health - Average number of teeth
Pesticide Use - Households using pesticides to control insects (%)
Pesticide Use - Households using pesticides to kill weeds (%)
Physical Activity - People doing vigorous-intensity work activities (%)
Physical Activity - People doing moderate-intensity work activities (%)
Physical Activity - People walking or bicycling (%)
Physical Activity - People doing vigorous-intensity recreational activities (%)
Physical Activity - People doing moderate-intensity recreational activities (%)
Physical Activity - Average hours a day doing sedentary activities
Physical Activity - Average hours a day watching TV or videos
Physical Activity - Average hours a day using computer
Physical Functioning - People having limitations keeping them from working (%)
Physical Functioning - People limited in amount of work they can do (%)
Physical Functioning - People that need special equipment to walk (%)
Physical Functioning - People experiencing confusion/memory problems (%)
Physical Functioning - People requiring special healthcare equipment (%)
Prescription Medications - Average number of prescription medicines taking
Preventive Aspirin Use - Adults 40+ taking low-dose aspirin (%)
Reproductive Health - Vaginal deliveries (%)
Reproductive Health - Cesarean deliveries (%)
Reproductive Health - Deliveries resulted in a live birth (%)
Reproductive Health - Pregnancies resulted in a delivery (%)
Reproductive Health - Women breastfeeding newborns (%)
Reproductive Health - Women that had a hysterectomy (%)
Reproductive Health - Women that had both ovaries removed (%)
Reproductive Health - Women that have ever taken birth control pills (%)
Reproductive Health - Women taking birth control pills (%)
Reproductive Health - Women that have ever used Depo-Provera or injectables (%)
Reproductive Health - Women that have ever used female hormones (%)
Sexual Behavior - People 18+ that ever had sex (vaginal, anal, or oral) (%)
Sexual Behavior - Males 18+ that ever had vaginal sex with a woman (%)
Sexual Behavior - Males 18+ that ever performed oral sex on a woman (%)
Sexual Behavior - Males 18+ that ever had anal sex with a woman (%)
Sexual Behavior - Males 18+ that ever had any sex with a man (%)
Sexual Behavior - Females 18+ that ever had vaginal sex with a man (%)
Sexual Behavior - Females 18+ that ever performed oral sex on a man (%)
Sexual Behavior - Females 18+ that ever had anal sex with a man (%)
Sexual Behavior - Females 18+ that ever had any kind of sex with a woman (%)
Sexual Behavior - Average age people first had sex
Sexual Behavior - Average number of female sex partners in lifetime (males 18+)
Sexual Behavior - Average number of female vaginal sex partners in lifetime (males 18+)
Sexual Behavior - Average age people first performed oral sex on a woman (18+)
Sexual Behavior - Average number of woman performed oral sex on in lifetime (18+)
Sexual Behavior - Average number of male sex partners in lifetime (males 18+)
Sexual Behavior - Average number of male anal sex partners in lifetime (males 18+)
Sexual Behavior - Average age people first performed oral sex on a man (18+)
Sexual Behavior - Average number of male oral sex partners in lifetime (18+)
Sexual Behavior - People using protection when performing oral sex (%)
Sexual Behavior - Average number of times people have vaginal or anal sex a year
Sexual Behavior - People having sex without condom (%)
Sexual Behavior - Average number of male sex partners in lifetime (females 18+)
Sexual Behavior - Average number of male vaginal sex partners in lifetime (females 18+)
Sexual Behavior - Average number of female sex partners in lifetime (females 18+)
Sexual Behavior - Circumcised males 18+ (%)
Sleep Disorders - Average hours sleeping at night
Sleep Disorders - People that has trouble sleeping (%)
Smoking-Cigarette Use - People smoking cigarettes (%)
Taste & Smell - People 40+ having problems with smell (%)
Taste & Smell - People 40+ having problems with taste (%)
Taste & Smell - People 40+ that ever had wisdom teeth removed (%)
Taste & Smell - People 40+ that ever had tonsils teeth removed (%)
Taste & Smell - People 40+ that ever had a loss of consciousness because of a head injury (%)
Taste & Smell - People 40+ that ever had a broken nose or other serious injury to face or skull (%)
Taste & Smell - People 40+ that ever had two or more sinus infections (%)
Weight - Average height (inches)
Weight - Average weight (pounds)
Weight - Average BMI
Weight - People that are obese (%)
Weight - People that ever were obese (%)
Weight - People trying to lose weight (%)
According to our research of Maine and other state lists, there were 23 registered sex offenders living in Saco, Maine as of April 27, 2024 . The ratio of all residents to sex offenders in Saco is 827 to 1.The ratio of registered sex offenders to all residents in this city is lower than the state average.
Officers per 1,000 residents here:
1.63Maine average:
1.71
Latest news from Saco, ME collected exclusively by city-data.com from local newspapers, TV, and radio stations
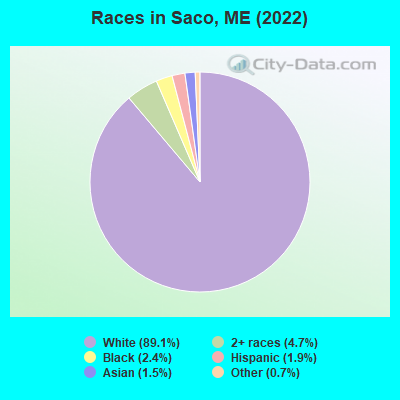
Ancestries: English (16.0%), French Canadian (13.5%), Irish (11.7%), French (8.0%), American (5.1%), Afghan (4.3%).
Current Local Time:
Land area: 38.5 square miles.
Population density: 542 people per square mile (low).
1,465 residents are foreign born (2.5% Asia , 1.6% Europe , 1.1% Africa , 1.1% Latin America ).
Median real estate property taxes paid for housing units with mortgages in 2022: $4,682 (1.1%)Median real estate property taxes paid for housing units with no mortgage in 2022: $4,549 (1.2%)
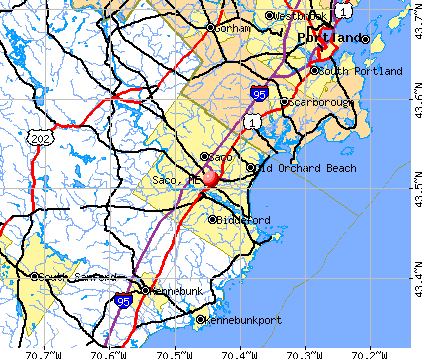
Nearest city with pop. 50,000+: Portland, ME
Nearest city with pop. 200,000+: Boston, MA
Nearest city with pop. 1,000,000+: Bronx, NY
Nearest cities:
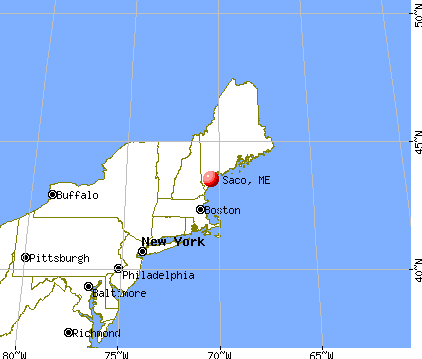
Latitude: 43.51 N, Longitude: 70.44 W
Daytime population change due to commuting: -2,753 (-13.2%)Workers who live and work in this city: 3,812 (31.5%)
Area code commonly used in this area: 207
Saco tourist attractions:
Single-family new house construction building permits:
2022: 66 buildings , average cost: $214,1002021: 76 buildings , average cost: $213,6002020: 63 buildings , average cost: $215,8002019: 57 buildings , average cost: $206,0002018: 87 buildings , average cost: $201,1002017: 69 buildings , average cost: $219,5002016: 63 buildings , average cost: $227,7002015: 55 buildings , average cost: $212,8002014: 50 buildings , average cost: $176,6002013: 62 buildings , average cost: $179,4002012: 51 buildings , average cost: $176,2002011: 38 buildings , average cost: $161,3002010: 49 buildings , average cost: $168,8002009: 51 buildings , average cost: $165,2002008: 32 buildings , average cost: $173,3002007: 64 buildings , average cost: $161,8002006: 86 buildings , average cost: $157,4002005: 130 buildings , average cost: $224,8002004: 135 buildings , average cost: $109,5002003: 96 buildings , average cost: $128,1002002: 112 buildings , average cost: $146,4002001: 113 buildings , average cost: $119,2002000: 103 buildings , average cost: $131,2001999: 94 buildings , average cost: $114,3001998: 130 buildings , average cost: $111,5001997: 76 buildings , average cost: $94,900Unemployment in December 2023:
Population change in the 1990s: +1,625 (+10.7%).
Most common occupations in Saco, ME (%)
Both Males Females
Other sales and related occupations, including supervisors (5.0%)
Other office and administrative support workers, including supervisors (4.6%)
Secretaries and administrative assistants (3.7%)
Other management occupations, except farmers and farm managers (3.6%)
Building and grounds cleaning and maintenance occupations (3.2%)
Other production occupations, including supervisors (3.0%)
Cashiers (2.9%)
Other sales and related occupations, including supervisors (5.6%)
Electrical equipment mechanics and other installation, maintenance, and repair workers, including supervisors (5.4%)
Driver/sales workers and truck drivers (4.9%)
Other management occupations, except farmers and farm managers (4.8%)
Metal workers and plastic workers (3.8%)
Other production occupations, including supervisors (3.8%)
Material recording, scheduling, dispatching, and distributing workers (3.4%)
Other office and administrative support workers, including supervisors (8.2%)
Secretaries and administrative assistants (7.2%)
Other sales and related occupations, including supervisors (4.5%)
Preschool, kindergarten, elementary, and middle school teachers (4.2%)
Registered nurses (4.0%)
Cashiers (3.5%)
Bookkeeping, accounting, and auditing clerks (3.2%)
Tornado activity:
Saco-area historical tornado activity is above Maine state average. It is 74% smaller than the overall U.S. average.
On 10/10/1966, a category F2 (max. wind speeds 113-157 mph) tornado 17.7 miles away from the Saco city center caused between $5000 and $50,000 in damages.
On 6/9/1953, a category F3 (max. wind speeds 158-206 mph) tornado 45.8 miles away from the city center injured 5 people and caused between $5000 and $50,000 in damages.
Earthquake activity:
Saco-area historical earthquake activity is significantly above Maine state average. It is 74% smaller than the overall U.S. average. On 10/16/2012 at 23:12:25, a magnitude 4.7 (4.7 ML, Depth: 10.0 mi, Class: Light, Intensity: IV - V) earthquake occurred 12.2 miles away from Saco center On 4/20/2002 at 10:50:47, a magnitude 5.3 (5.3 ML, Depth: 3.0 mi, Class: Moderate, Intensity: VI - VII) earthquake occurred 176.0 miles away from the city center On 1/19/1982 at 00:14:42, a magnitude 4.7 (4.5 MB, 4.7 MD, 4.5 LG) earthquake occurred 58.0 miles away from the city center On 4/20/2002 at 10:50:47, a magnitude 5.2 (5.2 MB, 4.2 MS, 5.2 MW, 5.0 MW) earthquake occurred 176.3 miles away from Saco center On 10/7/1983 at 10:18:46, a magnitude 5.3 (5.1 MB, 5.3 LG, 5.1 ML) earthquake occurred 197.1 miles away from the city center On 8/21/1996 at 07:54:14, a magnitude 3.8 (3.8 LG, 3.6 LG, Depth: 6.2 mi, Class: Light, Intensity: II - III) earthquake occurred 64.9 miles away from Saco center Magnitude types: regional Lg-wave magnitude (LG), body-wave magnitude (MB), duration magnitude (MD), local magnitude (ML), surface-wave magnitude (MS), moment magnitude (MW) Natural disasters: The number of natural disasters in York County (31) is a lot greater than the US average (15).Major Disasters (Presidential) Declared: 23Emergencies Declared: 8Floods: 21, Storms: 16, Winter Storms: 6, Snows: 5, Winds: 3, Heavy Rains: 2, Hurricanes: 2, Blizzard: 1, Ice Storm: 1, Mudslide: 1, Snowfall: 1, Snowstorm: 1, Tornado: 1, Tropical Storm: 1 (Note: some incidents may be assigned to more than one category). Hospitals and medical centers in Saco: ABLE TO STAY HOME CARE (209 MAIN STREET)
HOME HEALTH-VISITING NURSES OF SOUTHERN MAINE (15 INDUSTRIAL PARK ROAD)
BEANE NURSING HOME (15 NOTT ST)
EVERGREEN MANOR (328 NORTH ST)
SEAL ROCK HEALTH CARE (88 HARBOR DRIVE)
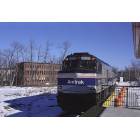
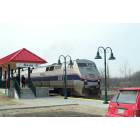
Airports located in Saco: Amtrak station: SACO (130 MAIN ST.)
.
Services: ticket office.
Colleges/universities with over 2000 students nearest to Saco:
University of New England (about 5 miles; Biddeford, ME ; Full-time enrollment: 4,539)
University of Southern Maine (about 14 miles; Portland, ME ; FT enrollment: 6,647)
Southern Maine Community College (about 15 miles; South Portland, ME ; FT enrollment: 4,666)
Saint Joseph's College of Maine (about 22 miles; Standish, ME ; FT enrollment: 2,010)
University of New Hampshire-Main Campus (about 36 miles; Durham, NH ; FT enrollment: 15,243)
Northern Essex Community College (about 59 miles; Haverhill, MA ; FT enrollment: 4,737)
NHTI-Concord's Community College (about 59 miles; Concord, NH ; FT enrollment: 2,865)
Private high schools in Saco: THORNTON ACADEMY Students: 1,525, Location: 438 MAIN ST, Grades: 6-12)
THE SCHOOL AT SWEETSER Students: 61, Location: 50 MOODY ST, Grades: 1-12)
Public elementary/middle schools in Saco:
Private elementary/middle school in Saco: FLORENCE LOMBARD CHRISTIAN SCHOOL Students: 6, Location: 46 CLEVELAND ST, Grades: 1-7)
See full list of schools located in Saco Library in Saco: DYER LIBRARY Operating income: $446,835; Location: 371 MAIN STREET; 46,066 books ; 1,514 audio materials ; 2,947 video materials ; 52 other licensed databases ; 76 print serial subscriptions )
User-submitted facts and corrections:
Professional wrestler Stanislaus Zbyszko held the world heavyweight wrestling championship twice in the 1920's. By the late 20's, early 30's he had retired to his farm in Old Orchard, Maine, where he lived with his brother, Wladek, who was also a wrestler. By the 1950's they had moved to Savannah, Missouri, where they lived for the rest of their lives. Stan died in St. Joseph, Missouri in 1967. After his funeral his remains were brought to Saco and buried in the family in Laurel Hill Cemetery, with his wife, Anne. Brother Wladek died the following year and was buried in Savannah, Missouri. If anybody has any information on the Zbyszko property or has a photo of the grave, please write me. My e - mail address is burbank3000 at aol.com. My name is Bob. Thank you Bob Siler
Private/Primary Middle school in Saco Notre Dame de Lourdes School can you add our website: www.notredameschoolsaco.org
Notable locations in Saco: (A) , Saco Fire Department Camp Ellis Station (B) , Saco Police Department (C) , Dyer Library (D) , Saco Fire Department North Saco Station (E) , York Institute Museum (F) , Saco Fire Department Central Station (G) , Maine Aquarium (H) . Display/hide their locations on the map
Shopping Center: (1) . Display/hide its location on the map
Churches in Saco include: (A) , Heath Church (B) , Notre Dame Church (C) , Seventh Day Adventist Church (D) , Unitarian Universalist Church (E) , United Methodist Church (F) , First Parish Congregational Church (G) , Bible Baptist Church (H) . Display/hide their locations on the map
Cemeteries: (1) , Laurel Hill Cemetery (2) . Display/hide their locations on the map
Lakes, reservoirs, and swamps: (A) , Short Pond (B) , Saco River Reservoir (C) , The Heath (D) . Display/hide their locations on the map
Streams, rivers, and creeks: (A) , Innis Brook (B) , Skilly Brook (C) , Sandy Brook (D) , Ricker Brook (E) , Grant Brook (F) , Harmon Brook (G) , Dennett Brook (H) , Deep Brook (I) . Display/hide their locations on the map
Parks in Saco include: (1) , Cascade Water and Amusement Park (2) , Aquaboggan Park (3) , Pepperell Park (4) , Ferry Beach State Park (5) . Display/hide their locations on the map
Tourist attractions: (1) , The Hough Group (Tourism Consultants; 51 Oceanside Drive) (2) , Funtown Splashtown USA (Amusement & Theme Parks; 774 Portland Rd) (3) , Travel Wise Cruises & Tours (Tours & Charters; 190 Main Street) (4) . Display/hide their approximate locations on the map
Hotels: (1) , Classic Motel (21 Ocean Park Road) (2) , Saco Motel (473 Main Street) (3) , Cozy Haven (815 Portland Rd) (4) , Exit 5 Motel & Cottages (18 Ocean Pk Rd) (5) , Eastview Motel (924 Portland Road) (6) , Rodeway Inn Saco (21 Ocean Park Road) (7) , Lord's Motel (720 Portland Road) (8) , Hilltop Motor Inn (644 Portland Road) (9) . Display/hide their approximate locations on the map
Birthplace of: Edith Nourse Rogers - Politician, John Wingate Thornton - Lawyer, Samuel Brannan - Politician, Arthur P. Fairfield - Navy admiral, George Foster Shepley (Maine and Louisiana) - Union Army general, Slugger Labbe - NASCAR crew chief, Daniel Milliken - Union Navy Medal of Honor recipient, John Fairfield - Politician, Henry A. Barrows - Actor, Isaac Lawrence Milliken - Politician.
York County has a predicted average indoor radon screening level greater than 4 pCi/L (pico curies per liter) - Highest Potential Drinking water stations with addresses in Saco and their reported violations in the past:
MT ABRAM CHALET ASSOCIATION (Population served: 170, Groundwater):
Past monitoring violations:
Monitoring and Reporting (DBP) - Between JAN-2011 and DEC-2013, Contaminant: Total Haloacetic Acids (HAA5). Follow-up actions: St Public Notif requested (DEC-26-2012), St Formal NOV issued (DEC-26-2012), St Public Notif received (JAN-14-2013), St Compliance achieved (AUG-05-2013)
Monitoring and Reporting (DBP) - Between JAN-2011 and DEC-2013, Contaminant: TTHM. Follow-up actions: St Public Notif requested (DEC-26-2012), St Formal NOV issued (DEC-26-2012), St Public Notif received (JAN-14-2013), St Compliance achieved (AUG-05-2013)
Monitoring and Reporting (DBP) - Between JAN-2008 and DEC-2010, Contaminant: Total Haloacetic Acids (HAA5). Follow-up actions: St Public Notif requested (DEC-08-2010), St Formal NOV issued (DEC-08-2010), St Public Notif received (2 times from NOV-01-2011 to NOV-02-2011), St Compliance achieved (AUG-05-2013)
Monitoring and Reporting (DBP) - Between JAN-2008 and DEC-2010, Contaminant: TTHM. Follow-up actions: St Public Notif requested (DEC-08-2010), St Formal NOV issued (DEC-08-2010), St Public Notif received (2 times from NOV-01-2011 to NOV-02-2011), St Compliance achieved (AUG-05-2013)
Initial Tap Sampling for Pb and Cu - In JUL-11-2004, Contaminant: Lead and Copper Rule. Follow-up actions: St Public Notif requested (FEB-23-2005), St Violation/Reminder Notice (FEB-23-2005), St Public Notif received (JUL-31-2005), St Compliance achieved (OCT-18-2005)
2 routine major monitoring violations
Population served: 25, Groundwater):
Past health violations:
MCL, Monthly (TCR) - Between JUL-2008 and SEP-2008, Contaminant: Coliform. Follow-up actions: St Public Notif requested (AUG-13-2008), St Formal NOV issued (AUG-13-2008), St Public Notif received (AUG-21-2008), St Intentional no-action (SEP-09-2011), St Compliance achieved (SEP-09-2011)
Average household size: This city:
2.4 peopleMaine:
2.3 people
Percentage of family households: This city:
64.6%Whole state:
62.9%
Percentage of households with unmarried partners: This city:
9.4%Whole state:
9.4%
Likely homosexual households (counted as self-reported same-sex unmarried-partner households)
Lesbian couples: 0.6% of all households Gay men: 0.4% of all households
People in group quarters in Saco in 2010:
211 people in nursing facilities/skilled-nursing facilities
53 people in residential treatment centers for juveniles (non-correctional)
37 people in college/university student housing
19 people in group homes intended for adults
19 people in other noninstitutional facilities
9 people in residential treatment centers for adults
5 people in emergency and transitional shelters (with sleeping facilities) for people experiencing homelessness
People in group quarters in Saco in 2000:
65 people in other noninstitutional group quarters
62 people in nursing homes
47 people in homes for abused, dependent, and neglected children
41 people in religious group quarters
12 people in other nonhousehold living situations
8 people in homes for the mentally retarded
6 people in homes for the mentally ill
Banks with branches in Saco (2011 data):
The Bank of Maine: Saco Branch at 640 Main Street, branch established on 2006/08/16. Info updated 2011/10/17: Bank assets: $783.5 mil, Deposits: $655.7 mil, headquarters in Portland, ME, negative income in the last year , Commercial Lending Specialization, 33 total offices
KeyBank National Association: Saco Branch at 2 Scammon Street, branch established on 1959/11/02. Info updated 2008/03/03: Bank assets: $86,198.8 mil, Deposits: $64,214.8 mil, headquarters in Cleveland, OH, positive income , Commercial Lending Specialization, 1067 total offices , Holding Company: Keycorp
Saco & Biddeford Savings Institution: at 252 Main Street, branch established on 1827/02/21. Info updated 2009/03/09: Bank assets: $759.8 mil, Deposits: $521.1 mil, local headquarters , positive income , Mortgage Lending Specialization, 6 total offices
Norway Savings Bank: Saco Branch at 569 Main Street, branch established on 1973/07/09. Info updated 2006/11/03: Bank assets: $958.8 mil, Deposits: $711.3 mil, headquarters in Norway, ME, positive income , Commercial Lending Specialization, 20 total offices , Holding Company: Norway Bancorp, Mhc
Bangor Savings Bank: Saco Branch at 270 Main Street, branch established on 1998/05/18. Info updated 2008/12/02: Bank assets: $2,556.3 mil, Deposits: $1,940.3 mil, headquarters in Bangor, ME, positive income , Commercial Lending Specialization, 58 total offices , Holding Company: Bangor Bancorp, Mhc
TD Bank, National Association: Saco Shaw's Supermarket Branch at 4 Scammon Street, branch established on 1996/12/10. Info updated 2010/10/04: Bank assets: $188,912.6 mil, Deposits: $153,149.8 mil, headquarters in Wilmington, DE, positive income , 1314 total offices , Holding Company: Toronto-Dominion Bank, The
Bank of America, National Association: Saco Branch at 532 Main Street, U.S. Route 1, branch established on 1974/09/12. Info updated 2009/11/18: Bank assets: $1,451,969.3 mil, Deposits: $1,077,176.8 mil, headquarters in Charlotte, NC, positive income , 5782 total offices , Holding Company: Bank Of America Corporation
For population 15 years and over in Saco:
Never married: 31.7%Now married: 51.3%Separated: 0.6%Widowed: 3.9%Divorced: 12.4% For population 25 years and over in Saco:
High school or higher: 95.4%Bachelor's degree or higher: 41.0%Graduate or professional degree: 16.2%Unemployed: 2.2%Mean travel time to work (commute): 20.9 minutes
Education Gini index (Inequality in education) Here:
9.8Maine average:
10.3
Religion statistics for Saco, ME (based on York County data)
Religion Adherents Congregations Catholic 40,283 16 Mainline Protestant 11,480 64 Evangelical Protestant 6,086 51 Other 1,847 18 Orthodox 625 3 Black Protestant 119 1 None 136,691 -
Source: Clifford Grammich, Kirk Hadaway, Richard Houseal, Dale E.Jones, Alexei Krindatch, Richie Stanley and Richard H.Taylor. 2012. 2010 U.S.Religion Census: Religious Congregations & Membership Study. Association of Statisticians of American Religious Bodies. Jones, Dale E., et al. 2002. Congregations and Membership in the United States 2000. Nashville, TN: Glenmary Research Center. Graphs represent county-level data
Food Environment Statistics: Number of grocery stores : 45York County :
2.24 / 10,000 pop.Maine :
2.80 / 10,000 pop.
Number of supercenters and club stores : 1This county :
0.05 / 10,000 pop.Maine :
0.14 / 10,000 pop.
Number of convenience stores (no gas) : 42York County :
2.09 / 10,000 pop.Maine :
2.20 / 10,000 pop.
Number of convenience stores (with gas) : 85This county :
4.23 / 10,000 pop.State :
5.75 / 10,000 pop.
Number of full-service restaurants : 252This county :
12.53 / 10,000 pop.Maine :
11.02 / 10,000 pop.
Adult obesity rate : York County :
24.0%Maine :
25.0%
Health and Nutrition:
Average overall health of teeth and gums : People feeling badly about themselves : This city:
19.8%Maine:
19.9%
People not drinking alcohol at all : Average hours sleeping at night : General health condition : Average condition of hearing : More about Health and Nutrition of Saco, ME Residents
Local government employment and payroll (March 2022)
Function
Full-time employees
Monthly full-time payroll
Average yearly full-time wage
Part-time employees
Monthly part-time payroll
Elementary and Secondary - Instruction
313 $1,482,597 $56,841 54 $92,792 Elementary and Secondary - Other Total
94 $315,498 $40,276 3 $11,738 Firefighters
36 $196,769 $65,590 0 $0 Streets and Highways
27 $118,674 $52,744 0 $0 Police Protection - Officers
27 $174,991 $77,774 0 $0 Police - Other
19 $123,857 $78,225 8 $7,006 Parks and Recreation
15 $64,567 $51,654 43 $32,030 Financial Administration
14 $68,760 $58,937 2 $156 Other Government Administration
7 $41,360 $70,903 0 $0 Water Supply
6 $36,285 $72,570 0 $0 Fire - Other
4 $30,102 $90,306 0 $0 Judicial and Legal
2 $10,976 $65,856 0 $0 Solid Waste Management
1 $4,122 $49,464 0 $0 Electric Power
1 $4,996 $59,952 0 $0
Totals for Government
566 $2,673,554 $56,683 110 $143,721
Saco government finances - Expenditure in 2021 (per resident):
Assistance and Subsidies - Public Welfare, Cash Assistance Programs - Other: $73,000 ($3.50)
Construction - Regular Highways: $3,757,000 ($180.00)
Current Operations - Elementary and Secondary Education: $45,832,000 ($2195.86)
General - Other: $4,966,000 ($237.93)Regular Highways: $4,461,000 ($213.73)Police Protection: $4,121,000 ($197.44)Local Fire Protection: $3,545,000 ($169.84)Sewerage: $3,533,000 ($169.27)Parks and Recreation: $1,741,000 ($83.41)Solid Waste Management: $1,378,000 ($66.02)Central Staff Services: $1,037,000 ($49.68)Financial Administration: $964,000 ($46.19)Libraries: $698,000 ($33.44)Protective Inspection and Regulation - Other: $354,000 ($16.96)Judicial and Legal Services: $181,000 ($8.67)Miscellaneous Commercial Activities - Other: $168,000 ($8.05)Transit Utilities: $165,000 ($7.91)General - Interest on Debt: $720,000 ($34.50)
Intergovernmental to Local - Other - Elementary and Secondary Education: $20,000 ($0.96)
Other Capital Outlay - Elementary and Secondary Education: $252,000 ($12.07)
Total Salaries and Wages: $20,635,000 ($988.65)
Saco government finances - Revenue in 2021 (per resident):
Charges - Sewerage: $3,632,000 ($174.01)
Parks and Recreation: $427,000 ($20.46)Solid Waste Management: $198,000 ($9.49)Elementary and Secondary Education School Tuition and Transportation: $154,000 ($7.38)Other: $100,000 ($4.79)Housing and Community Development: $44,000 ($2.11)Elementary and Secondary Education School Lunch: $25,000 ($1.20)Local Intergovernmental - Education: $287,000 ($13.75)
Other: $33,000 ($1.58)Miscellaneous - Sale of Property: $2,326,000 ($111.44)
Special Assessments: $616,000 ($29.51)General Revenue - Other: $91,000 ($4.36)Interest Earnings: $50,000 ($2.40)Fines and Forfeits: $14,000 ($0.67)Donations From Private Sources: $1,000 ($0.05)State Intergovernmental - Education: $19,202,000 ($919.99)
General Local Government Support: $3,957,000 ($189.58)Other: $736,000 ($35.26)Highways: $214,000 ($10.25)Public Welfare: $61,000 ($2.92)Tax - Property: $52,652,000 ($2522.61)
Public Utilities Sales: $292,000 ($13.99)Occupation and Business License - Other: $198,000 ($9.49)
Saco government finances - Debt in 2021 (per resident):
Long Term Debt - Beginning Outstanding - Unspecified Public Purpose: $18,973,000 ($909.02)
Outstanding Unspecified Public Purpose: $17,544,000 ($840.55)Retired Unspecified Public Purpose: $1,429,000 ($68.46)
Saco government finances - Cash and Securities in 2021 (per resident):
Other Funds - Cash and Securities: $24,333,000 ($1165.82)
Businesses in Saco, ME
Name Count Name Count
AT&T 1 Nike 1 Burger King 1 Nissan 1 Chevrolet 1 Pizza Hut 1 Circle K 1 Ramada 1 Curves 1 Rite Aid 1 Dairy Queen 1 Rodeway Inn 1 Dunkin Donuts 2 Shaw's 1 FedEx 1 Starbucks 1 Ford 1 Subaru 1 GNC 1 Subway 1 Hilton 1 Taco Bell 1 Honda 1 Toyota 1 Hyundai 1 U-Haul 1 KFC 1 U.S. Cellular 1 Little Caesars Pizza 1 UPS 4 Mazda 1 Volkswagen 1 McDonald's 1 Wendy's 1
Strongest AM radio stations in Saco:
WMTW (870 AM; 10 kW; GORHAM, ME; Owner: RADIO PARTNERS OF MAINE, L.P.)
WIDE (1400 AM; 1 kW; BIDDEFORD, ME; Owner: SACO BAY COMMUNICATIONS GROUP INC)
WZAN (970 AM; 5 kW; PORTLAND, ME; Owner: SAGA COMMUNICATIONS OF NEW ENGLAND, LLC)
WGAN (560 AM; 5 kW; PORTLAND, ME; Owner: SAGA COMMUNICATIONS OF NEW ENGLAND, LLC)
WJAE (1440 AM; 5 kW; WESTBROOK, ME; Owner: ALTANTIC COAST RADIO, LLC)
WLOB (1310 AM; 5 kW; PORTLAND, ME; Owner: ATLANTIC COAST RADIO, LLC)
WGIN (930 AM; 10 kW; ROCHESTER, NH; Owner: CAPSTAR TX LIMITED PARTNERSHIP)
WRKO (680 AM; 50 kW; BOSTON, MA; Owner: ENTERCOM BOSTON LICENSE, LLC)
WEEI (850 AM; 50 kW; BOSTON, MA; Owner: ENTERCOM BOSTON LICENSE, LLC)
WBZ (1030 AM; 50 kW; BOSTON, MA; Owner: INFINITY BROADCASTING OPERATIONS, INC.)
WWZN (1510 AM; 50 kW; BOSTON, MA; Owner: ROSE CITY RADIO CORPORATION)
WCRN (830 AM; 50 kW; WORCESTER, MA; Owner: CARTER BROADCASTING CORPORATION)
WKOX (1200 AM; 50 kW; FRAMINGHAM, MA; Owner: CAPSTAR TX LIMITED PARTNERSHIP)
Strongest FM radio stations in Saco:
WCYY (94.3 FM; BIDDEFORD, ME; Owner: CITADEL BROADCASTING COMPANY)
WRED (95.9 FM; SACO, ME; Owner: ATLANTIC COAST RADIO, LLC)
WQEZ (104.7 FM; KENNEBUNKPORT, ME; Owner: MARINER BROADCASTING L.P.)
WBQW (106.3 FM; SCARBOROUGH, ME; Owner: MARINER BROADCASTING LIMITED PARTNER)
WBQQ (99.3 FM; KENNEBUNK, ME; Owner: MARINER BROADCASTING L.P.)
WMEA (90.1 FM; PORTLAND, ME; Owner: MAINE PUBLIC BROADCASTING CORPORATION)
WBLM (102.9 FM; PORTLAND, ME; Owner: CITADEL BROADCASTING COMPANY)
WPKQ (103.7 FM; NORTH CONWAY, NH; Owner: CITADEL BROADCASTING COMPANY)
WHOM (94.9 FM; MT. WASHINGTON, NH; Owner: CITADEL BROADCASTING COMPANY)
WJBQ (97.9 FM; PORTLAND, ME; Owner: CITADEL BROADCASTING COMPANY)
WPOR (101.9 FM; PORTLAND, ME; Owner: SAGA COMMUNICATIONS OF NEW ENGLAND, LLC)
WSCY (106.9 FM; MOULTONBOROUGH, NH; Owner: NORTHEAST COMMUNICATIONS CORPORATION)
WPHX-FM (92.1 FM; SANFORD, ME; Owner: FNX BROADCASTING LLC)
WSEW (88.5 FM; SANFORD, ME; Owner: WORD RADIO EDUCATIONAL FOUNDATION)
WMGX (93.1 FM; PORTLAND, ME; Owner: SAGA COMMUNICATIONS OF NEW ENGLAND, LLC)
WMSJ (89.3 FM; FREEPORT, ME; Owner: DOWNEAST CHRISTIAN COMMUNICATIONS)
WUBB (95.3 FM; YORK CENTER, ME; Owner: CAPSTAR TX LIMITED PARTNERSHIP)
WTHT (107.5 FM; LEWISTON, ME; Owner: RADIO PARTNERS OF MAINE, L.P.)
WMTW-FM (106.7 FM; NORTH WINDHAM, ME; Owner: RADIO PARTNERS OF MAINE, L.P.)
WMPG (90.9 FM; GORHAM, ME; Owner: UNIVERSITY OF MAINE SYSTEM)
TV broadcast stations around Saco:
WMEA-TV (Channel 26; BIDDEFORD, ME; Owner: MAINE PUBLIC BROADCASTING CORP.)
WMTW-TV (Channel 8; POLAND SPRING, ME; Owner: WMTW BROADCAST GROUP, LLC)
WGME-TV (Channel 13; PORTLAND, ME; Owner: WGME LICENSEE, LLC)
WCSH (Channel 6; PORTLAND, ME; Owner: PACIFIC AND SOUTHERN COMPANY, INC.)
WPXT (Channel 51; PORTLAND, ME; Owner: HMW, INC.)
WPME (Channel 35; LEWISTON, ME; Owner: KB PRIME MEDIA LLC)
W32CA (Channel 32; PORTLAND, ME; Owner: NATIONAL MINORITY T.V., INC.)
WLLB-LP (Channel 15; PORTLAND, ME; Owner: CARTER BROADCASTING CORPORATION)
W58CM (Channel 58; BANGOR, ME; Owner: MS COMMUNICATIONS, LLC)
W57AP (Channel 57; FALMOUTH, ME; Owner: SHERWOOD H. CRAIG)
National Bridge Inventory (NBI) Statistics 24 Number of bridges335ft / 102m Total length356,246 Total average daily traffic30,785 Total average daily truck traffic
New bridges - historical statistics
6 1920-1929 4 1940-1949 2 1990-1999 3 2000-2009 1 2010-2019
See full National Bridge Inventory statistics for Saco, ME
Home Mortgage Disclosure Act Aggregated Statistics For Year 2009(Based on 4 full tracts) A) FHA, FSA/RHS & VA B) Conventional C) Refinancings D) Home Improvement Loans E) Loans on Dwellings For 5+ Families F) Non-occupant Loans on G) Loans On Manufactured Number Average Value Number Average Value Number Average Value Number Average Value Number Average Value Number Average Value Number Average Value
LOANS ORIGINATED 91 $180,330 124 $170,355 517 $181,025 58 $106,069 3 $173,667 59 $225,441 12 $53,083 APPLICATIONS APPROVED, NOT ACCEPTED 8 $182,375 23 $177,130 58 $192,414 6 $47,167 0 $0 8 $197,750 2 $97,000 APPLICATIONS DENIED 17 $186,118 32 $152,219 169 $207,757 27 $123,481 0 $0 24 $210,958 5 $46,400 APPLICATIONS WITHDRAWN 18 $188,444 14 $177,357 79 $196,620 5 $198,000 0 $0 11 $215,273 2 $100,000 FILES CLOSED FOR INCOMPLETENESS 1 $151,000 5 $93,000 21 $206,857 0 $0 0 $0 5 $236,200 2 $52,500
Aggregated Statistics For Year 2008(Based on 4 full tracts) A) FHA, FSA/RHS & VA B) Conventional C) Refinancings D) Home Improvement Loans E) Loans on Dwellings For 5+ Families F) Non-occupant Loans on G) Loans On Manufactured Number Average Value Number Average Value Number Average Value Number Average Value Number Average Value Number Average Value Number Average Value
LOANS ORIGINATED 50 $199,480 158 $182,013 319 $178,166 99 $79,667 6 $187,000 62 $226,226 14 $47,571 APPLICATIONS APPROVED, NOT ACCEPTED 3 $189,333 27 $206,037 40 $144,850 6 $135,500 0 $0 4 $205,000 2 $48,000 APPLICATIONS DENIED 8 $168,250 29 $148,103 154 $193,429 27 $55,778 1 $360,000 12 $217,917 12 $47,333 APPLICATIONS WITHDRAWN 5 $193,800 12 $189,917 87 $211,828 5 $67,400 0 $0 6 $178,833 4 $96,500 FILES CLOSED FOR INCOMPLETENESS 0 $0 4 $141,750 10 $263,700 0 $0 0 $0 2 $255,000 1 $73,000
Aggregated Statistics For Year 2007(Based on 4 full tracts) A) FHA, FSA/RHS & VA B) Conventional C) Refinancings D) Home Improvement Loans E) Loans on Dwellings For 5+ Families F) Non-occupant Loans on G) Loans On Manufactured Number Average Value Number Average Value Number Average Value Number Average Value Number Average Value Number Average Value Number Average Value
LOANS ORIGINATED 20 $218,950 269 $182,703 347 $164,242 113 $61,947 3 $365,667 71 $191,930 7 $41,000 APPLICATIONS APPROVED, NOT ACCEPTED 1 $163,000 44 $173,273 75 $209,840 12 $76,667 0 $0 5 $269,200 2 $29,500 APPLICATIONS DENIED 5 $214,800 37 $167,108 216 $201,653 48 $64,312 0 $0 23 $253,391 16 $65,500 APPLICATIONS WITHDRAWN 3 $187,000 23 $173,826 89 $183,719 7 $65,714 0 $0 9 $181,444 2 $20,000 FILES CLOSED FOR INCOMPLETENESS 0 $0 6 $202,167 29 $282,828 1 $200,000 0 $0 6 $224,000 0 $0
Aggregated Statistics For Year 2006(Based on 4 full tracts) A) FHA, FSA/RHS & VA B) Conventional C) Refinancings D) Home Improvement Loans E) Loans on Dwellings For 5+ Families F) Non-occupant Loans on G) Loans On Manufactured Number Average Value Number Average Value Number Average Value Number Average Value Number Average Value Number Average Value Number Average Value
LOANS ORIGINATED 17 $209,118 350 $171,620 432 $164,477 152 $58,829 7 $150,571 84 $207,238 22 $51,682 APPLICATIONS APPROVED, NOT ACCEPTED 1 $174,000 45 $165,044 55 $163,200 17 $36,000 1 $225,000 9 $100,778 2 $41,500 APPLICATIONS DENIED 5 $189,600 92 $163,620 209 $190,536 48 $78,208 4 $1,410,000 24 $268,750 22 $60,318 APPLICATIONS WITHDRAWN 1 $228,000 36 $149,278 123 $170,748 13 $90,077 0 $0 11 $202,636 4 $55,750 FILES CLOSED FOR INCOMPLETENESS 0 $0 8 $127,500 65 $192,600 0 $0 0 $0 5 $175,800 1 $79,000
Aggregated Statistics For Year 2005(Based on 4 full tracts) A) FHA, FSA/RHS & VA B) Conventional C) Refinancings D) Home Improvement Loans E) Loans on Dwellings For 5+ Families F) Non-occupant Loans on G) Loans On Manufactured Number Average Value Number Average Value Number Average Value Number Average Value Number Average Value Number Average Value Number Average Value
LOANS ORIGINATED 17 $187,235 454 $170,434 604 $164,624 147 $84,537 6 $334,833 109 $208,018 25 $67,120 APPLICATIONS APPROVED, NOT ACCEPTED 0 $0 37 $185,568 89 $160,708 12 $80,083 0 $0 12 $210,917 0 $0 APPLICATIONS DENIED 1 $183,000 71 $169,789 236 $165,860 51 $60,902 0 $0 20 $192,150 14 $93,857 APPLICATIONS WITHDRAWN 0 $0 51 $185,569 191 $174,220 24 $80,208 0 $0 13 $207,308 5 $122,400 FILES CLOSED FOR INCOMPLETENESS 0 $0 6 $147,167 71 $178,746 5 $23,200 0 $0 1 $135,000 0 $0
Aggregated Statistics For Year 2004(Based on 4 full tracts) A) FHA, FSA/RHS & VA B) Conventional C) Refinancings D) Home Improvement Loans E) Loans on Dwellings For 5+ Families F) Non-occupant Loans on G) Loans On Manufactured Number Average Value Number Average Value Number Average Value Number Average Value Number Average Value Number Average Value Number Average Value
LOANS ORIGINATED 15 $175,000 406 $168,887 610 $152,698 147 $76,857 5 $300,000 102 $179,176 25 $48,480 APPLICATIONS APPROVED, NOT ACCEPTED 1 $228,000 34 $156,882 84 $139,571 17 $83,000 0 $0 12 $139,417 2 $31,000 APPLICATIONS DENIED 0 $0 62 $165,694 204 $153,627 43 $63,581 2 $190,000 17 $177,941 13 $45,769 APPLICATIONS WITHDRAWN 1 $183,000 45 $160,222 234 $160,821 23 $70,087 1 $215,000 6 $227,833 6 $69,000 FILES CLOSED FOR INCOMPLETENESS 0 $0 4 $187,000 41 $156,439 5 $61,400 0 $0 1 $329,000 0 $0
Detailed HMDA statistics for the following Tracts:
0051.00
, 0052.00 , 0053.00 , 0054.00
Private Mortgage Insurance Companies Aggregated Statistics For Year 2009(Based on 4 full tracts) A) Conventional B) Refinancings C) Non-occupant Loans on Number Average Value Number Average Value Number Average Value
LOANS ORIGINATED 9 $215,111 13 $227,923 0 $0 APPLICATIONS APPROVED, NOT ACCEPTED 1 $128,000 11 $241,545 3 $282,667 APPLICATIONS DENIED 0 $0 5 $221,000 0 $0 APPLICATIONS WITHDRAWN 1 $248,000 3 $174,333 0 $0 FILES CLOSED FOR INCOMPLETENESS 0 $0 0 $0 0 $0
Aggregated Statistics For Year 2008(Based on 4 full tracts) A) Conventional B) Refinancings C) Non-occupant Loans on Number Average Value Number Average Value Number Average Value
LOANS ORIGINATED 36 $210,556 36 $232,444 7 $180,857 APPLICATIONS APPROVED, NOT ACCEPTED 12 $220,333 17 $231,059 1 $152,000 APPLICATIONS DENIED 4 $179,000 2 $301,000 1 $173,000 APPLICATIONS WITHDRAWN 1 $186,000 3 $283,667 0 $0 FILES CLOSED FOR INCOMPLETENESS 0 $0 1 $302,000 0 $0
Aggregated Statistics For Year 2007(Based on 4 full tracts) A) Conventional B) Refinancings C) Non-occupant Loans on Number Average Value Number Average Value Number Average Value
LOANS ORIGINATED 78 $200,897 37 $219,757 8 $193,750 APPLICATIONS APPROVED, NOT ACCEPTED 9 $241,667 8 $275,875 1 $211,000 APPLICATIONS DENIED 2 $437,000 0 $0 2 $437,000 APPLICATIONS WITHDRAWN 6 $191,333 3 $259,333 0 $0 FILES CLOSED FOR INCOMPLETENESS 0 $0 1 $225,000 1 $225,000
Aggregated Statistics For Year 2006(Based on 4 full tracts) A) Conventional B) Refinancings C) Non-occupant Loans on D) Loans On Manufactured Number Average Value Number Average Value Number Average Value Number Average Value
LOANS ORIGINATED 49 $197,429 15 $244,533 3 $233,333 0 $0 APPLICATIONS APPROVED, NOT ACCEPTED 5 $226,400 6 $223,000 0 $0 0 $0 APPLICATIONS DENIED 2 $220,500 0 $0 0 $0 1 $158,000 APPLICATIONS WITHDRAWN 3 $156,667 0 $0 0 $0 0 $0 FILES CLOSED FOR INCOMPLETENESS 0 $0 1 $165,000 0 $0 0 $0
Aggregated Statistics For Year 2005(Based on 4 full tracts) A) Conventional B) Refinancings C) Non-occupant Loans on Number Average Value Number Average Value Number Average Value
LOANS ORIGINATED 60 $197,250 32 $227,031 7 $225,857 APPLICATIONS APPROVED, NOT ACCEPTED 13 $195,846 2 $220,000 0 $0 APPLICATIONS DENIED 1 $179,000 0 $0 0 $0 APPLICATIONS WITHDRAWN 2 $147,500 0 $0 1 $186,000 FILES CLOSED FOR INCOMPLETENESS 0 $0 0 $0 0 $0
Aggregated Statistics For Year 2004(Based on 4 full tracts) A) Conventional B) Refinancings C) Non-occupant Loans on Number Average Value Number Average Value Number Average Value
LOANS ORIGINATED 79 $185,190 26 $204,615 14 $196,214 APPLICATIONS APPROVED, NOT ACCEPTED 7 $251,286 5 $167,400 2 $300,500 APPLICATIONS DENIED 1 $258,000 0 $0 1 $258,000 APPLICATIONS WITHDRAWN 1 $224,000 4 $195,750 0 $0 FILES CLOSED FOR INCOMPLETENESS 0 $0 0 $0 0 $0
Detailed PMIC statistics for the following Tracts:
0051.00
, 0052.00 , 0053.00 , 0054.00 Fire-safe hotels and motels in Saco, Maine:
Ramada Saco, 352 North St, Saco, Maine 04072 Phone: (207) 286-9600, Fax: (207) 286-9696
Rodeway Inn- Saco/Old Orchard Beach, 21 Ocean Park Rd, Saco, Maine 04072 Phone: (207) 282-5569, Fax: (207) 885-9429
All 2 fire-safe hotels and motels in Saco, Maine Saco compared to Maine state average:
Unemployed percentage significantly below state average. Black race population percentage above state average. Foreign-born population percentage significantly above state average. Length of stay since moving in above state average. Percentage of population with a bachelor's degree or higher above state average.
#66 on the list of "Top 101 cities with the biggest property tax revenues per resident (population 10,000+)"
#81 on the list of "Top 101 cities with the largest percentage of people in homes for abused, dependent, and neglected children (population 1,000+)"
#77 (04072) on the list of "Top 101 zip codes with the largest percentage of French Canadian first ancestries (pop 5,000+)"
#21 on the list of "Top 101 counties with the highest percentage of residents that smoked 100+ cigarettes in their lives"
#35 on the list of "Top 101 counties with the lowest number of births per 1000 residents 2007-2013"
#70 on the list of "Top 101 counties with the highest percentage of residents that keep firearms around their homes"
#77 on the list of "Top 101 counties with the best general health status score of residents (1-5), 3 years of data"
Top Patent Applicants
Nickole Gagne (14)
Steven M. Twombly (11)
David P. Dube (8)
Randall S. Boucher (6)
James Steven Bates (5)
Vitaliy Demin (4)
Michael C. Maguire (4)
Jose R. Paulino (4)
Andrew Wheeler (4)
Randall Boucher (4)
Total of 121 patent applications in 2008-2024.


 Recent articles from our blog. Our writers, many of them Ph.D. graduates or candidates, create easy-to-read articles on a wide variety of topics.

 (13.9 miles
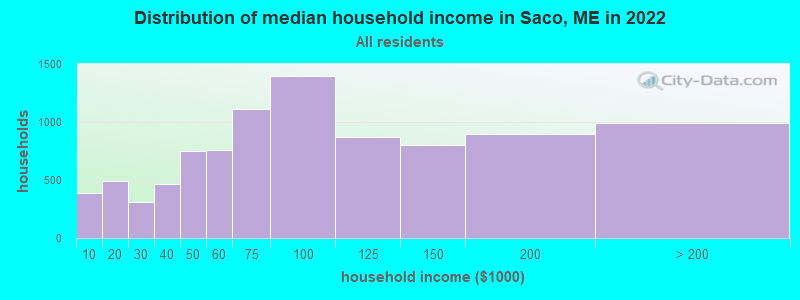
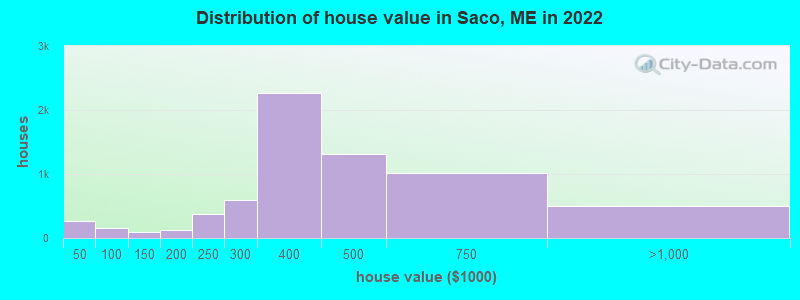
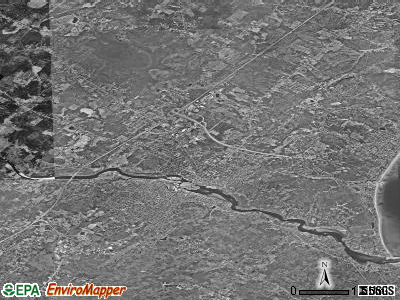
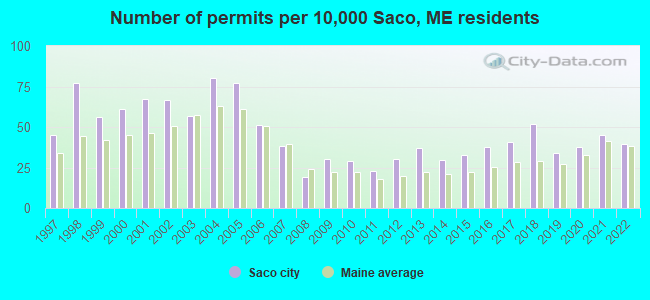
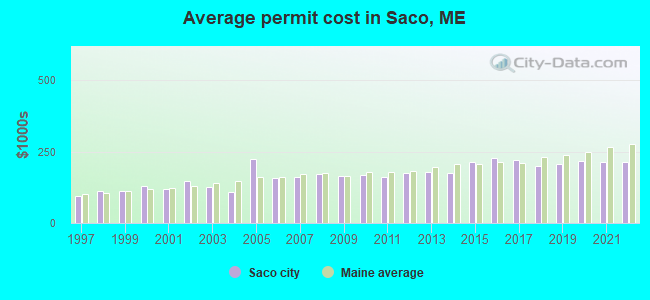
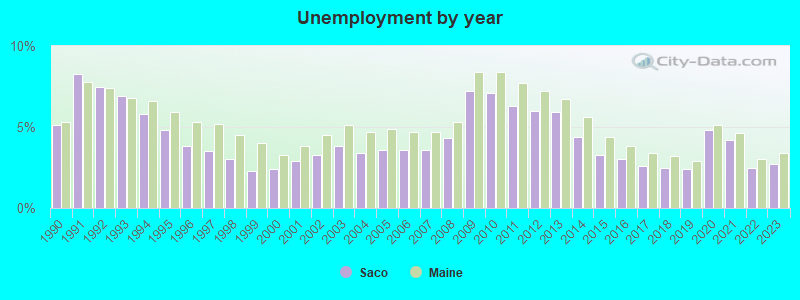
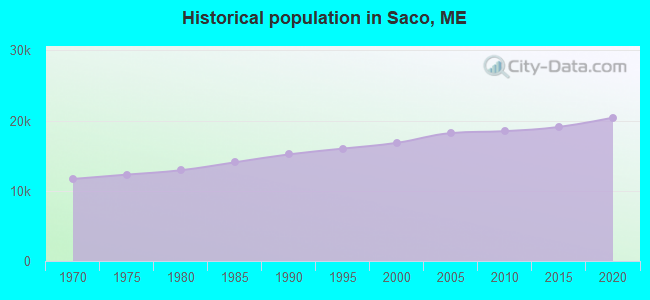
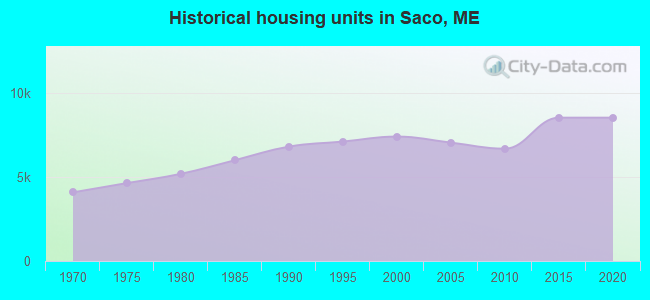
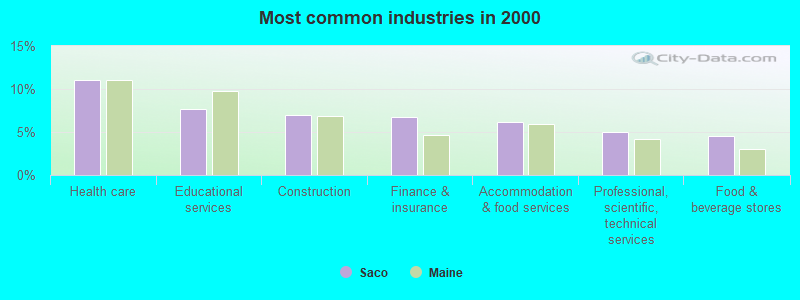
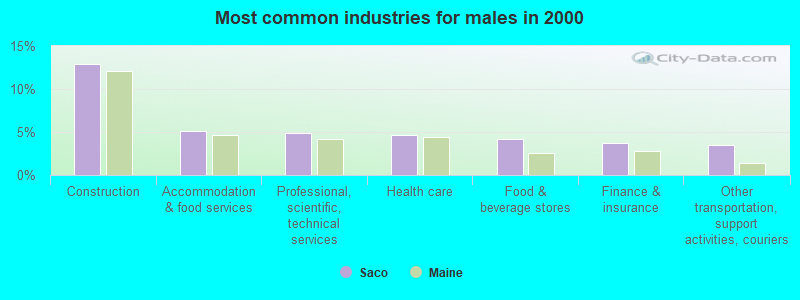
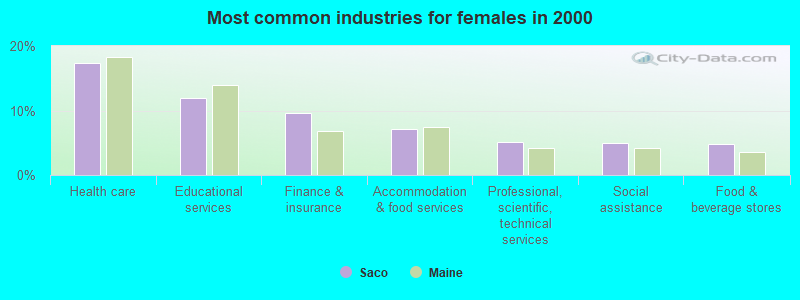
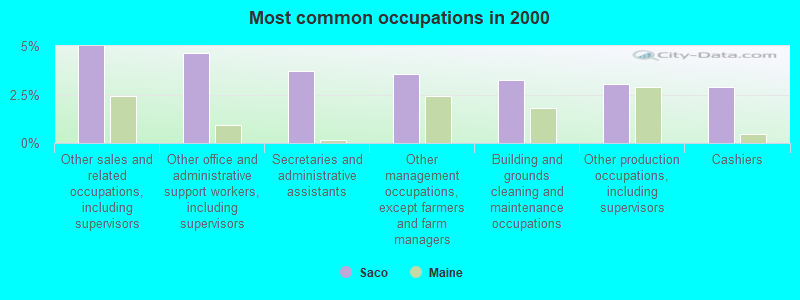
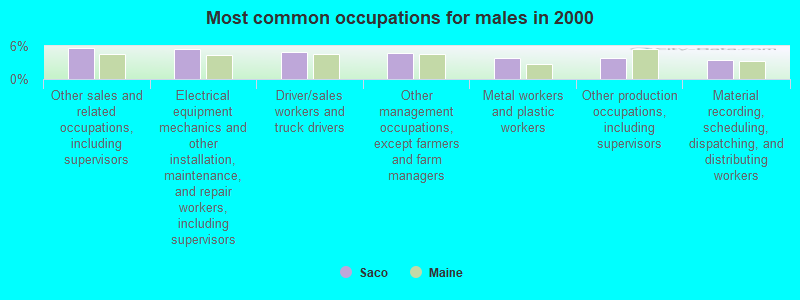
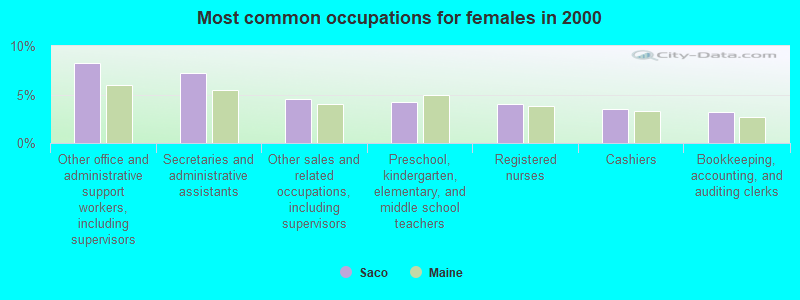


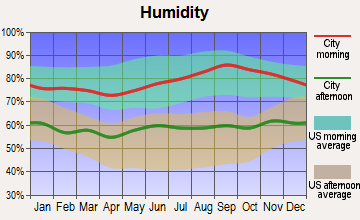
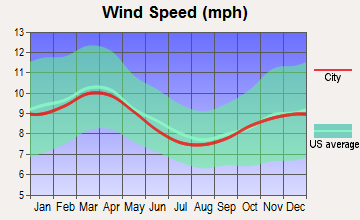

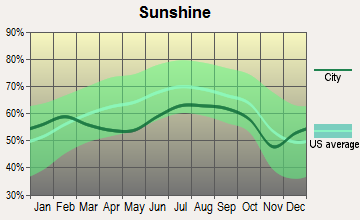
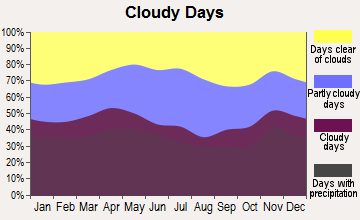


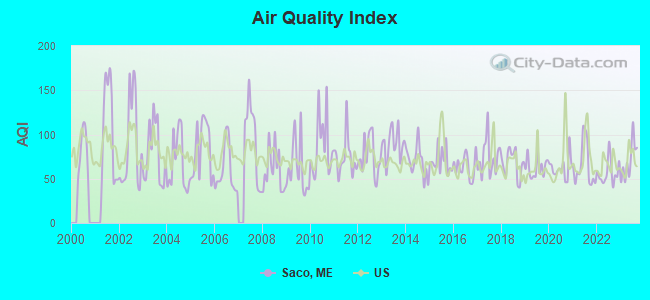
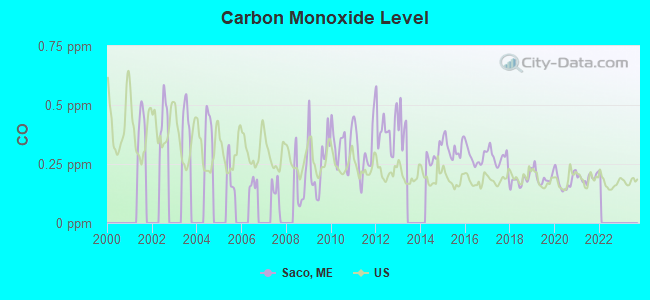
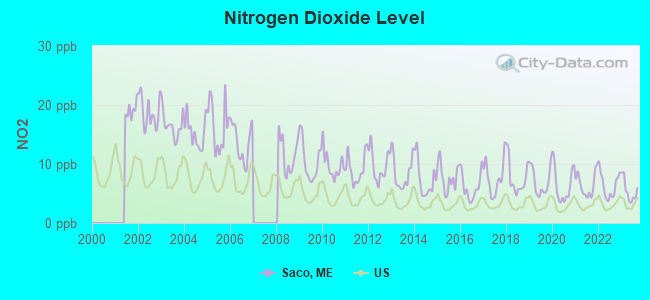
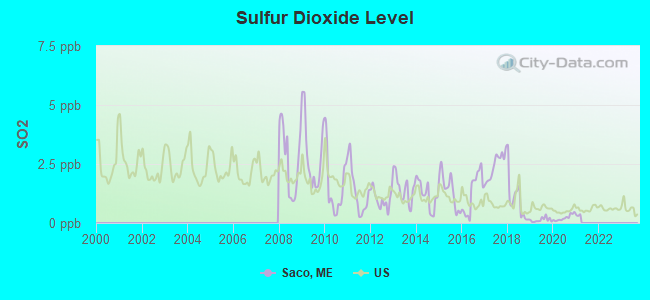
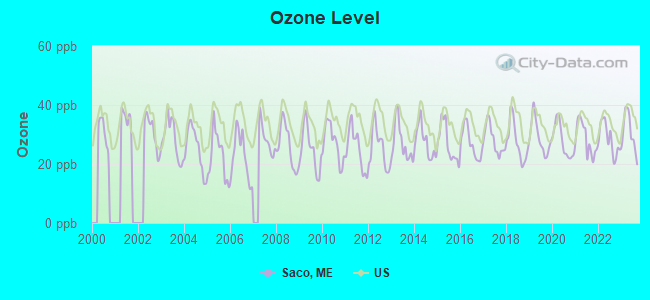
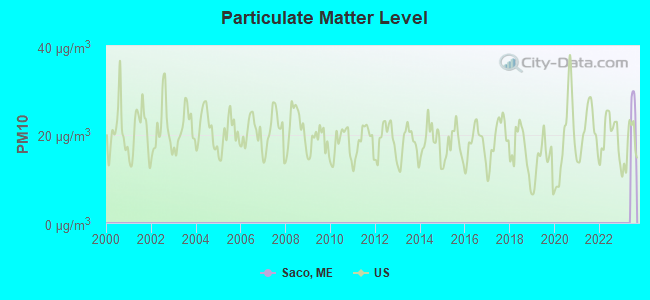
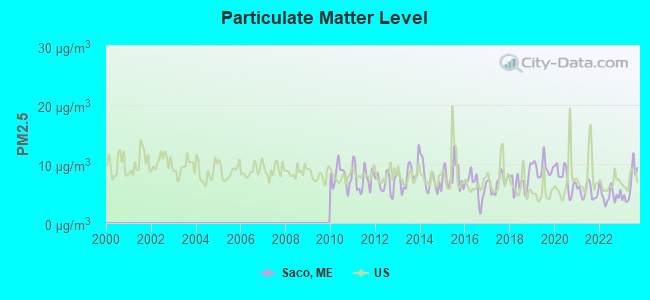
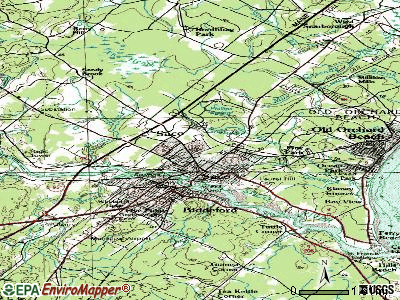
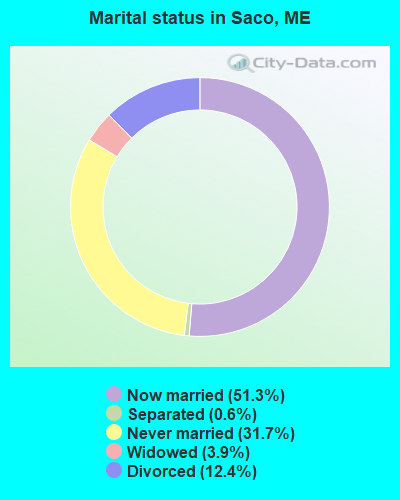
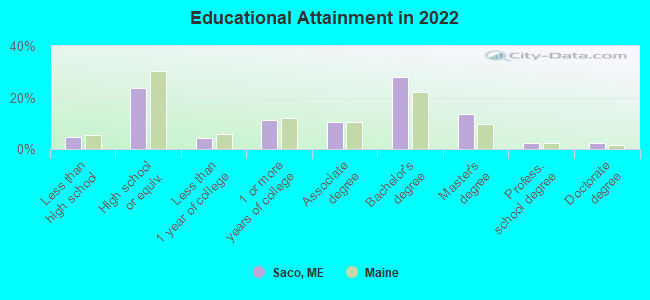
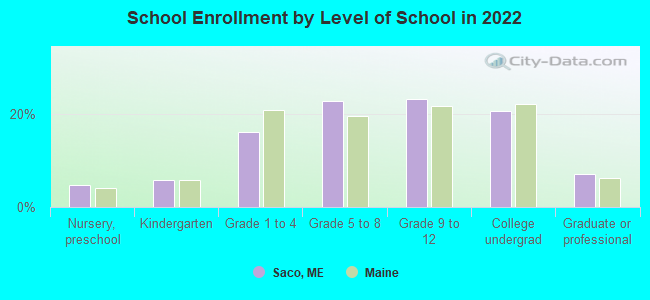
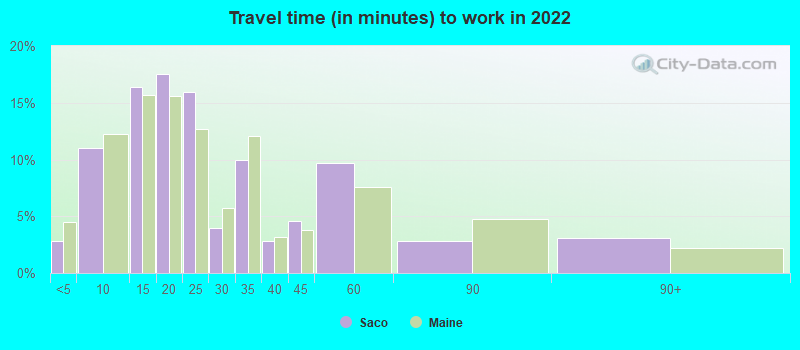
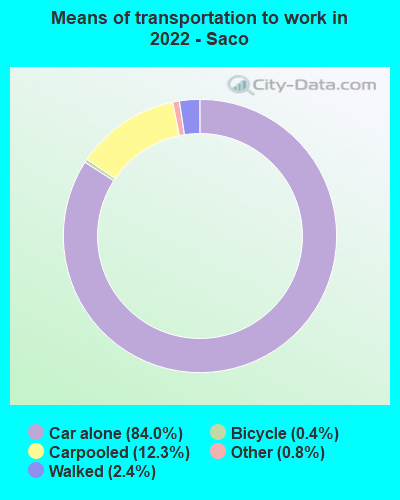
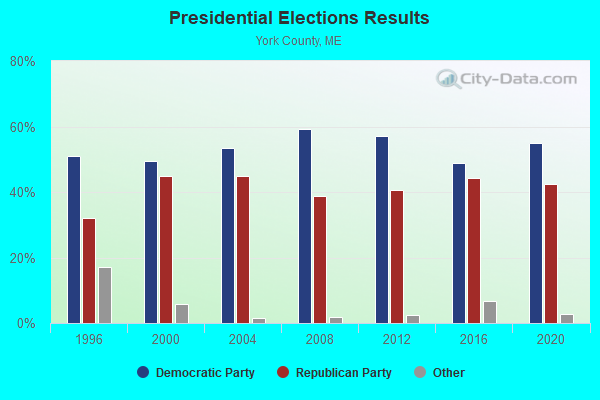
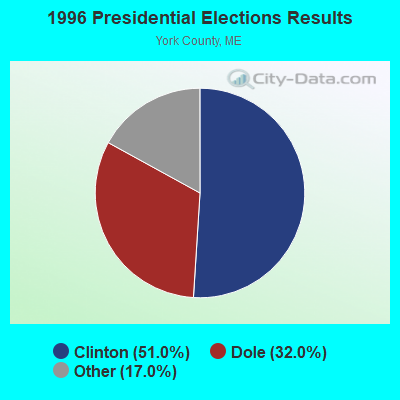
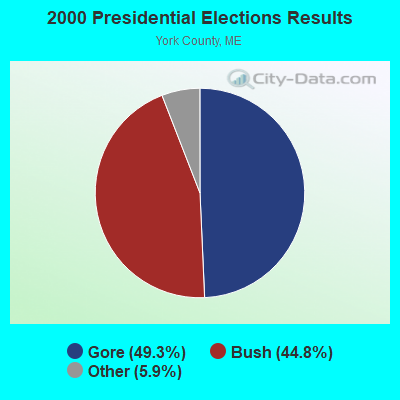
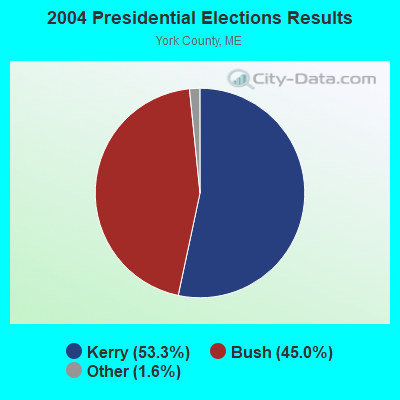
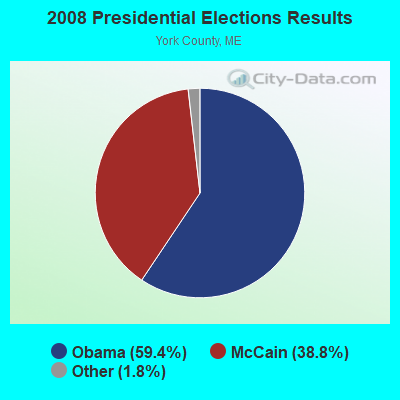
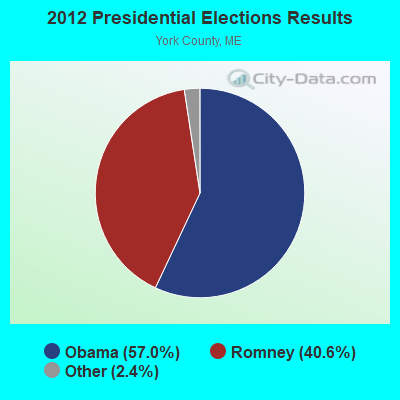
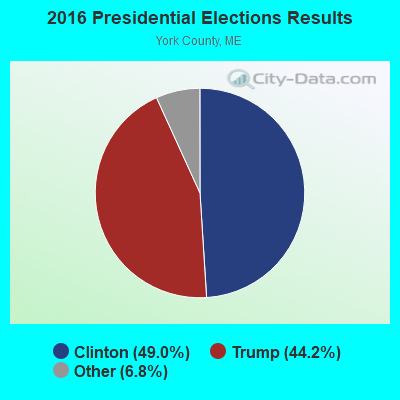
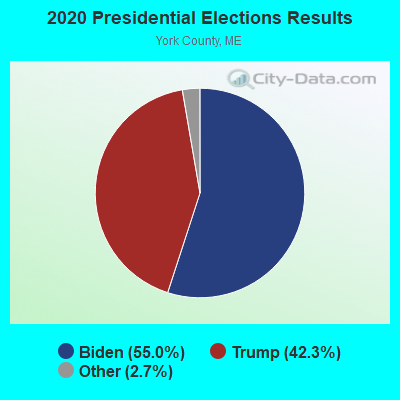
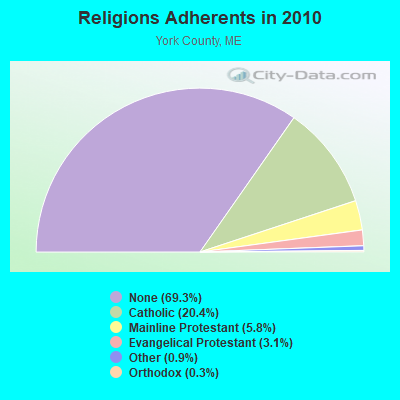
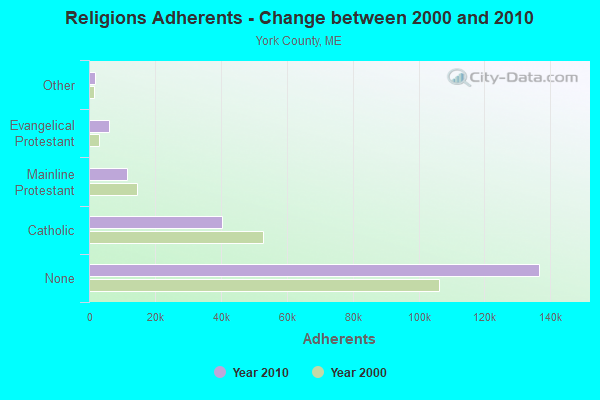
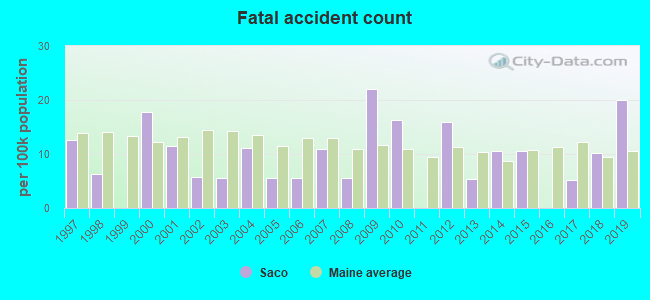
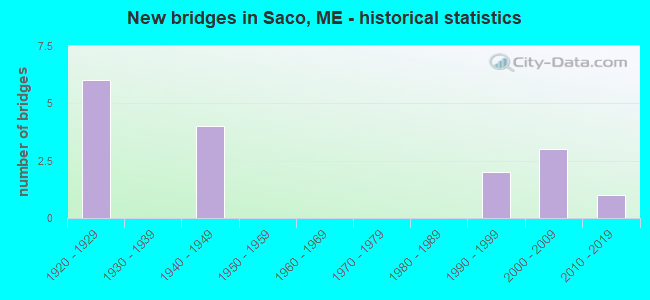
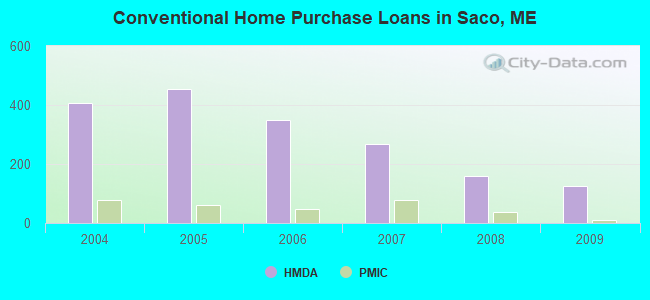
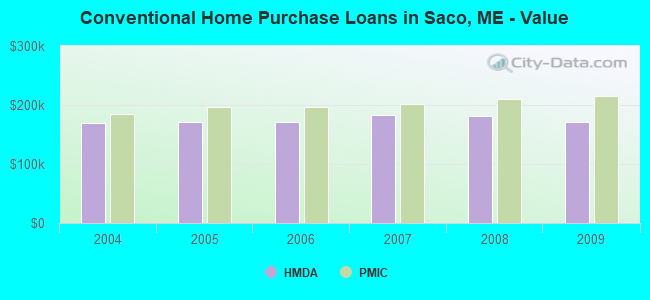
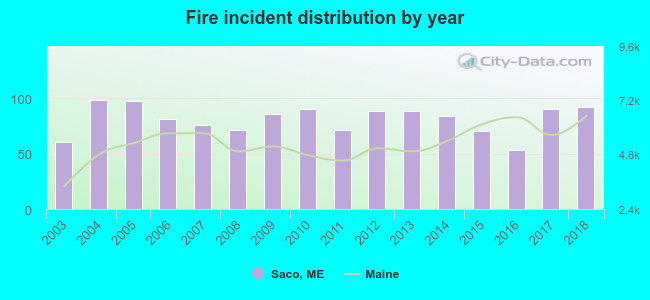 Based on the data from the years 2003 - 2018 the average number of fires per year is 81. The highest number of reported fires - 98 took place in 2004, and the least - 53 in 2016. The data has a growing trend.
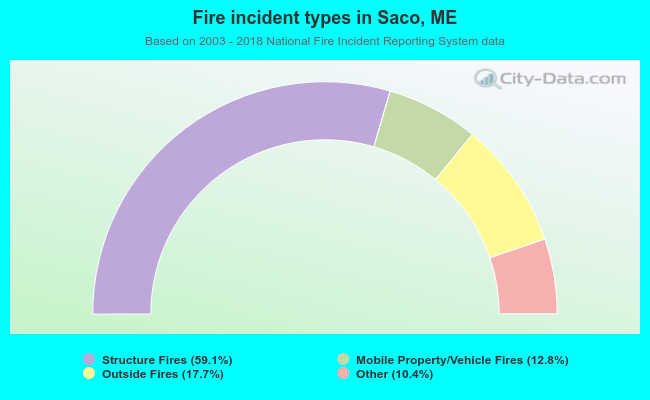 When looking into fire subcategories, the most incidents belonged to: Structure Fires (59.1%), and Outside Fires (17.7%).