Races in San Miguel, California (CA) Detailed Stats
Data:
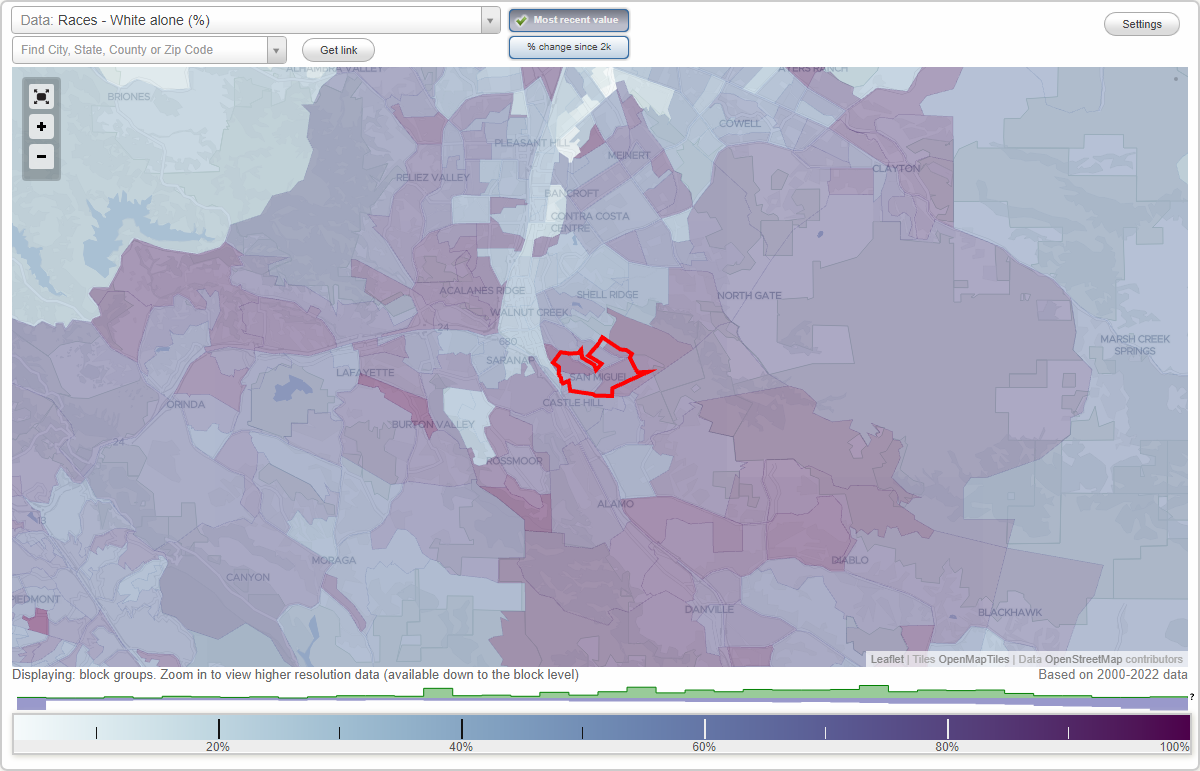
Races - White alone (%)
Races - White alone (% change since 2000)
Races - Black alone (%)
Races - Black alone (% change since 2000)
Races - American Indian alone (%)
Races - American Indian alone (% change since 2000)
Races - Asian alone (%)
Races - Asian alone (% change since 2000)
Races - Hispanic (%)
Races - Hispanic (% change since 2000)
Races - Native Hawaiian and Other Pacific Islander alone (%)
Races - Native Hawaiian and Other Pacific Islander alone (% change since 2000)
Races - Two or more races(%)
Races - Two or more races(% change since 2000)
Races - Other race alone (%)
Races - Other race alone (% change since 2000)
Racial diversity
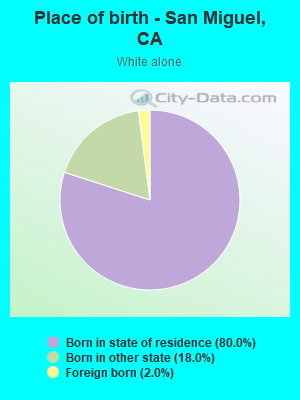
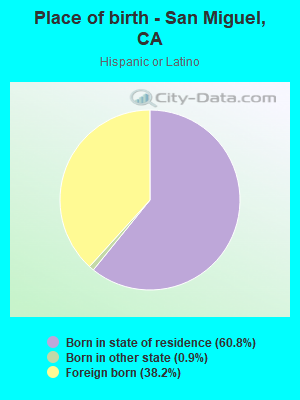
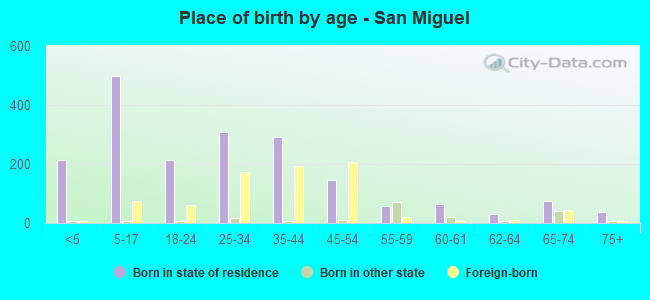
Place of birth - Born in state of residence (%)
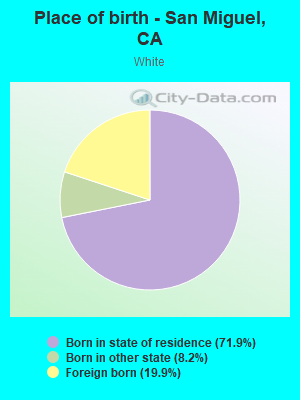
Place of birth - Born in state of residence (%) - White
Place of birth - Born in state of residence (%) - Black or African American
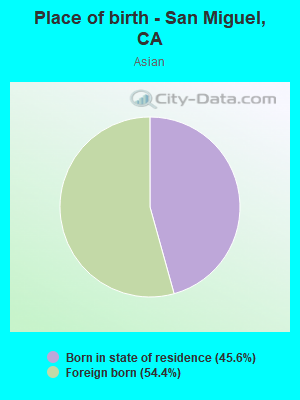
Place of birth - Born in state of residence (%) - Asian
Place of birth - Born in state of residence (%) - Hispanic or Latino
Place of birth - Born in state of residence (%) - American Indian and Alaska Native
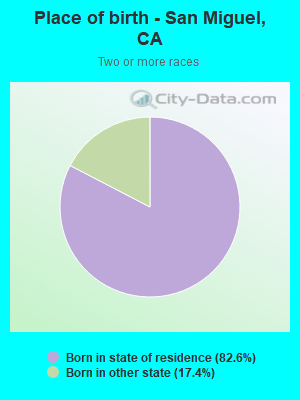
Place of birth - Born in state of residence (%) - Multirace
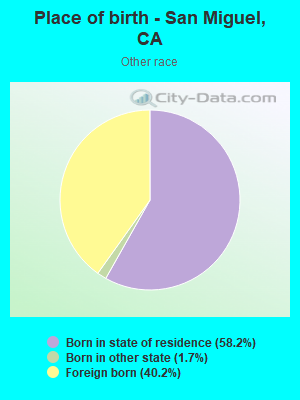
Place of birth - Born in state of residence (%) - Other Race
Place of birth - Born in other state (%)
Place of birth - Born in other state (%) - White
Place of birth - Born in other state (%) - Black or African American
Place of birth - Born in other state (%) - Asian
Place of birth - Born in other state (%) - Hispanic or Latino
Place of birth - Born in other state (%) - American Indian and Alaska Native
Place of birth - Born in other state (%) - Multirace
Place of birth - Born in other state (%) - Other Race
Place of birth - Native, outside of US (%)
Place of birth - Native, outside of US (%) - White
Place of birth - Native, outside of US (%) - Black or African American
Place of birth - Native, outside of US (%) - Asian
Place of birth - Native, outside of US (%) - Hispanic or Latino
Place of birth - Native, outside of US (%) - American Indian and Alaska Native
Place of birth - Native, outside of US (%) - Multirace
Place of birth - Native, outside of US (%) - Other Race
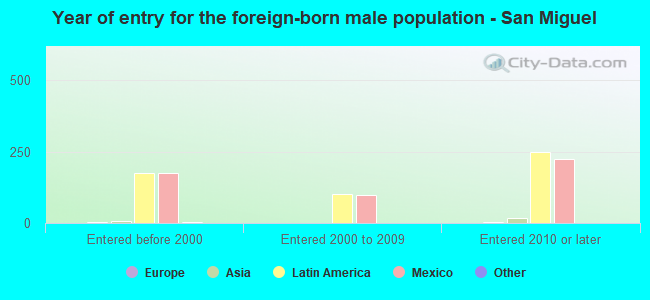
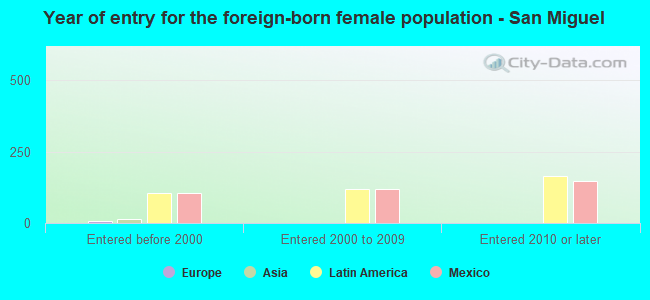
Place of birth - Foreign born (%)
Place of birth - Foreign born (%) - White
Place of birth - Foreign born (%) - Black or African American
Place of birth - Foreign born (%) - Asian
Place of birth - Foreign born (%) - Hispanic or Latino
Place of birth - Foreign born (%) - American Indian and Alaska Native
Place of birth - Foreign born (%) - Multirace
Place of birth - Foreign born (%) - Other Race
Residents speaking English at home (%)
Residents speaking English at home - Born in the United States (%)
Residents speaking English at home - Native, born elsewhere (%)
Residents speaking English at home - Foreign born (%)
Residents speaking Spanish at home (%)
Residents speaking Spanish at home - Born in the United States (%)
Residents speaking Spanish at home - Native, born elsewhere (%)
Residents speaking Spanish at home - Foreign born (%)
Residents speaking other language at home (%)
Residents speaking other language at home - Born in the United States (%)
Residents speaking other language at home - Native, born elsewhere (%)
Residents speaking other language at home - Foreign born (%)
Marital status - Never married (%)
Marital status - Now married (%)
Marital status - Separated (%)
Marital status - Widowed (%)
Marital status - Divorced (%)
Ancestries Reported - Arab (%)
Ancestries Reported - Czech (%)
Ancestries Reported - Danish (%)
Ancestries Reported - Dutch (%)
Ancestries Reported - English (%)
Ancestries Reported - French (%)
Ancestries Reported - French Canadian (%)
Ancestries Reported - German (%)
Ancestries Reported - Greek (%)
Ancestries Reported - Hungarian (%)
Ancestries Reported - Irish (%)
Ancestries Reported - Italian (%)
Ancestries Reported - Lithuanian (%)
Ancestries Reported - Norwegian (%)
Ancestries Reported - Polish (%)
Ancestries Reported - Portuguese (%)
Ancestries Reported - Russian (%)
Ancestries Reported - Scotch-Irish (%)
Ancestries Reported - Scottish (%)
Ancestries Reported - Slovak (%)
Ancestries Reported - Subsaharan African (%)
Ancestries Reported - Swedish (%)
Ancestries Reported - Swiss (%)
Ancestries Reported - Ukrainian (%)
Ancestries Reported - United States (%)
Ancestries Reported - Welsh (%)
Ancestries Reported - West Indian (%)
Ancestries Reported - Other (%)
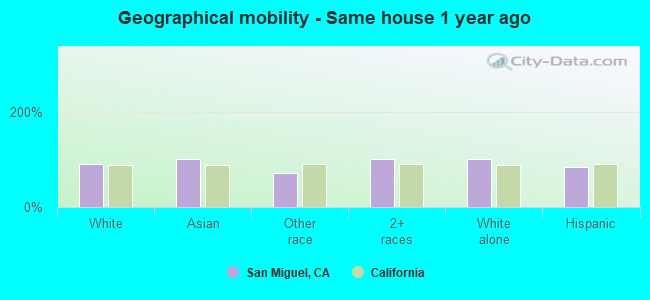
Geographical mobility - Same house 1 year ago (%)
Geographical mobility - Same house 1 year ago (%) - White
Geographical mobility - Same house 1 year ago (%) - Black or African American
Geographical mobility - Same house 1 year ago (%) - Asian
Geographical mobility - Same house 1 year ago (%) - Hispanic or Latino
Geographical mobility - Same house 1 year ago (%) - American Indian and Alaska Native
Geographical mobility - Same house 1 year ago (%) - Multirace
Geographical mobility - Same house 1 year ago (%) - Other Race
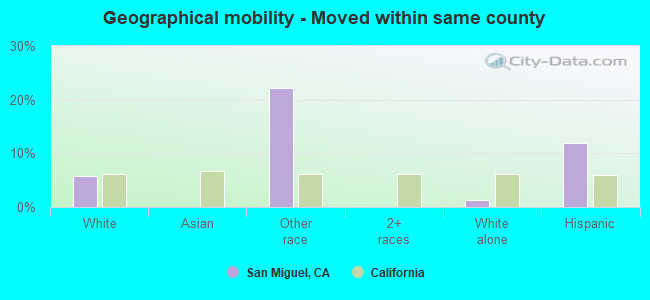
Geographical mobility - Moved within same county (%)
Geographical mobility - Moved within same county (%) - White
Geographical mobility - Moved within same county (%) - Black or African American
Geographical mobility - Moved within same county (%) - Asian
Geographical mobility - Moved within same county (%) - Hispanic or Latino
Geographical mobility - Moved within same county (%) - American Indian and Alaska Native
Geographical mobility - Moved within same county (%) - Multirace
Geographical mobility - Moved within same county (%) - Other Race
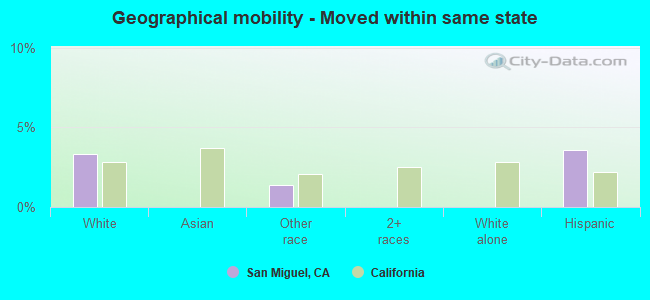
Geographical mobility - Moved from different county within same state (%)
Geographical mobility - Moved from different county within same state (%) - White
Geographical mobility - Moved from different county within same state (%) - Black or African American
Geographical mobility - Moved from different county within same state (%) - Asian
Geographical mobility - Moved from different county within same state (%) - Hispanic or Latino
Geographical mobility - Moved from different county within same state (%) - American Indian and Alaska Native
Geographical mobility - Moved from different county within same state (%) - Multirace
Geographical mobility - Moved from different county within same state (%) - Other Race
Geographical mobility - Moved from different state (%)
Geographical mobility - Moved from different state (%) - White
Geographical mobility - Moved from different state (%) - Black or African American
Geographical mobility - Moved from different state (%) - Asian
Geographical mobility - Moved from different state (%) - Hispanic or Latino
Geographical mobility - Moved from different state (%) - American Indian and Alaska Native
Geographical mobility - Moved from different state (%) - Multirace
Geographical mobility - Moved from different state (%) - Other Race
Geographical mobility - Moved from abroad (%)
Geographical mobility - Moved from abroad (%) - White
Geographical mobility - Moved from abroad (%) - Black or African American
Geographical mobility - Moved from abroad (%) - Asian
Geographical mobility - Moved from abroad (%) - Hispanic or Latino
Geographical mobility - Moved from abroad (%) - American Indian and Alaska Native
Geographical mobility - Moved from abroad (%) - Multirace
Geographical mobility - Moved from abroad (%) - Other Race
Place of birth for the foreign-born population - Ireland (%)
Place of birth for the foreign-born population - Denmark (%)
Place of birth for the foreign-born population - Norway (%)
Place of birth for the foreign-born population - Sweden (%)
Place of birth for the foreign-born population - United Kingdom (%)
Place of birth for the foreign-born population - England (%)
Place of birth for the foreign-born population - Scotland (%)
Place of birth for the foreign-born population - Other Northern Europe (%)
Place of birth for the foreign-born population - Austria (%)
Place of birth for the foreign-born population - Belgium (%)
Place of birth for the foreign-born population - France (%)
Place of birth for the foreign-born population - Germany (%)
Place of birth for the foreign-born population - Netherlands (%)
Place of birth for the foreign-born population - Switzerland (%)
Place of birth for the foreign-born population - Other Western Europe (%)
Place of birth for the foreign-born population - Greece (%)
Place of birth for the foreign-born population - Italy (%)
Place of birth for the foreign-born population - Portugal (%)
Place of birth for the foreign-born population - Spain (%)
Place of birth for the foreign-born population - Other Southern Europe (%)
Place of birth for the foreign-born population - Albania (%)
Place of birth for the foreign-born population - Belarus (%)
Place of birth for the foreign-born population - Bosnia and Herzegovina (%)
Place of birth for the foreign-born population - Bulgaria (%)
Place of birth for the foreign-born population - Croatia (%)
Place of birth for the foreign-born population - Czechoslovakia (%)
Place of birth for the foreign-born population - Hungary (%)
Place of birth for the foreign-born population - Latvia (%)
Place of birth for the foreign-born population - Lithuania (%)
Place of birth for the foreign-born population - North Macedonia (Macedonia) (%)
Place of birth for the foreign-born population - Moldova (%)
Place of birth for the foreign-born population - Poland (%)
Place of birth for the foreign-born population - Romania (%)
Place of birth for the foreign-born population - Russia (%)
Place of birth for the foreign-born population - Serbia (%)
Place of birth for the foreign-born population - Ukraine (%)
Place of birth for the foreign-born population - Other Eastern Europe (%)
Place of birth for the foreign-born population - China (%)
Place of birth for the foreign-born population - Hong Kong (%)
Place of birth for the foreign-born population - Taiwan (%)
Place of birth for the foreign-born population - Japan (%)
Place of birth for the foreign-born population - Korea (%)
Place of birth for the foreign-born population - Other Eastern Asia (%)
Place of birth for the foreign-born population - Afghanistan (%)
Place of birth for the foreign-born population - Bangladesh (%)
Place of birth for the foreign-born population - India (%)
Place of birth for the foreign-born population - Iran (%)
Place of birth for the foreign-born population - Kazakhstan (%)
Place of birth for the foreign-born population - Nepal (%)
Place of birth for the foreign-born population - Pakistan (%)
Place of birth for the foreign-born population - Sri Lanka (%)
Place of birth for the foreign-born population - Uzbekistan (%)
Place of birth for the foreign-born population - Other South Central Asia (%)
Place of birth for the foreign-born population - Burma (%)
Place of birth for the foreign-born population - Cambodia (%)
Place of birth for the foreign-born population - Indonesia (%)
Place of birth for the foreign-born population - Laos (%)
Place of birth for the foreign-born population - Malaysia (%)
Place of birth for the foreign-born population - Philippines (%)
Place of birth for the foreign-born population - Singapore (%)
Place of birth for the foreign-born population - Thailand (%)
Place of birth for the foreign-born population - Vietnam (%)
Place of birth for the foreign-born population - Other South Eastern Asia (%)
Place of birth for the foreign-born population - Armenia (%)
Place of birth for the foreign-born population - Iraq (%)
Place of birth for the foreign-born population - Israel (%)
Place of birth for the foreign-born population - Jordan (%)
Place of birth for the foreign-born population - Kuwait (%)
Place of birth for the foreign-born population - Lebanon (%)
Place of birth for the foreign-born population - Saudi Arabia (%)
Place of birth for the foreign-born population - Syria (%)
Place of birth for the foreign-born population - Turkey (%)
Place of birth for the foreign-born population - Yemen (%)
Place of birth for the foreign-born population - Other Western Asia (%)
Place of birth for the foreign-born population - Eritrea (%)
Place of birth for the foreign-born population - Ethiopia (%)
Place of birth for the foreign-born population - Kenya (%)
Place of birth for the foreign-born population - Somalia (%)
Place of birth for the foreign-born population - Uganda (%)
Place of birth for the foreign-born population - Zimbabwe (%)
Place of birth for the foreign-born population - Other Eastern Africa (%)
Place of birth for the foreign-born population - Cameroon (%)
Place of birth for the foreign-born population - Congo (%)
Place of birth for the foreign-born population - Democratic Republic of Congo (Zaire) (%)
Place of birth for the foreign-born population - Other Middle Africa (%)
Place of birth for the foreign-born population - Egypt (%)
Place of birth for the foreign-born population - Morocco (%)
Place of birth for the foreign-born population - Sudan (%)
Place of birth for the foreign-born population - Other Northern Africa (%)
Place of birth for the foreign-born population - South Africa (%)
Place of birth for the foreign-born population - Other Southern Africa (%)
Place of birth for the foreign-born population - Cabo Verde (%)
Place of birth for the foreign-born population - Ghana (%)
Place of birth for the foreign-born population - Liberia (%)
Place of birth for the foreign-born population - Nigeria (%)
Place of birth for the foreign-born population - Senegal (%)
Place of birth for the foreign-born population - Sierra Leone (%)
Place of birth for the foreign-born population - Other Western Africa (%)
Place of birth for the foreign-born population - Australia (%)
Place of birth for the foreign-born population - New Zealand (%)
Place of birth for the foreign-born population - Fiji (%)
Place of birth for the foreign-born population - Micronesia (%)
Place of birth for the foreign-born population - Bahamas (%)
Place of birth for the foreign-born population - Barbados (%)
Place of birth for the foreign-born population - Cuba (%)
Place of birth for the foreign-born population - Dominica (%)
Place of birth for the foreign-born population - Dominican Republic (%)
Place of birth for the foreign-born population - Grenada (%)
Place of birth for the foreign-born population - Haiti (%)
Place of birth for the foreign-born population - Jamaica (%)
Place of birth for the foreign-born population - St. Vincent and the Grenadines (%)
Place of birth for the foreign-born population - Trinidad and Tobago (%)
Place of birth for the foreign-born population - West Indies (%)
Place of birth for the foreign-born population - Other Caribbean (%)
Place of birth for the foreign-born population - Belize (%)
Place of birth for the foreign-born population - Costa Rica (%)
Place of birth for the foreign-born population - El Salvador (%)
Place of birth for the foreign-born population - Guatemala (%)
Place of birth for the foreign-born population - Honduras (%)
Place of birth for the foreign-born population - Mexico (%)
Place of birth for the foreign-born population - Nicaragua (%)
Place of birth for the foreign-born population - Panama (%)
Place of birth for the foreign-born population - Other Central America (%)
Place of birth for the foreign-born population - Argentina (%)
Place of birth for the foreign-born population - Bolivia (%)
Place of birth for the foreign-born population - Brazil (%)
Place of birth for the foreign-born population - Chile (%)
Place of birth for the foreign-born population - Colombia (%)
Place of birth for the foreign-born population - Ecuador (%)
Place of birth for the foreign-born population - Guyana (%)
Place of birth for the foreign-born population - Peru (%)
Place of birth for the foreign-born population - Uruguay (%)
Place of birth for the foreign-born population - Venezuela (%)
Place of birth for the foreign-born population - Other South America (%)
Place of birth for the foreign-born population - Canada (%)
Place of birth for the foreign-born population - Other Northern America (%)
Place of birth for the foreign-born population - Other (%)
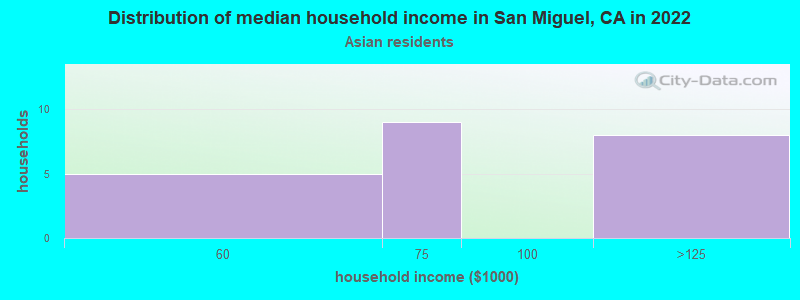
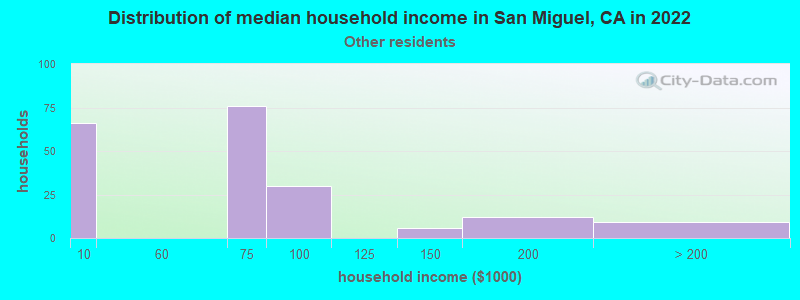
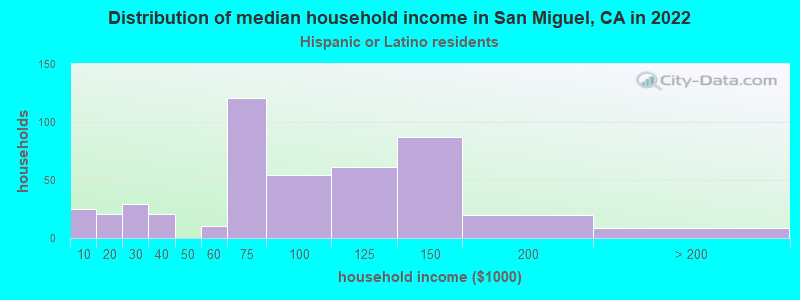
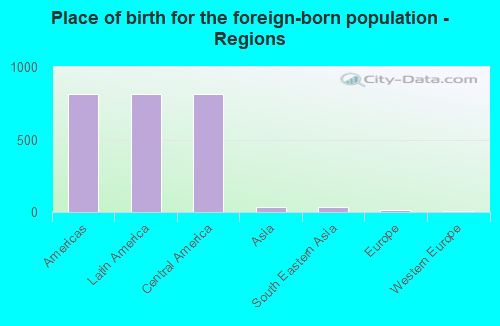
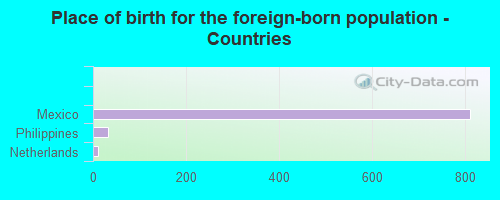
According to 2022 data, the most numerous races in San Miguel, CA are Hispanic (2,072 residents), White alone (757 residents), and Asian alone (68 residents). 44.6% of San Miguel residents speak English at home. 29.6% of San Miguel, CA residents are foreign-born (27.6% born in Latin America), which is 12.1% greater than the foreign-born rate of 26.0% across the entire state of California.
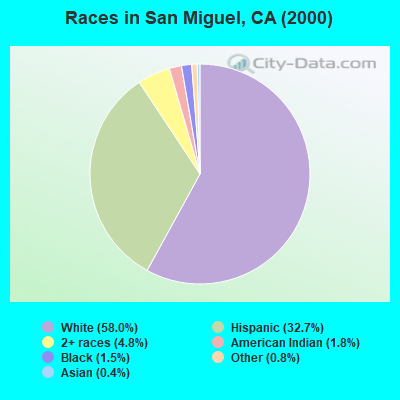
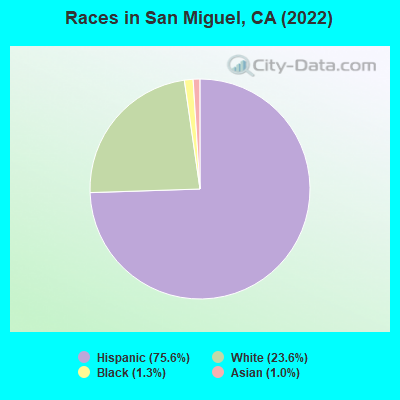
Race distribution in San Miguel
2000 2022
15,816,790 46.7% White alone 10,966,556 32.4% Hispanic 3,648,860 10.8% Asian alone 2,181,926 6.4% Black alone 903,115 2.7% Two or more races 178,984 0.5% American Indian alone 103,736 0.3% Native Hawaiian and Other 71,681 0.2% Other race alone
15,732,184 40.3% Hispanic 13,160,426 33.7% White alone 5,957,867 15.3% Asian alone 2,025,218 5.2% Black alone 1,663,222 4.3% Two or more races 251,618 0.6% Other race alone 135,777 0.3% Native Hawaiian and Other 103,030 0.3% American Indian alone
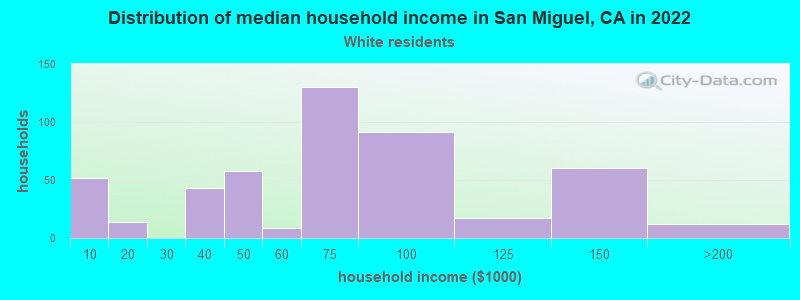
Income and house value in San Miguel Median household income in 2022 $65,812 White non-Hispanic householders$88,853 Black householders$114,486 Asian householders$82,128 Some other race householders$133,594 Two or more races householders$111,717 Hispanic or Latino race householdersMedian 2022 house value $420,397 White Non-Hispanic householders$413,919 Some other race householders$467,548 Two or more races householders$416,798 Hispanic or Latino householders
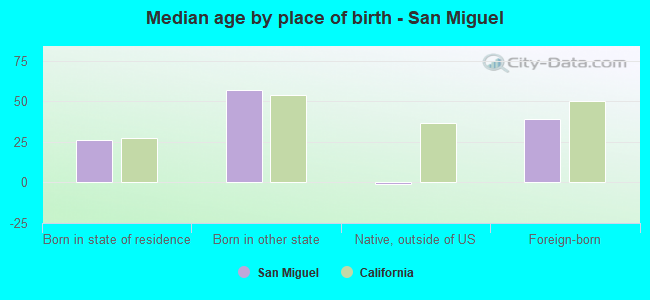
Median age by race in San Miguel
35.7 Median age for White residents29.3 39.1 40.7 Median age for American Indian / Alaska Native residents45.7 Median age for Asian residents42.3 39.8 30.2 Median age for Other race residents15.5 42.2 68.3 Median age for Two or more races residents67.5 21.4 51.8 Median age for White alone residents39.8 56.8 26.0 Median age for Hispanic or Latino residents21.7 31.3
Owner/renter occupied households by race in San Miguel
House owners and renters - White residents 361 58.7% Owner occupied254 41.3% Renter occupiedHouse owners and renters - Asian residents 20 70.7% Owner occupied8 29.3% Renter occupiedHouse owners and renters - Other race residents 71 54.7% Owner occupied58 45.3% Renter occupiedHouse owners and renters - Two or more races residents 23 100.0% Owner occupiedHouse owners and renters - White alone residents 238 73.0% Owner occupied88 27.0% Renter occupiedHouse owners and renters - Hispanic or Latino residents 234 46.1% Owner occupied274 53.9% Renter occupied
Language usage in San Miguel
English speakers - Total 44.6% of residents of San Miguel speak English at home.
51.5% of residents speak Spanish at home 657 47.5% Speak English very well725 52.5% Speak English less than very well2.8% of residents speak other language at home 27 36.5% Speak English very well47 63.5% Speak English less than very well
English speakers - Born in the United States 94.4% of residents of San Miguel speak English at home.
4.5% of residents speak Spanish at home 8 100.0% Speak English very well0.6% of residents speak other language at home 1 100.0% Speak English very well
English speakers - Foreign-born 2.0% of residents of San Miguel speak English at home.
88.5% of residents speak Spanish at home 125 16.7% Speak English very well623 83.3% Speak English less than very well5.3% of residents speak other language at home 20 44.4% Speak English very well25 55.6% Speak English less than very well
White (Caucasian) - Speak only English Native:
78.6% (964)Foreign-born:
3.7% (12)
White (Caucasian) - Speak another language Native:
20.9% (257)Foreign-born:
92.5% (313)
Asian - Speak another language Native:
97.5% (31)Foreign-born:
100.0% (42)
Other race - Speak another language Native:
81.9% (268)Foreign-born:
99.7% (197)
White alone - Speak only English Native:
94.1% (677)Foreign-born:
31.1% (5)
White alone - Speak another language Native:
6.4% (46)Foreign-born:
74.0% (12)
Hispanic or Latino - Speak only English Native:
46.8% (543)Foreign-born:
1.7% (11)
Hispanic or Latino - Speak another language Native:
50.7% (588)Foreign-born:
97.3% (631)
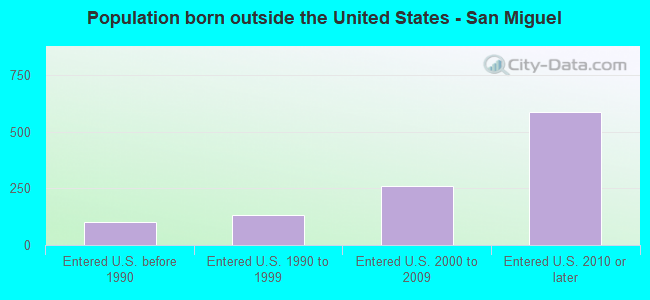
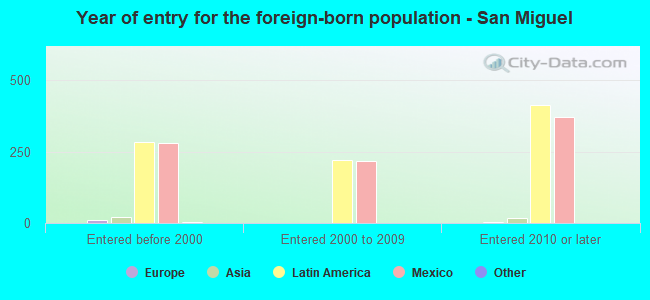
Foreign-born residents in San Miguel 864 residents are foreign born (27.6% Latin America ).
This city:
29.6%California:
100.0%
Marital status for residents in San Miguel Marital status - White (Caucasian) population 15 years and over
Males 50.1% Never married42.8% Now married0.0% Separated0.0% Widowed7.1% DivorcedFemales 28.5% Never married44.0% Now married5.7% Separated8.7% Widowed13.2% DivorcedWomen who gave birth in the past 12 months Now married:
100.0% (72)Unmarried:
0.0% (0)
Women who did not give birth in the past 12 months Now married:
43.7% (155)Unmarried:
56.3% (200)
Marital status - Asian population 15 years and over
Males 73.1% Never married26.9% Now married0.0% Separated0.0% Widowed0.0% DivorcedFemales 57.9% Never married23.7% Now married0.0% Separated0.0% Widowed18.4% DivorcedWomen who did not give birth in the past 12 months Now married:
0.0% (0)Unmarried:
100.0% (23)
Marital status - Other race population 15 years and over
Males 54.0% Never married39.6% Now married0.0% Separated6.4% Widowed0.0% DivorcedFemales 37.2% Never married41.3% Now married0.0% Separated0.0% Widowed21.5% DivorcedWomen who did not give birth in the past 12 months Now married:
44.3% (57)Unmarried:
55.7% (72)
Marital status - Two or more races population 15 years and over
Males 0.0% Never married80.5% Now married0.0% Separated0.0% Widowed19.5% DivorcedFemales 55.8% Never married18.6% Now married0.0% Separated0.0% Widowed25.6% DivorcedWomen who did not give birth in the past 12 months Now married:
0.0% (0)Unmarried:
100.0% (71)
Marital status - White alone, not Hispanic / Latino population 15 years and over
Males 43.3% Never married40.5% Now married0.0% Separated0.0% Widowed16.3% DivorcedFemales 19.7% Never married34.3% Now married3.1% Separated19.7% Widowed23.1% DivorcedWomen who did not give birth in the past 12 months Now married:
44.8% (51)Unmarried:
55.2% (63)
Marital status - Hispanic or Latino population 15 years and over
Males 52.5% Never married45.8% Now married0.0% Separated1.6% Widowed0.0% DivorcedFemales 38.3% Never married46.9% Now married5.3% Separated0.0% Widowed9.5% DivorcedWomen who gave birth in the past 12 months Now married:
100.0% (95)Unmarried:
0.0% (0)
Women who did not give birth in the past 12 months Now married:
41.3% (198)Unmarried:
58.7% (281)
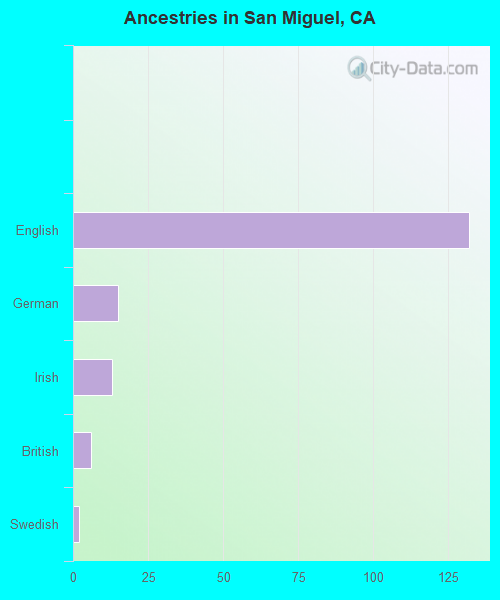
Ancestries in San Miguel
79 4.7% English30 1.8% Irish18 1.1% Portuguese17 1.0% German10 0.6% British1 0.06% Swedish
Children Nativity (place of birth) in San Miguel
Children under 6 years - Living with two parents Both parents native 96 100.0% NativeBoth parents foreign-born 51 74.1% Native18 25.9% Foreign-bornOne native, one foreign-born parent 35 100.0% NativeChildren under 6 years - Living with one parent Native parent 27 100.0% NativeForeign-born parent 27 100.0% NativeChildren 6 to 17 years - Living with two parents Both parents native 61 99.6% Native0 0.4% Foreign-bornBoth parents foreign-born 164 81.0% Native38 19.0% Foreign-bornOne native, one foreign-born parent 51 100.0% NativeChildren 6 to 17 years - Living with one parent Native parent 65 100.0% NativeForeign-born parent 109 53.7% Native94 46.3% Foreign-born
Grandparents responsible for own grandchildren in San Miguel
Grandparents (30 to 59 years) Other race 18 100.0% Not responsible for grandchildrenHispanic or Latino 16 100.0% Not responsible for grandchildren
Grandparents (60 years and over) Hispanic or Latino 35 100.0% Not responsible for grandchildren