Races in Sandgate, Vermont (VT) Detailed Stats
Ancestries, Foreign-born residents, place of birth

Recent posts about races in Sandgate, Vermont on our local forum with over 2,400,000 registered users:
 | Need some serious insight on old well and cesspool (1 reply) |
5.1% of Sandgate, VT residents are foreign-born (3.7% born in Europe, 0.6% born in Africa, 0.6% born in North America), which is 21.6% greater than the foreign-born rate of 4.0% across the entire state of Vermont.
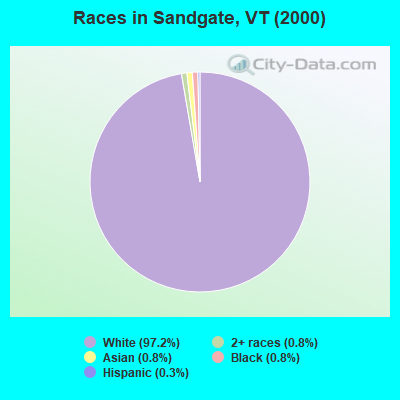
Race distribution in Sandgate

- 34397.2%White alone
- 30.8%Two or more races
- 30.8%Asian alone
- 30.8%Black alone
- 10.3%Hispanic
2000
2022
-
- 585,43196.2%White alone
- 6,8091.1%Two or more races
- 5,5040.9%Hispanic
- 5,1600.8%Asian alone
- 2,9210.5%Black alone
- 2,3250.4%American Indian alone
- 5570.09%Other race alone
- 1200.02%Native Hawaiian and Other
Pacific Islander alone

-
- 583,54690.2%White alone
- 27,3404.2%Two or more races
- 14,7702.3%Hispanic
- 11,5121.8%Asian alone
- 6,2641.0%Black alone
- 2,5210.4%Other race alone
- 1,0520.2%American Indian alone
- 590.01%Native Hawaiian and Other
Pacific Islander alone

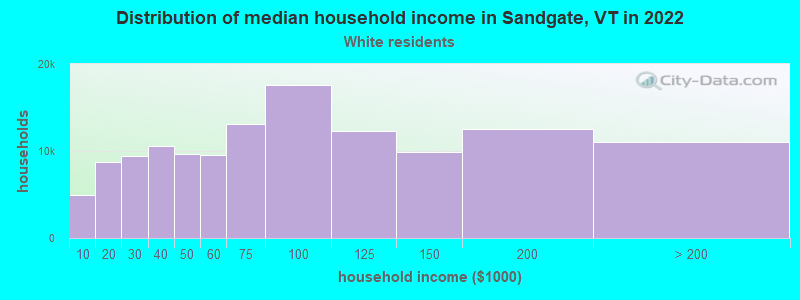
Income and house value in Sandgate
- Median household income in 2022
- $73,830White non-Hispanic householders
- Median 2022 house value
- $215,195White Non-Hispanic householders
Household income for White non-Hispanic householders
Foreign-born residents in Sandgate
18 residents are foreign born (3.7% Europe, 0.6% Africa, 0.6% North America).
| This city: | 5.1% |
| Vermont: | 3.8% |
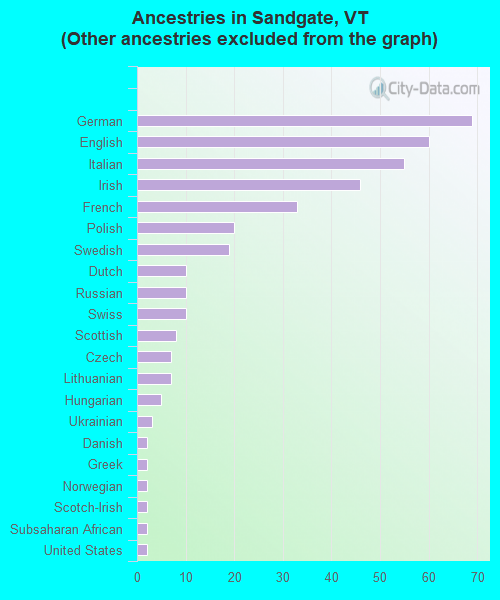
Ancestries in Sandgate

- 7917.4%Other
- 6915.2%German
- 6013.2%English
- 5512.1%Italian
- 4610.2%Irish
- 337.3%French
- 204.4%Polish
- 194.2%Swedish
- 102.2%Dutch
- 102.2%Russian
- 102.2%Swiss
- 81.8%Scottish
- 71.5%Czech
- 71.5%Lithuanian
- 51.1%Hungarian
- 30.7%Ukrainian
- 20.4%Danish
- 20.4%Greek
- 20.4%Norwegian
- 20.4%Scotch-Irish
- 20.4%Subsaharan African
- 20.4%United States
Zip codes: 05250.