Races in Santa Cruz, California (CA) Detailed Stats
Data:
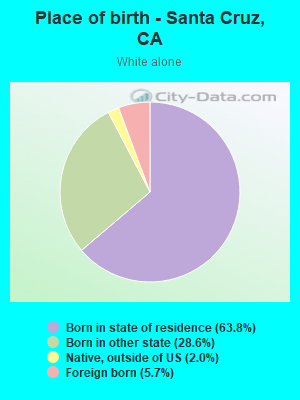
Races - White alone (%)
Races - White alone (% change since 2000)
Races - Black alone (%)
Races - Black alone (% change since 2000)
Races - American Indian alone (%)
Races - American Indian alone (% change since 2000)
Races - Asian alone (%)
Races - Asian alone (% change since 2000)
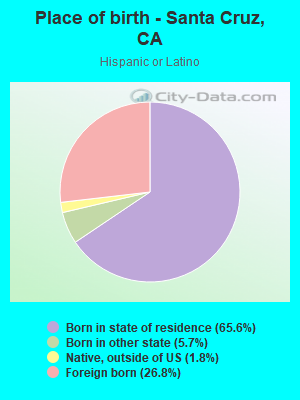
Races - Hispanic (%)
Races - Hispanic (% change since 2000)
Races - Native Hawaiian and Other Pacific Islander alone (%)
Races - Native Hawaiian and Other Pacific Islander alone (% change since 2000)
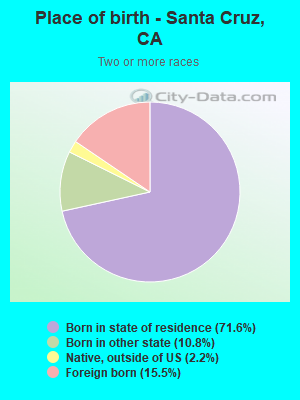
Races - Two or more races(%)
Races - Two or more races(% change since 2000)
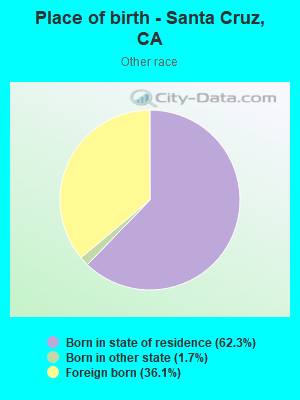
Races - Other race alone (%)
Races - Other race alone (% change since 2000)
Racial diversity
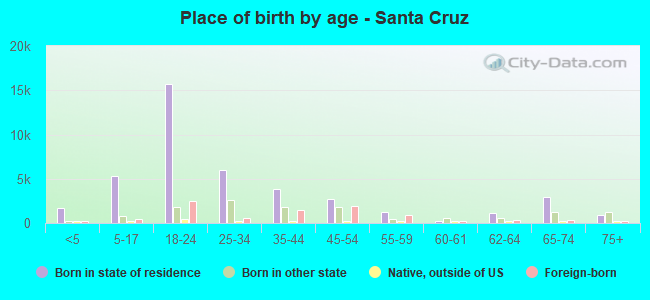
Place of birth - Born in state of residence (%)
Place of birth - Born in state of residence (%) - White
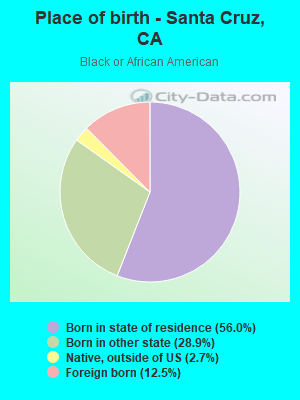
Place of birth - Born in state of residence (%) - Black or African American
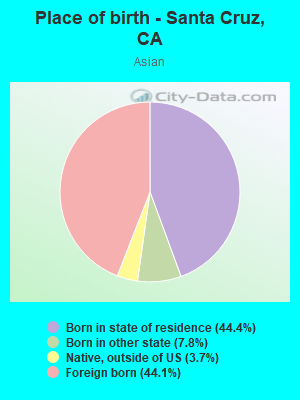
Place of birth - Born in state of residence (%) - Asian
Place of birth - Born in state of residence (%) - Hispanic or Latino
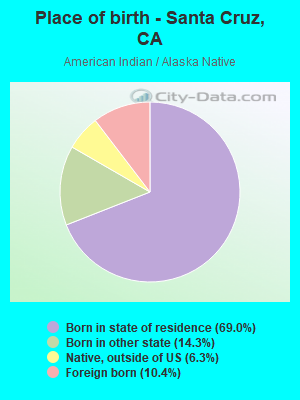
Place of birth - Born in state of residence (%) - American Indian and Alaska Native
Place of birth - Born in state of residence (%) - Multirace
Place of birth - Born in state of residence (%) - Other Race
Place of birth - Born in other state (%)
Place of birth - Born in other state (%) - White
Place of birth - Born in other state (%) - Black or African American
Place of birth - Born in other state (%) - Asian
Place of birth - Born in other state (%) - Hispanic or Latino
Place of birth - Born in other state (%) - American Indian and Alaska Native
Place of birth - Born in other state (%) - Multirace
Place of birth - Born in other state (%) - Other Race
Place of birth - Native, outside of US (%)
Place of birth - Native, outside of US (%) - White
Place of birth - Native, outside of US (%) - Black or African American
Place of birth - Native, outside of US (%) - Asian
Place of birth - Native, outside of US (%) - Hispanic or Latino
Place of birth - Native, outside of US (%) - American Indian and Alaska Native
Place of birth - Native, outside of US (%) - Multirace
Place of birth - Native, outside of US (%) - Other Race
Place of birth - Foreign born (%)
Place of birth - Foreign born (%) - White
Place of birth - Foreign born (%) - Black or African American
Place of birth - Foreign born (%) - Asian
Place of birth - Foreign born (%) - Hispanic or Latino
Place of birth - Foreign born (%) - American Indian and Alaska Native
Place of birth - Foreign born (%) - Multirace
Place of birth - Foreign born (%) - Other Race
Residents speaking English at home (%)
Residents speaking English at home - Born in the United States (%)
Residents speaking English at home - Native, born elsewhere (%)
Residents speaking English at home - Foreign born (%)
Residents speaking Spanish at home (%)
Residents speaking Spanish at home - Born in the United States (%)
Residents speaking Spanish at home - Native, born elsewhere (%)
Residents speaking Spanish at home - Foreign born (%)
Residents speaking other language at home (%)
Residents speaking other language at home - Born in the United States (%)
Residents speaking other language at home - Native, born elsewhere (%)
Residents speaking other language at home - Foreign born (%)
Marital status - Never married (%)
Marital status - Now married (%)
Marital status - Separated (%)
Marital status - Widowed (%)
Marital status - Divorced (%)
Ancestries Reported - Arab (%)
Ancestries Reported - Czech (%)
Ancestries Reported - Danish (%)
Ancestries Reported - Dutch (%)
Ancestries Reported - English (%)
Ancestries Reported - French (%)
Ancestries Reported - French Canadian (%)
Ancestries Reported - German (%)
Ancestries Reported - Greek (%)
Ancestries Reported - Hungarian (%)
Ancestries Reported - Irish (%)
Ancestries Reported - Italian (%)
Ancestries Reported - Lithuanian (%)
Ancestries Reported - Norwegian (%)
Ancestries Reported - Polish (%)
Ancestries Reported - Portuguese (%)
Ancestries Reported - Russian (%)
Ancestries Reported - Scotch-Irish (%)
Ancestries Reported - Scottish (%)
Ancestries Reported - Slovak (%)
Ancestries Reported - Subsaharan African (%)
Ancestries Reported - Swedish (%)
Ancestries Reported - Swiss (%)
Ancestries Reported - Ukrainian (%)
Ancestries Reported - United States (%)
Ancestries Reported - Welsh (%)
Ancestries Reported - West Indian (%)
Ancestries Reported - Other (%)
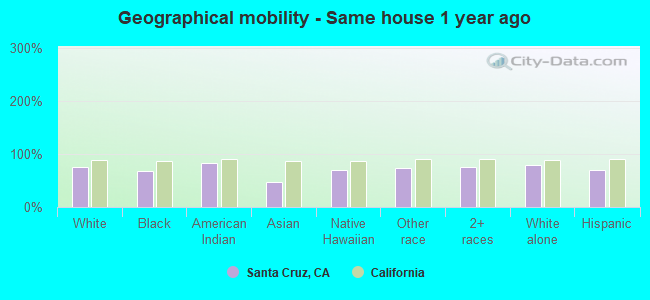
Geographical mobility - Same house 1 year ago (%)
Geographical mobility - Same house 1 year ago (%) - White
Geographical mobility - Same house 1 year ago (%) - Black or African American
Geographical mobility - Same house 1 year ago (%) - Asian
Geographical mobility - Same house 1 year ago (%) - Hispanic or Latino
Geographical mobility - Same house 1 year ago (%) - American Indian and Alaska Native
Geographical mobility - Same house 1 year ago (%) - Multirace
Geographical mobility - Same house 1 year ago (%) - Other Race
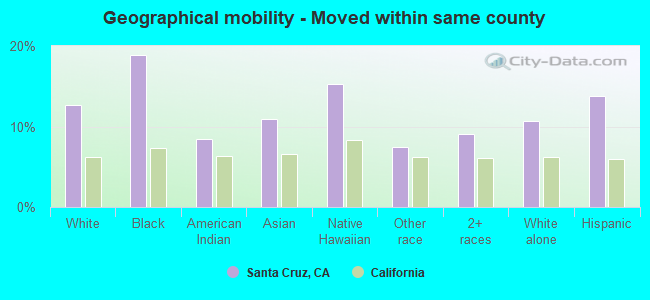
Geographical mobility - Moved within same county (%)
Geographical mobility - Moved within same county (%) - White
Geographical mobility - Moved within same county (%) - Black or African American
Geographical mobility - Moved within same county (%) - Asian
Geographical mobility - Moved within same county (%) - Hispanic or Latino
Geographical mobility - Moved within same county (%) - American Indian and Alaska Native
Geographical mobility - Moved within same county (%) - Multirace
Geographical mobility - Moved within same county (%) - Other Race
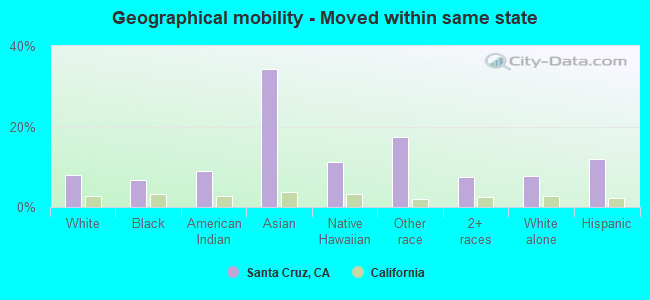
Geographical mobility - Moved from different county within same state (%)
Geographical mobility - Moved from different county within same state (%) - White
Geographical mobility - Moved from different county within same state (%) - Black or African American
Geographical mobility - Moved from different county within same state (%) - Asian
Geographical mobility - Moved from different county within same state (%) - Hispanic or Latino
Geographical mobility - Moved from different county within same state (%) - American Indian and Alaska Native
Geographical mobility - Moved from different county within same state (%) - Multirace
Geographical mobility - Moved from different county within same state (%) - Other Race
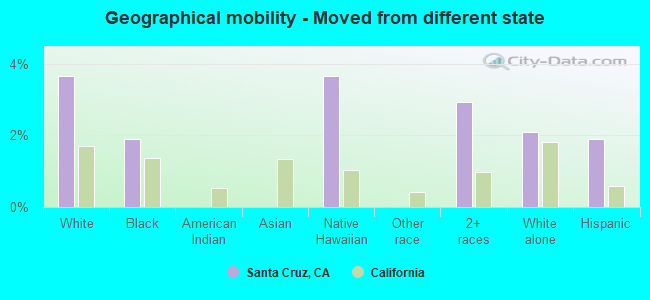
Geographical mobility - Moved from different state (%)
Geographical mobility - Moved from different state (%) - White
Geographical mobility - Moved from different state (%) - Black or African American
Geographical mobility - Moved from different state (%) - Asian
Geographical mobility - Moved from different state (%) - Hispanic or Latino
Geographical mobility - Moved from different state (%) - American Indian and Alaska Native
Geographical mobility - Moved from different state (%) - Multirace
Geographical mobility - Moved from different state (%) - Other Race
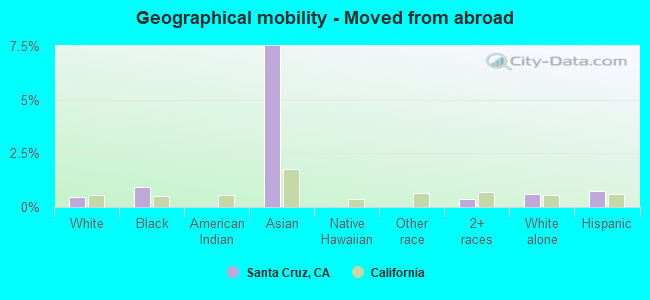
Geographical mobility - Moved from abroad (%)
Geographical mobility - Moved from abroad (%) - White
Geographical mobility - Moved from abroad (%) - Black or African American
Geographical mobility - Moved from abroad (%) - Asian
Geographical mobility - Moved from abroad (%) - Hispanic or Latino
Geographical mobility - Moved from abroad (%) - American Indian and Alaska Native
Geographical mobility - Moved from abroad (%) - Multirace
Geographical mobility - Moved from abroad (%) - Other Race
Place of birth for the foreign-born population - Ireland (%)
Place of birth for the foreign-born population - Denmark (%)
Place of birth for the foreign-born population - Norway (%)
Place of birth for the foreign-born population - Sweden (%)
Place of birth for the foreign-born population - United Kingdom (%)
Place of birth for the foreign-born population - England (%)
Place of birth for the foreign-born population - Scotland (%)
Place of birth for the foreign-born population - Other Northern Europe (%)
Place of birth for the foreign-born population - Austria (%)
Place of birth for the foreign-born population - Belgium (%)
Place of birth for the foreign-born population - France (%)
Place of birth for the foreign-born population - Germany (%)
Place of birth for the foreign-born population - Netherlands (%)
Place of birth for the foreign-born population - Switzerland (%)
Place of birth for the foreign-born population - Other Western Europe (%)
Place of birth for the foreign-born population - Greece (%)
Place of birth for the foreign-born population - Italy (%)
Place of birth for the foreign-born population - Portugal (%)
Place of birth for the foreign-born population - Spain (%)
Place of birth for the foreign-born population - Other Southern Europe (%)
Place of birth for the foreign-born population - Albania (%)
Place of birth for the foreign-born population - Belarus (%)
Place of birth for the foreign-born population - Bosnia and Herzegovina (%)
Place of birth for the foreign-born population - Bulgaria (%)
Place of birth for the foreign-born population - Croatia (%)
Place of birth for the foreign-born population - Czechoslovakia (%)
Place of birth for the foreign-born population - Hungary (%)
Place of birth for the foreign-born population - Latvia (%)
Place of birth for the foreign-born population - Lithuania (%)
Place of birth for the foreign-born population - North Macedonia (Macedonia) (%)
Place of birth for the foreign-born population - Moldova (%)
Place of birth for the foreign-born population - Poland (%)
Place of birth for the foreign-born population - Romania (%)
Place of birth for the foreign-born population - Russia (%)
Place of birth for the foreign-born population - Serbia (%)
Place of birth for the foreign-born population - Ukraine (%)
Place of birth for the foreign-born population - Other Eastern Europe (%)
Place of birth for the foreign-born population - China (%)
Place of birth for the foreign-born population - Hong Kong (%)
Place of birth for the foreign-born population - Taiwan (%)
Place of birth for the foreign-born population - Japan (%)
Place of birth for the foreign-born population - Korea (%)
Place of birth for the foreign-born population - Other Eastern Asia (%)
Place of birth for the foreign-born population - Afghanistan (%)
Place of birth for the foreign-born population - Bangladesh (%)
Place of birth for the foreign-born population - India (%)
Place of birth for the foreign-born population - Iran (%)
Place of birth for the foreign-born population - Kazakhstan (%)
Place of birth for the foreign-born population - Nepal (%)
Place of birth for the foreign-born population - Pakistan (%)
Place of birth for the foreign-born population - Sri Lanka (%)
Place of birth for the foreign-born population - Uzbekistan (%)
Place of birth for the foreign-born population - Other South Central Asia (%)
Place of birth for the foreign-born population - Burma (%)
Place of birth for the foreign-born population - Cambodia (%)
Place of birth for the foreign-born population - Indonesia (%)
Place of birth for the foreign-born population - Laos (%)
Place of birth for the foreign-born population - Malaysia (%)
Place of birth for the foreign-born population - Philippines (%)
Place of birth for the foreign-born population - Singapore (%)
Place of birth for the foreign-born population - Thailand (%)
Place of birth for the foreign-born population - Vietnam (%)
Place of birth for the foreign-born population - Other South Eastern Asia (%)
Place of birth for the foreign-born population - Armenia (%)
Place of birth for the foreign-born population - Iraq (%)
Place of birth for the foreign-born population - Israel (%)
Place of birth for the foreign-born population - Jordan (%)
Place of birth for the foreign-born population - Kuwait (%)
Place of birth for the foreign-born population - Lebanon (%)
Place of birth for the foreign-born population - Saudi Arabia (%)
Place of birth for the foreign-born population - Syria (%)
Place of birth for the foreign-born population - Turkey (%)
Place of birth for the foreign-born population - Yemen (%)
Place of birth for the foreign-born population - Other Western Asia (%)
Place of birth for the foreign-born population - Eritrea (%)
Place of birth for the foreign-born population - Ethiopia (%)
Place of birth for the foreign-born population - Kenya (%)
Place of birth for the foreign-born population - Somalia (%)
Place of birth for the foreign-born population - Uganda (%)
Place of birth for the foreign-born population - Zimbabwe (%)
Place of birth for the foreign-born population - Other Eastern Africa (%)
Place of birth for the foreign-born population - Cameroon (%)
Place of birth for the foreign-born population - Congo (%)
Place of birth for the foreign-born population - Democratic Republic of Congo (Zaire) (%)
Place of birth for the foreign-born population - Other Middle Africa (%)
Place of birth for the foreign-born population - Egypt (%)
Place of birth for the foreign-born population - Morocco (%)
Place of birth for the foreign-born population - Sudan (%)
Place of birth for the foreign-born population - Other Northern Africa (%)
Place of birth for the foreign-born population - South Africa (%)
Place of birth for the foreign-born population - Other Southern Africa (%)
Place of birth for the foreign-born population - Cabo Verde (%)
Place of birth for the foreign-born population - Ghana (%)
Place of birth for the foreign-born population - Liberia (%)
Place of birth for the foreign-born population - Nigeria (%)
Place of birth for the foreign-born population - Senegal (%)
Place of birth for the foreign-born population - Sierra Leone (%)
Place of birth for the foreign-born population - Other Western Africa (%)
Place of birth for the foreign-born population - Australia (%)
Place of birth for the foreign-born population - New Zealand (%)
Place of birth for the foreign-born population - Fiji (%)
Place of birth for the foreign-born population - Micronesia (%)
Place of birth for the foreign-born population - Bahamas (%)
Place of birth for the foreign-born population - Barbados (%)
Place of birth for the foreign-born population - Cuba (%)
Place of birth for the foreign-born population - Dominica (%)
Place of birth for the foreign-born population - Dominican Republic (%)
Place of birth for the foreign-born population - Grenada (%)
Place of birth for the foreign-born population - Haiti (%)
Place of birth for the foreign-born population - Jamaica (%)
Place of birth for the foreign-born population - St. Vincent and the Grenadines (%)
Place of birth for the foreign-born population - Trinidad and Tobago (%)
Place of birth for the foreign-born population - West Indies (%)
Place of birth for the foreign-born population - Other Caribbean (%)
Place of birth for the foreign-born population - Belize (%)
Place of birth for the foreign-born population - Costa Rica (%)
Place of birth for the foreign-born population - El Salvador (%)
Place of birth for the foreign-born population - Guatemala (%)
Place of birth for the foreign-born population - Honduras (%)
Place of birth for the foreign-born population - Mexico (%)
Place of birth for the foreign-born population - Nicaragua (%)
Place of birth for the foreign-born population - Panama (%)
Place of birth for the foreign-born population - Other Central America (%)
Place of birth for the foreign-born population - Argentina (%)
Place of birth for the foreign-born population - Bolivia (%)
Place of birth for the foreign-born population - Brazil (%)
Place of birth for the foreign-born population - Chile (%)
Place of birth for the foreign-born population - Colombia (%)
Place of birth for the foreign-born population - Ecuador (%)
Place of birth for the foreign-born population - Guyana (%)
Place of birth for the foreign-born population - Peru (%)
Place of birth for the foreign-born population - Uruguay (%)
Place of birth for the foreign-born population - Venezuela (%)
Place of birth for the foreign-born population - Other South America (%)
Place of birth for the foreign-born population - Canada (%)
Place of birth for the foreign-born population - Other Northern America (%)
Place of birth for the foreign-born population - Other (%)
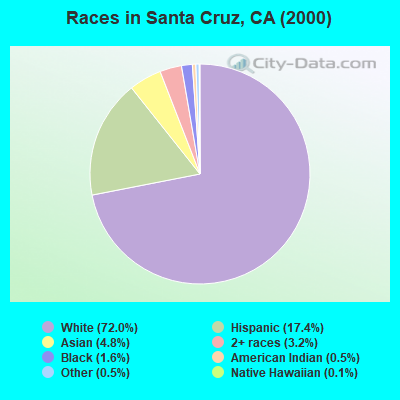
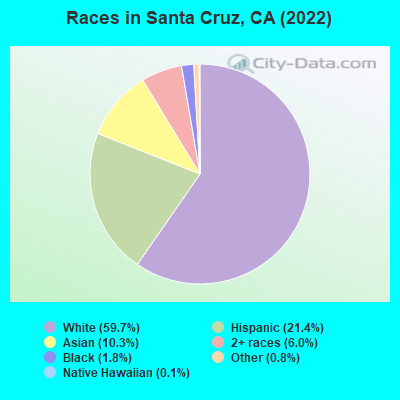
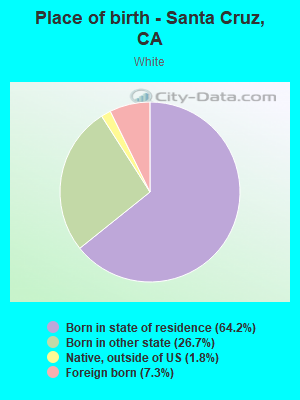
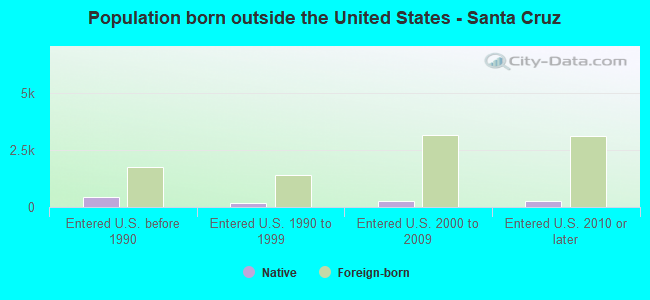
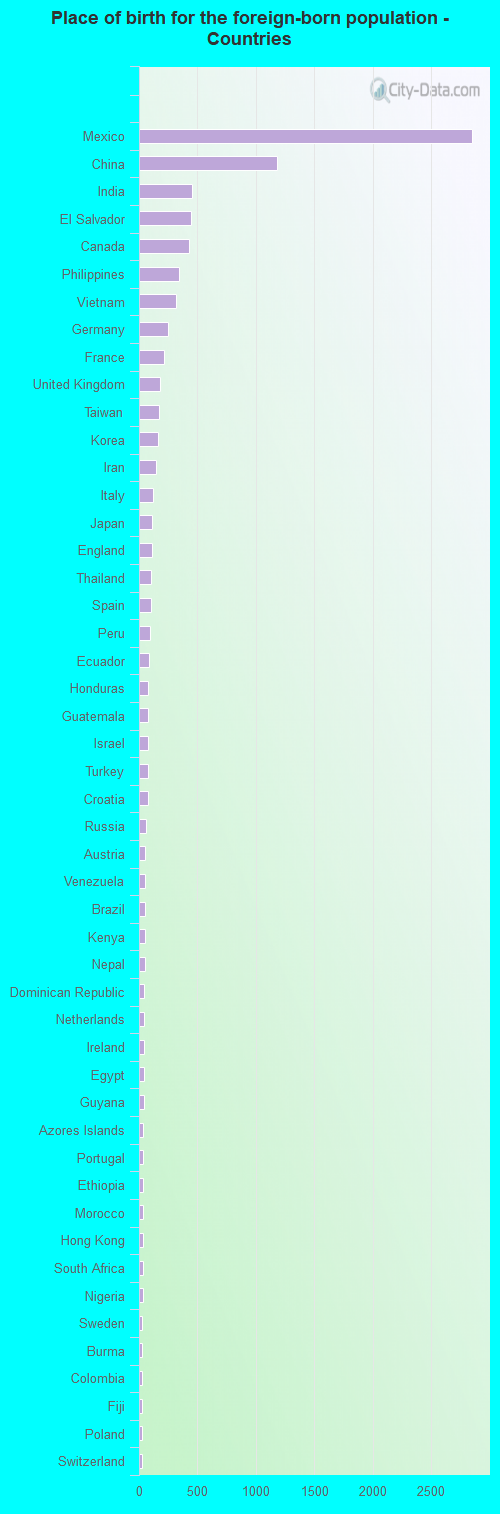
According to 2022 data, the most numerous races in Santa Cruz, CA are Hispanic (16,876 residents), White alone (34,711 residents), and Asian alone (6,671 residents). 74.2% of Santa Cruz residents speak English at home. 14.8% of Santa Cruz, CA residents are foreign-born (6.0% born in Latin America, 5.1% born in Asia, 2.3% born in Europe), which is 75.2% less than the foreign-born rate of 26.0% across the entire state of California.
Race distribution in Santa Cruz
2000 2022
15,816,790 46.7% White alone 10,966,556 32.4% Hispanic 3,648,860 10.8% Asian alone 2,181,926 6.4% Black alone 903,115 2.7% Two or more races 178,984 0.5% American Indian alone 103,736 0.3% Native Hawaiian and Other 71,681 0.2% Other race alone
15,732,184 40.3% Hispanic 13,160,426 33.7% White alone 5,957,867 15.3% Asian alone 2,025,218 5.2% Black alone 1,663,222 4.3% Two or more races 251,618 0.6% Other race alone 135,777 0.3% Native Hawaiian and Other 103,030 0.3% American Indian alone
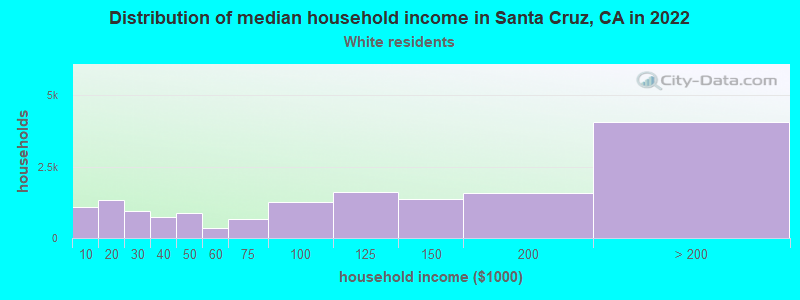
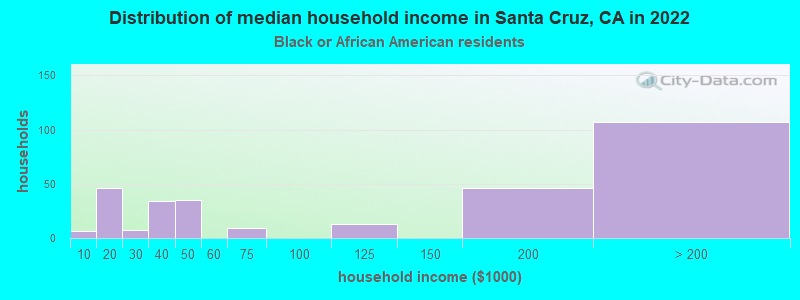
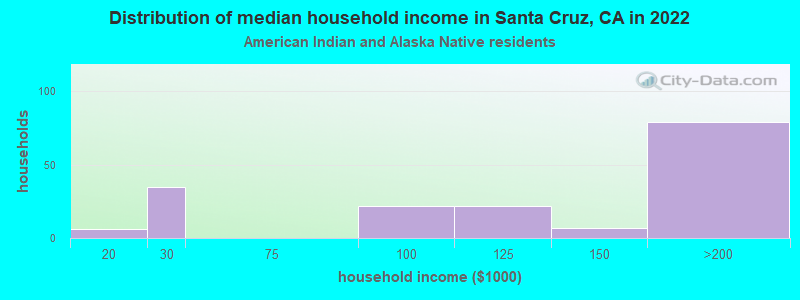
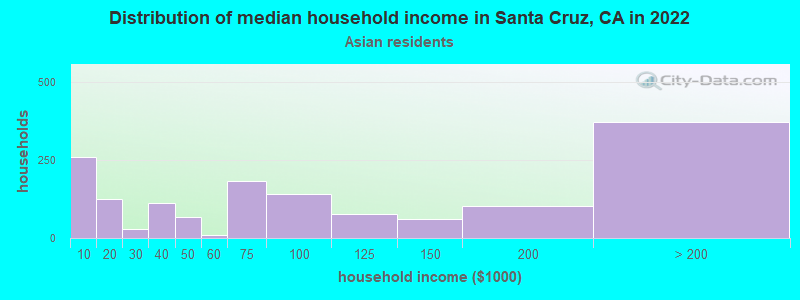
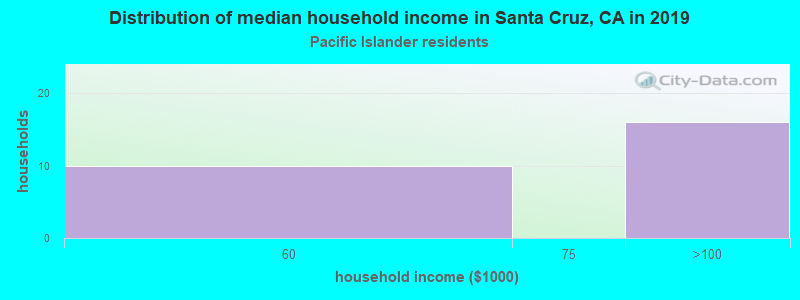
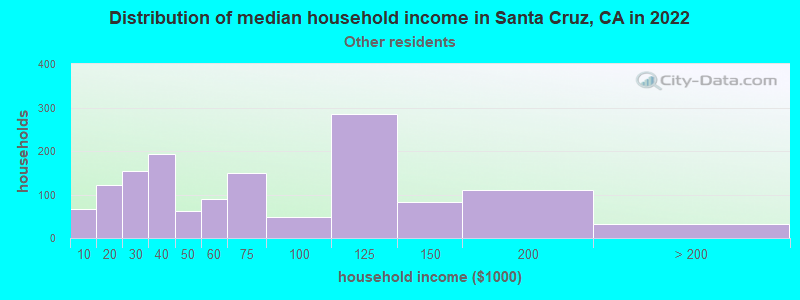
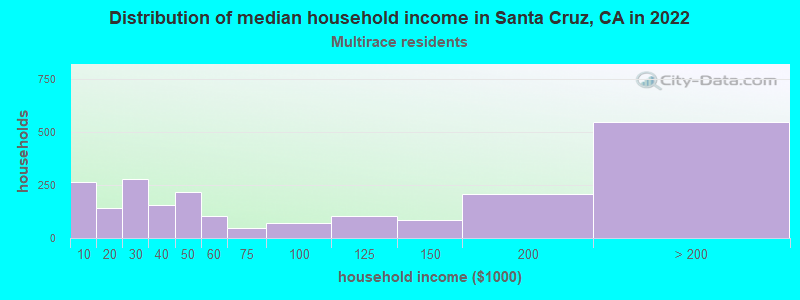
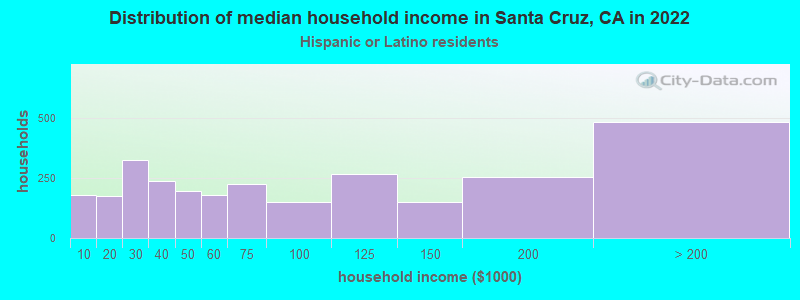
Income and house value in Santa Cruz Median household income in 2022 $109,824 White non-Hispanic householders$67,898 Black householders$26,300 American Indian and Alaska Native householders$109,733 Asian householders$171,598 Native Hawaiian and other Pacific Islander householders$117,210 Some other race householders$91,941 Two or more races householders$104,494 Hispanic or Latino race householdersMedian 2022 house value over $1,000,000 White Non-Hispanic householdersover $1,000,000 Black or African American householdersover $1,000,000 American Indian or Alaska Native householders over $1,000,000 Asian householdersover $1,000,000 Some other race householdersover $1,000,000 Two or more races householdersover $1,000,000 Hispanic or Latino householders
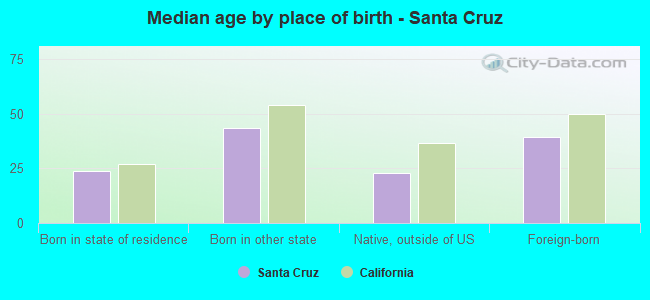
Median age by race in Santa Cruz
32.6 Median age for White residents33.7 32.0 34.2 Median age for Black or African American residents34.7 30.8 33.1 Median age for American Indian / Alaska Native residents44.9 32.4 20.8 Median age for Asian residents20.6 20.9 51.8 Median age for Native Hawaiian / Pacific Islander residents25.7 53.1 24.1 Median age for Other race residents27.8 21.6 28.8 Median age for Two or more races residents29.9 25.5 35.9 Median age for White alone residents37.5 33.4 24.0 Median age for Hispanic or Latino residents26.5 22.5
Owner/renter occupied households by race in Santa Cruz
House owners and renters - White residents 7,262 44.4% Owner occupied9,096 55.6% Renter occupiedHouse owners and renters - Black or African American residents 37 15.2% Owner occupied207 84.8% Renter occupiedHouse owners and renters - American Indian / Alaska Native residents 46 41.4% Owner occupied66 58.6% Renter occupiedHouse owners and renters - Asian residents 453 39.9% Owner occupied682 60.1% Renter occupiedHouse owners and renters - Native Hawaiian / Pacific Islander residents 14 53.4% Owner occupied12 46.6% Renter occupiedHouse owners and renters - Other race residents 139 14.7% Owner occupied804 85.3% Renter occupiedHouse owners and renters - Two or more races residents 899 34.7% Owner occupied1,693 65.3% Renter occupiedHouse owners and renters - White alone residents 7,420 44.7% Owner occupied9,179 55.3% Renter occupiedHouse owners and renters - Hispanic or Latino residents 499 17.1% Owner occupied2,418 82.9% Renter occupied
Language usage in Santa Cruz
English speakers - Total 74.2% of residents of Santa Cruz speak English at home.
14.2% of residents speak Spanish at home 6,652 74.5% Speak English very well2,272 25.5% Speak English less than very well12.1% of residents speak other language at home 6,130 80.3% Speak English very well1,508 19.7% Speak English less than very well
English speakers - Born in the United States 91.5% of residents of Santa Cruz speak English at home.
4.2% of residents speak Spanish at home 432 77.3% Speak English very well127 22.7% Speak English less than very well4.2% of residents speak other language at home 541 97.1% Speak English very well16 2.9% Speak English less than very well
English speakers - Native, born elsewhere 67.8% of residents of Santa Cruz speak English at home.
10.5% of residents speak Spanish at home 147 96.7% Speak English very well5 3.3% Speak English less than very well21.1% of residents speak other language at home 274 90.1% Speak English very well30 9.9% Speak English less than very well
English speakers - Foreign-born 22.4% of residents of Santa Cruz speak English at home.
37.4% of residents speak Spanish at home 1,714 49.0% Speak English very well1,784 51.0% Speak English less than very well42.2% of residents speak other language at home 2,662 67.4% Speak English very well1,289 32.6% Speak English less than very well
White (Caucasian) - Speak only English Native:
90.6% (31,281)Foreign-born:
33.9% (941)
White (Caucasian) - Speak another language Native:
11.1% (3,838)Foreign-born:
70.9% (1,971)
Black or African American - Speak only English Native:
87.8% (986)Foreign-born:
28.6% (47)
Black or African American - Speak another language Native:
13.3% (150)Foreign-born:
71.9% (118)
American Indian / Alaska Native - Speak only English Native:
50.3% (141)Foreign-born:
64.9% (25)
American Indian / Alaska Native - Speak another language Native:
57.8% (162)Foreign-born:
28.0% (11)
Asian - Speak only English Native:
54.7% (2,354)Foreign-born:
11.3% (297)
Asian - Speak another language Native:
45.1% (1,941)Foreign-born:
88.7% (2,331)
Native Hawaiian / Pacific Islander - Speak another language Native:
11.0% (10)Foreign-born:
96.4% (27)
Other race - Speak another language Native:
85.9% (2,953)Foreign-born:
98.4% (1,980)
Two or more races - Speak only English Native:
68.2% (6,377)Foreign-born:
28.5% (507)
Two or more races - Speak another language Native:
23.8% (2,221)Foreign-born:
55.0% (979)
White alone - Speak only English Native:
91.7% (29,062)Foreign-born:
45.4% (1,016)
White alone - Speak another language Native:
8.4% (2,677)Foreign-born:
54.3% (1,217)
Hispanic or Latino - Speak only English Native:
53.9% (6,973)Foreign-born:
0.3% (12)
Hispanic or Latino - Speak another language Native:
47.1% (6,096)Foreign-born:
98.3% (3,482)
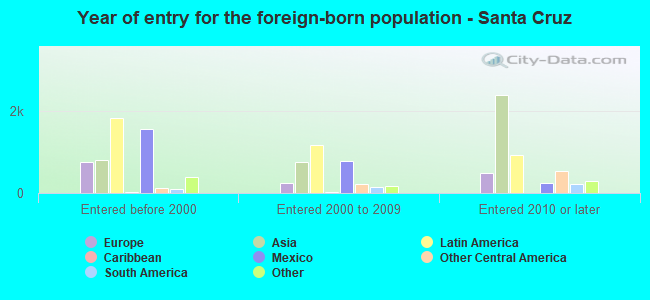
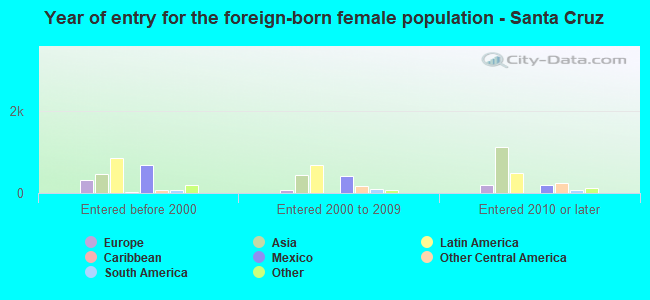
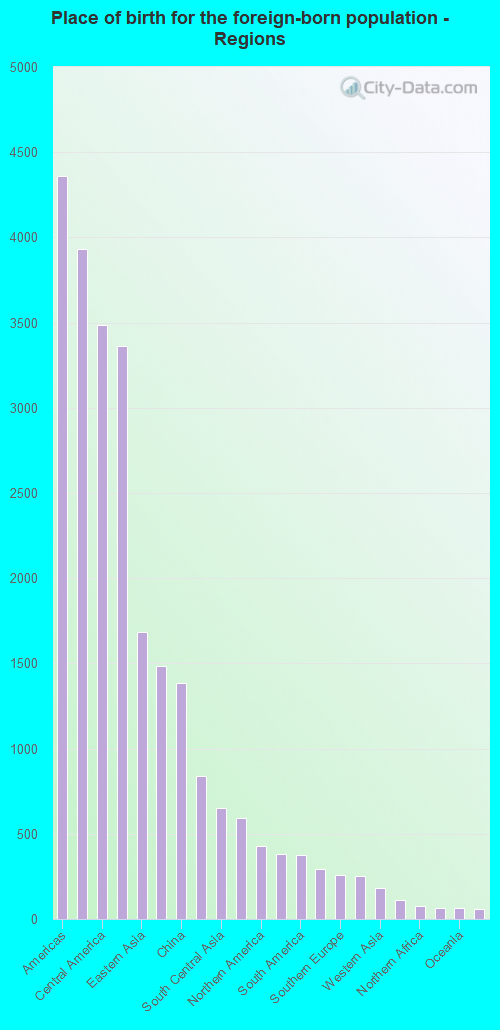
Foreign-born residents in Santa Cruz 9,566 residents are foreign born (6.0% Latin America , 5.1% Asia , 2.3% Europe ).
This city:
14.8%California:
100.0%
Marital status for residents in Santa Cruz Marital status - White (Caucasian) population 15 years and over
Males 55.9% Never married33.5% Now married1.2% Separated0.7% Widowed8.6% DivorcedFemales 55.2% Never married29.1% Now married0.8% Separated4.1% Widowed10.8% DivorcedWomen who gave birth in the past 12 months Now married:
71.8% (181)Unmarried:
28.2% (71)
Women who did not give birth in the past 12 months Now married:
21.0% (2,495)Unmarried:
79.0% (9,398)
Marital status - Black or African American population 15 years and over
Males 78.5% Never married10.6% Now married0.0% Separated0.0% Widowed10.9% DivorcedFemales 67.9% Never married8.2% Now married8.6% Separated3.1% Widowed12.2% DivorcedWomen who did not give birth in the past 12 months Now married:
15.7% (68)Unmarried:
84.3% (364)
Marital status - American Indian / Alaska Native population 15 years and over
Males 41.1% Never married58.9% Now married0.0% Separated0.0% Widowed0.0% DivorcedFemales 51.5% Never married37.3% Now married0.0% Separated0.0% Widowed11.2% DivorcedWomen who did not give birth in the past 12 months Now married:
34.6% (67)Unmarried:
65.4% (126)
Marital status - Asian population 15 years and over
Males 78.7% Never married17.1% Now married0.8% Separated0.2% Widowed3.3% DivorcedFemales 71.0% Never married20.3% Now married0.0% Separated4.3% Widowed4.4% DivorcedWomen who gave birth in the past 12 months Now married:
100.0% (33)Unmarried:
0.0% (0)
Women who did not give birth in the past 12 months Now married:
13.9% (413)Unmarried:
86.1% (2,546)
Marital status - Native Hawaiian / Pacific Islander population 15 years and over
Males 33.3% Never married40.7% Now married25.9% Separated0.0% Widowed0.0% DivorcedFemales 71.3% Never married12.6% Now married0.0% Separated16.1% Widowed0.0% DivorcedWomen who did not give birth in the past 12 months Now married:
0.0% (0)Unmarried:
100.0% (60)
Marital status - Other race population 15 years and over
Males 70.8% Never married24.6% Now married0.6% Separated0.0% Widowed4.0% DivorcedFemales 66.8% Never married22.7% Now married4.2% Separated3.6% Widowed2.7% DivorcedWomen who gave birth in the past 12 months Now married:
100.0% (3)Unmarried:
0.0% (0)
Women who did not give birth in the past 12 months Now married:
27.4% (470)Unmarried:
72.6% (1,246)
Marital status - Two or more races population 15 years and over
Males 81.3% Never married14.7% Now married0.0% Separated2.4% Widowed1.6% DivorcedFemales 65.8% Never married22.2% Now married2.7% Separated0.0% Widowed9.4% DivorcedWomen who did not give birth in the past 12 months Now married:
19.0% (865)Unmarried:
81.0% (3,674)
Marital status - White alone, not Hispanic / Latino population 15 years and over
Males 52.7% Never married35.7% Now married1.5% Separated0.5% Widowed9.5% DivorcedFemales 51.2% Never married30.5% Now married1.0% Separated5.0% Widowed12.3% DivorcedWomen who gave birth in the past 12 months Now married:
100.0% (216)Unmarried:
0.0% (0)
Women who did not give birth in the past 12 months Now married:
20.1% (2,224)Unmarried:
79.9% (8,817)
Marital status - Hispanic or Latino population 15 years and over
Males 68.7% Never married26.1% Now married0.4% Separated0.9% Widowed3.9% DivorcedFemales 64.8% Never married24.5% Now married2.7% Separated2.6% Widowed5.5% DivorcedWomen who gave birth in the past 12 months Now married:
82.2% (61)Unmarried:
17.8% (13)
Women who did not give birth in the past 12 months Now married:
22.9% (1,220)Unmarried:
77.1% (4,106)
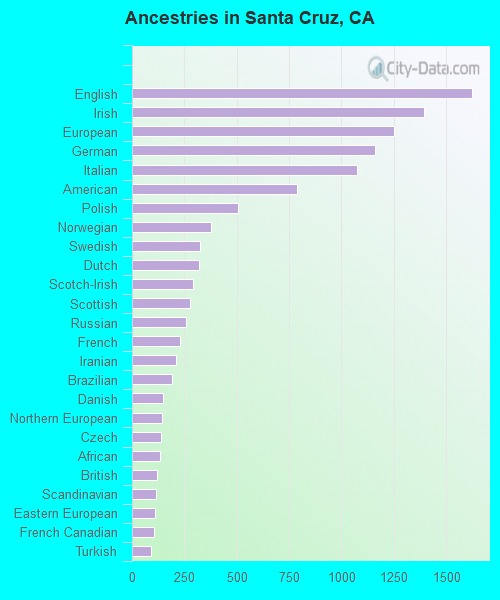
Ancestries in Santa Cruz
2,937 9.8% European1,509 5.0% Irish1,477 4.9% Italian1,241 4.1% English1,013 3.4% German806 2.7% American419 1.4% Norwegian335 1.1% Northern European325 1.1% Scottish312 1.0% Iranian258 0.9% Russian257 0.9% British226 0.8% Portuguese220 0.7% French214 0.7% Polish198 0.7% Scotch-Irish189 0.6% Dutch175 0.6% Eastern European170 0.6% Swedish116 0.4% Scandinavian113 0.4% Turkish107 0.4% Nigerian102 0.3% French Canadian89 0.3% Croatian79 0.3% Danish72 0.2% Afghan71 0.2% Egyptian66 0.2% Armenian64 0.2% African64 0.2% Welsh61 0.2% Moroccan58 0.2% Czech52 0.2% Serbian51 0.2% Hungarian51 0.2% Finnish50 0.2% Icelander49 0.2% Lebanese45 0.1% Canadian45 0.1% Australian42 0.1% West Indian41 0.1% Austrian40 0.1% Ethiopian32 0.1% Belgian30 0.10% Syrian30 0.10% Ukrainian29 0.10% Sierra Leonean28 0.09% Brazilian18 0.06% Estonian15 0.05% Swiss14 0.05% Basque11 0.04% Ghanaian7 0.02% Guyanese6 0.02% Greek6 0.02% Israeli6 0.02% Romanian
Geographical mobility in Santa Cruz Same house 1 year ago 27,969 74.8% White (Caucasian)893 68.0% Black or African American320 82.8% American Indian / Alaska Native3,301 48.1% Asian89 69.8% Native Hawaiian / Pacific Islander3,973 73.9% Other race8,463 74.8% Two or more races29,417 78.3% White alone, not Hispanic / Latino9,561 69.7% Hispanic or LatinoMoved within same county 4,763 12.7% White / Caucasian247 18.8% Black or African American33 8.5% American Indian / Alaska Native748 10.9% Asian19 15.2% Native Hawaiian / Pacific Islander402 7.5% Other race1,023 9.0% Two or more races4,031 10.7% White alone, not Hispanic / Latino1,891 13.8% Hispanic or LatinoMoved within same state 3,000 8.0% White / Caucasian89 6.8% Black or African American35 9.1% American Indian / Alaska Native2,350 34.2% Asian14 11.1% Native Hawaiian / Pacific Islander935 17.4% Other race857 7.6% Two or more races2,872 7.6% White alone, not Hispanic / Latino1,647 12.0% Hispanic or LatinoMoved from different state 1,368 3.7% White / Caucasian25 1.9% Black or African American5 3.6% Native Hawaiian / Pacific Islander333 2.9% Two or more races786 2.1% White alone, not Hispanic / Latino261 1.9% Hispanic or LatinoMoved from abroad 179 0.5% White12 0.9% Black or African American514 7.5% Asian41 0.4% Two or more races221 0.6% White alone, not Hispanic / Latino101 0.7% Hispanic or Latino
Children Nativity (place of birth) in Santa Cruz
Children under 6 years - Living with two parents Both parents native 900 100.0% NativeBoth parents foreign-born 155 100.0% NativeOne native, one foreign-born parent 349 100.0% NativeChildren under 6 years - Living with one parent Native parent 350 100.0% NativeForeign-born parent 178 100.0% NativeChildren 6 to 17 years - Living with two parents Both parents native 2,328 98.3% Native40 1.7% Foreign-bornBoth parents foreign-born 289 63.4% Native166 36.6% Foreign-bornOne native, one foreign-born parent 498 100.0% NativeChildren 6 to 17 years - Living with one parent Native parent 1,374 100.0% NativeForeign-born parent 588 53.3% Native514 46.7% Foreign-born
Place of birth for residents in Santa Cruz
Grandparents responsible for own grandchildren in Santa Cruz
Grandparents (30 to 59 years) White / Caucasian 17 46.3% Responsible for grandchildren20 53.7% Not responsible for grandchildrenNative Hawaiian / Pacific Islander 26 100.0% Not responsible for grandchildrenOther race 102 100.0% Not responsible for grandchildrenWhite alone, not Hispanic / Latino 21 48.3% Responsible for grandchildren23 51.7% Not responsible for grandchildrenHispanic or Latino 65 100.0% Not responsible for grandchildrenGrandparents (60 years and over) White / Caucasian 55 21.5% Responsible for grandchildren202 78.5% Not responsible for grandchildrenOther race 21 100.0% Not responsible for grandchildrenWhite alone, not Hispanic / Latino 70 22.6% Responsible for grandchildren240 77.4% Not responsible for grandchildrenHispanic or Latino 24 25.5% Responsible for grandchildren69 74.5% Not responsible for grandchildren