Races in Santa Teresa, New Mexico (NM) Detailed Stats
Data:
Races - White alone (%)
Races - White alone (% change since 2000)
Races - Black alone (%)
Races - Black alone (% change since 2000)
Races - American Indian alone (%)
Races - American Indian alone (% change since 2000)
Races - Asian alone (%)
Races - Asian alone (% change since 2000)
Races - Hispanic (%)
Races - Hispanic (% change since 2000)
Races - Native Hawaiian and Other Pacific Islander alone (%)
Races - Native Hawaiian and Other Pacific Islander alone (% change since 2000)
Races - Two or more races(%)
Races - Two or more races(% change since 2000)
Races - Other race alone (%)
Races - Other race alone (% change since 2000)
Racial diversity
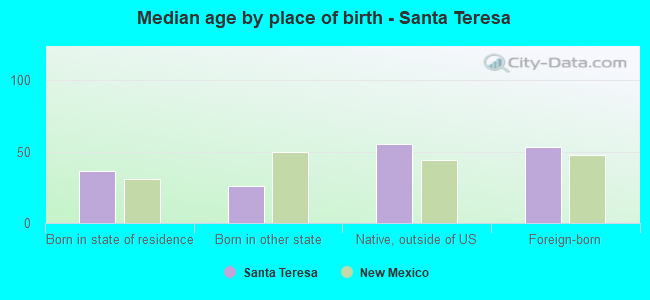
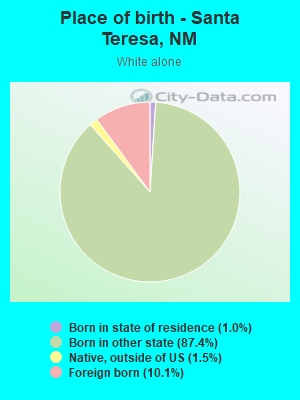
Place of birth - Born in state of residence (%)
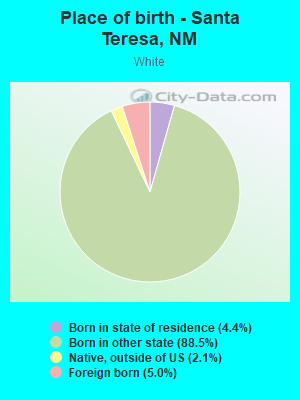
Place of birth - Born in state of residence (%) - White
Place of birth - Born in state of residence (%) - Black or African American
Place of birth - Born in state of residence (%) - Asian
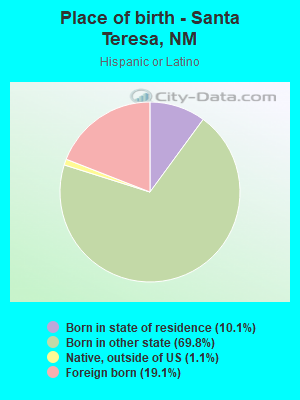
Place of birth - Born in state of residence (%) - Hispanic or Latino
Place of birth - Born in state of residence (%) - American Indian and Alaska Native
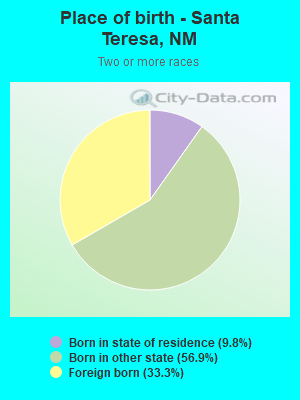
Place of birth - Born in state of residence (%) - Multirace
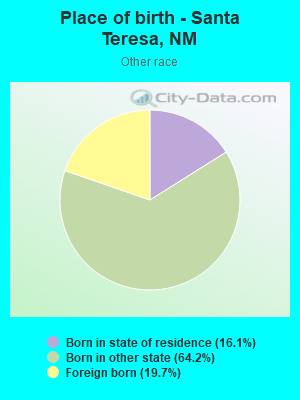
Place of birth - Born in state of residence (%) - Other Race
Place of birth - Born in other state (%)
Place of birth - Born in other state (%) - White
Place of birth - Born in other state (%) - Black or African American
Place of birth - Born in other state (%) - Asian
Place of birth - Born in other state (%) - Hispanic or Latino
Place of birth - Born in other state (%) - American Indian and Alaska Native
Place of birth - Born in other state (%) - Multirace
Place of birth - Born in other state (%) - Other Race
Place of birth - Native, outside of US (%)
Place of birth - Native, outside of US (%) - White
Place of birth - Native, outside of US (%) - Black or African American
Place of birth - Native, outside of US (%) - Asian
Place of birth - Native, outside of US (%) - Hispanic or Latino
Place of birth - Native, outside of US (%) - American Indian and Alaska Native
Place of birth - Native, outside of US (%) - Multirace
Place of birth - Native, outside of US (%) - Other Race
Place of birth - Foreign born (%)
Place of birth - Foreign born (%) - White
Place of birth - Foreign born (%) - Black or African American
Place of birth - Foreign born (%) - Asian
Place of birth - Foreign born (%) - Hispanic or Latino
Place of birth - Foreign born (%) - American Indian and Alaska Native
Place of birth - Foreign born (%) - Multirace
Place of birth - Foreign born (%) - Other Race
Residents speaking English at home (%)
Residents speaking English at home - Born in the United States (%)
Residents speaking English at home - Native, born elsewhere (%)
Residents speaking English at home - Foreign born (%)
Residents speaking Spanish at home (%)
Residents speaking Spanish at home - Born in the United States (%)
Residents speaking Spanish at home - Native, born elsewhere (%)
Residents speaking Spanish at home - Foreign born (%)
Residents speaking other language at home (%)
Residents speaking other language at home - Born in the United States (%)
Residents speaking other language at home - Native, born elsewhere (%)
Residents speaking other language at home - Foreign born (%)
Marital status - Never married (%)
Marital status - Now married (%)
Marital status - Separated (%)
Marital status - Widowed (%)
Marital status - Divorced (%)
Ancestries Reported - Arab (%)
Ancestries Reported - Czech (%)
Ancestries Reported - Danish (%)
Ancestries Reported - Dutch (%)
Ancestries Reported - English (%)
Ancestries Reported - French (%)
Ancestries Reported - French Canadian (%)
Ancestries Reported - German (%)
Ancestries Reported - Greek (%)
Ancestries Reported - Hungarian (%)
Ancestries Reported - Irish (%)
Ancestries Reported - Italian (%)
Ancestries Reported - Lithuanian (%)
Ancestries Reported - Norwegian (%)
Ancestries Reported - Polish (%)
Ancestries Reported - Portuguese (%)
Ancestries Reported - Russian (%)
Ancestries Reported - Scotch-Irish (%)
Ancestries Reported - Scottish (%)
Ancestries Reported - Slovak (%)
Ancestries Reported - Subsaharan African (%)
Ancestries Reported - Swedish (%)
Ancestries Reported - Swiss (%)
Ancestries Reported - Ukrainian (%)
Ancestries Reported - United States (%)
Ancestries Reported - Welsh (%)
Ancestries Reported - West Indian (%)
Ancestries Reported - Other (%)
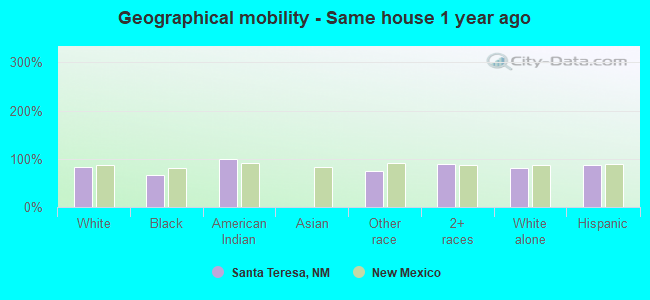
Geographical mobility - Same house 1 year ago (%)
Geographical mobility - Same house 1 year ago (%) - White
Geographical mobility - Same house 1 year ago (%) - Black or African American
Geographical mobility - Same house 1 year ago (%) - Asian
Geographical mobility - Same house 1 year ago (%) - Hispanic or Latino
Geographical mobility - Same house 1 year ago (%) - American Indian and Alaska Native
Geographical mobility - Same house 1 year ago (%) - Multirace
Geographical mobility - Same house 1 year ago (%) - Other Race
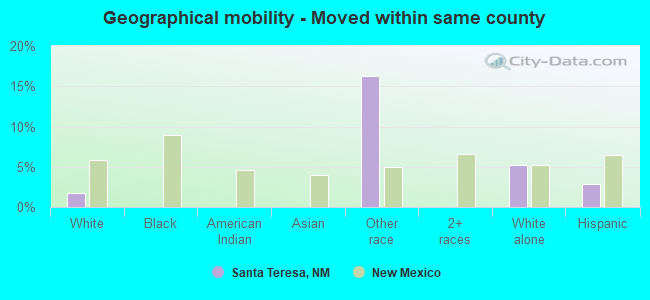
Geographical mobility - Moved within same county (%)
Geographical mobility - Moved within same county (%) - White
Geographical mobility - Moved within same county (%) - Black or African American
Geographical mobility - Moved within same county (%) - Asian
Geographical mobility - Moved within same county (%) - Hispanic or Latino
Geographical mobility - Moved within same county (%) - American Indian and Alaska Native
Geographical mobility - Moved within same county (%) - Multirace
Geographical mobility - Moved within same county (%) - Other Race
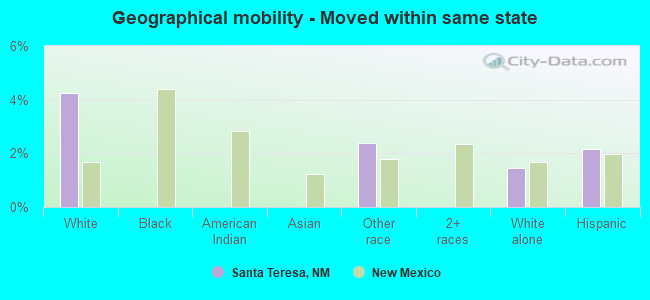
Geographical mobility - Moved from different county within same state (%)
Geographical mobility - Moved from different county within same state (%) - White
Geographical mobility - Moved from different county within same state (%) - Black or African American
Geographical mobility - Moved from different county within same state (%) - Asian
Geographical mobility - Moved from different county within same state (%) - Hispanic or Latino
Geographical mobility - Moved from different county within same state (%) - American Indian and Alaska Native
Geographical mobility - Moved from different county within same state (%) - Multirace
Geographical mobility - Moved from different county within same state (%) - Other Race
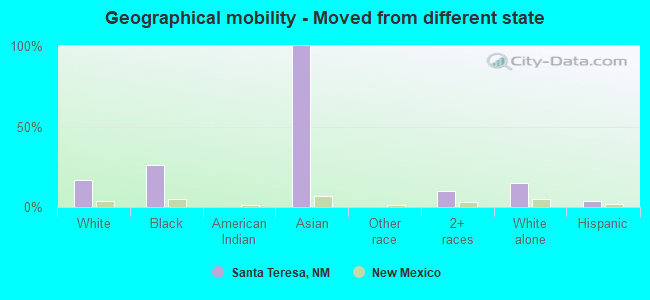
Geographical mobility - Moved from different state (%)
Geographical mobility - Moved from different state (%) - White
Geographical mobility - Moved from different state (%) - Black or African American
Geographical mobility - Moved from different state (%) - Asian
Geographical mobility - Moved from different state (%) - Hispanic or Latino
Geographical mobility - Moved from different state (%) - American Indian and Alaska Native
Geographical mobility - Moved from different state (%) - Multirace
Geographical mobility - Moved from different state (%) - Other Race
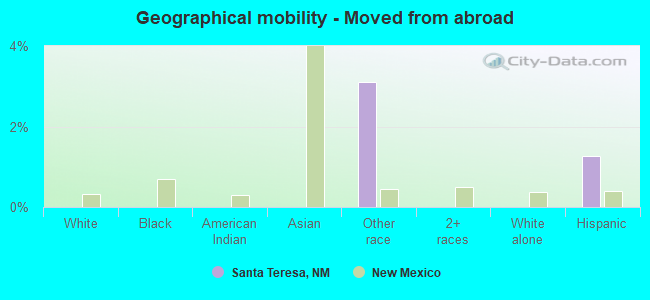
Geographical mobility - Moved from abroad (%)
Geographical mobility - Moved from abroad (%) - White
Geographical mobility - Moved from abroad (%) - Black or African American
Geographical mobility - Moved from abroad (%) - Asian
Geographical mobility - Moved from abroad (%) - Hispanic or Latino
Geographical mobility - Moved from abroad (%) - American Indian and Alaska Native
Geographical mobility - Moved from abroad (%) - Multirace
Geographical mobility - Moved from abroad (%) - Other Race
Place of birth for the foreign-born population - Ireland (%)
Place of birth for the foreign-born population - Denmark (%)
Place of birth for the foreign-born population - Norway (%)
Place of birth for the foreign-born population - Sweden (%)
Place of birth for the foreign-born population - United Kingdom (%)
Place of birth for the foreign-born population - England (%)
Place of birth for the foreign-born population - Scotland (%)
Place of birth for the foreign-born population - Other Northern Europe (%)
Place of birth for the foreign-born population - Austria (%)
Place of birth for the foreign-born population - Belgium (%)
Place of birth for the foreign-born population - France (%)
Place of birth for the foreign-born population - Germany (%)
Place of birth for the foreign-born population - Netherlands (%)
Place of birth for the foreign-born population - Switzerland (%)
Place of birth for the foreign-born population - Other Western Europe (%)
Place of birth for the foreign-born population - Greece (%)
Place of birth for the foreign-born population - Italy (%)
Place of birth for the foreign-born population - Portugal (%)
Place of birth for the foreign-born population - Spain (%)
Place of birth for the foreign-born population - Other Southern Europe (%)
Place of birth for the foreign-born population - Albania (%)
Place of birth for the foreign-born population - Belarus (%)
Place of birth for the foreign-born population - Bosnia and Herzegovina (%)
Place of birth for the foreign-born population - Bulgaria (%)
Place of birth for the foreign-born population - Croatia (%)
Place of birth for the foreign-born population - Czechoslovakia (%)
Place of birth for the foreign-born population - Hungary (%)
Place of birth for the foreign-born population - Latvia (%)
Place of birth for the foreign-born population - Lithuania (%)
Place of birth for the foreign-born population - North Macedonia (Macedonia) (%)
Place of birth for the foreign-born population - Moldova (%)
Place of birth for the foreign-born population - Poland (%)
Place of birth for the foreign-born population - Romania (%)
Place of birth for the foreign-born population - Russia (%)
Place of birth for the foreign-born population - Serbia (%)
Place of birth for the foreign-born population - Ukraine (%)
Place of birth for the foreign-born population - Other Eastern Europe (%)
Place of birth for the foreign-born population - China (%)
Place of birth for the foreign-born population - Hong Kong (%)
Place of birth for the foreign-born population - Taiwan (%)
Place of birth for the foreign-born population - Japan (%)
Place of birth for the foreign-born population - Korea (%)
Place of birth for the foreign-born population - Other Eastern Asia (%)
Place of birth for the foreign-born population - Afghanistan (%)
Place of birth for the foreign-born population - Bangladesh (%)
Place of birth for the foreign-born population - India (%)
Place of birth for the foreign-born population - Iran (%)
Place of birth for the foreign-born population - Kazakhstan (%)
Place of birth for the foreign-born population - Nepal (%)
Place of birth for the foreign-born population - Pakistan (%)
Place of birth for the foreign-born population - Sri Lanka (%)
Place of birth for the foreign-born population - Uzbekistan (%)
Place of birth for the foreign-born population - Other South Central Asia (%)
Place of birth for the foreign-born population - Burma (%)
Place of birth for the foreign-born population - Cambodia (%)
Place of birth for the foreign-born population - Indonesia (%)
Place of birth for the foreign-born population - Laos (%)
Place of birth for the foreign-born population - Malaysia (%)
Place of birth for the foreign-born population - Philippines (%)
Place of birth for the foreign-born population - Singapore (%)
Place of birth for the foreign-born population - Thailand (%)
Place of birth for the foreign-born population - Vietnam (%)
Place of birth for the foreign-born population - Other South Eastern Asia (%)
Place of birth for the foreign-born population - Armenia (%)
Place of birth for the foreign-born population - Iraq (%)
Place of birth for the foreign-born population - Israel (%)
Place of birth for the foreign-born population - Jordan (%)
Place of birth for the foreign-born population - Kuwait (%)
Place of birth for the foreign-born population - Lebanon (%)
Place of birth for the foreign-born population - Saudi Arabia (%)
Place of birth for the foreign-born population - Syria (%)
Place of birth for the foreign-born population - Turkey (%)
Place of birth for the foreign-born population - Yemen (%)
Place of birth for the foreign-born population - Other Western Asia (%)
Place of birth for the foreign-born population - Eritrea (%)
Place of birth for the foreign-born population - Ethiopia (%)
Place of birth for the foreign-born population - Kenya (%)
Place of birth for the foreign-born population - Somalia (%)
Place of birth for the foreign-born population - Uganda (%)
Place of birth for the foreign-born population - Zimbabwe (%)
Place of birth for the foreign-born population - Other Eastern Africa (%)
Place of birth for the foreign-born population - Cameroon (%)
Place of birth for the foreign-born population - Congo (%)
Place of birth for the foreign-born population - Democratic Republic of Congo (Zaire) (%)
Place of birth for the foreign-born population - Other Middle Africa (%)
Place of birth for the foreign-born population - Egypt (%)
Place of birth for the foreign-born population - Morocco (%)
Place of birth for the foreign-born population - Sudan (%)
Place of birth for the foreign-born population - Other Northern Africa (%)
Place of birth for the foreign-born population - South Africa (%)
Place of birth for the foreign-born population - Other Southern Africa (%)
Place of birth for the foreign-born population - Cabo Verde (%)
Place of birth for the foreign-born population - Ghana (%)
Place of birth for the foreign-born population - Liberia (%)
Place of birth for the foreign-born population - Nigeria (%)
Place of birth for the foreign-born population - Senegal (%)
Place of birth for the foreign-born population - Sierra Leone (%)
Place of birth for the foreign-born population - Other Western Africa (%)
Place of birth for the foreign-born population - Australia (%)
Place of birth for the foreign-born population - New Zealand (%)
Place of birth for the foreign-born population - Fiji (%)
Place of birth for the foreign-born population - Micronesia (%)
Place of birth for the foreign-born population - Bahamas (%)
Place of birth for the foreign-born population - Barbados (%)
Place of birth for the foreign-born population - Cuba (%)
Place of birth for the foreign-born population - Dominica (%)
Place of birth for the foreign-born population - Dominican Republic (%)
Place of birth for the foreign-born population - Grenada (%)
Place of birth for the foreign-born population - Haiti (%)
Place of birth for the foreign-born population - Jamaica (%)
Place of birth for the foreign-born population - St. Vincent and the Grenadines (%)
Place of birth for the foreign-born population - Trinidad and Tobago (%)
Place of birth for the foreign-born population - West Indies (%)
Place of birth for the foreign-born population - Other Caribbean (%)
Place of birth for the foreign-born population - Belize (%)
Place of birth for the foreign-born population - Costa Rica (%)
Place of birth for the foreign-born population - El Salvador (%)
Place of birth for the foreign-born population - Guatemala (%)
Place of birth for the foreign-born population - Honduras (%)
Place of birth for the foreign-born population - Mexico (%)
Place of birth for the foreign-born population - Nicaragua (%)
Place of birth for the foreign-born population - Panama (%)
Place of birth for the foreign-born population - Other Central America (%)
Place of birth for the foreign-born population - Argentina (%)
Place of birth for the foreign-born population - Bolivia (%)
Place of birth for the foreign-born population - Brazil (%)
Place of birth for the foreign-born population - Chile (%)
Place of birth for the foreign-born population - Colombia (%)
Place of birth for the foreign-born population - Ecuador (%)
Place of birth for the foreign-born population - Guyana (%)
Place of birth for the foreign-born population - Peru (%)
Place of birth for the foreign-born population - Uruguay (%)
Place of birth for the foreign-born population - Venezuela (%)
Place of birth for the foreign-born population - Other South America (%)
Place of birth for the foreign-born population - Canada (%)
Place of birth for the foreign-born population - Other Northern America (%)
Place of birth for the foreign-born population - Other (%)
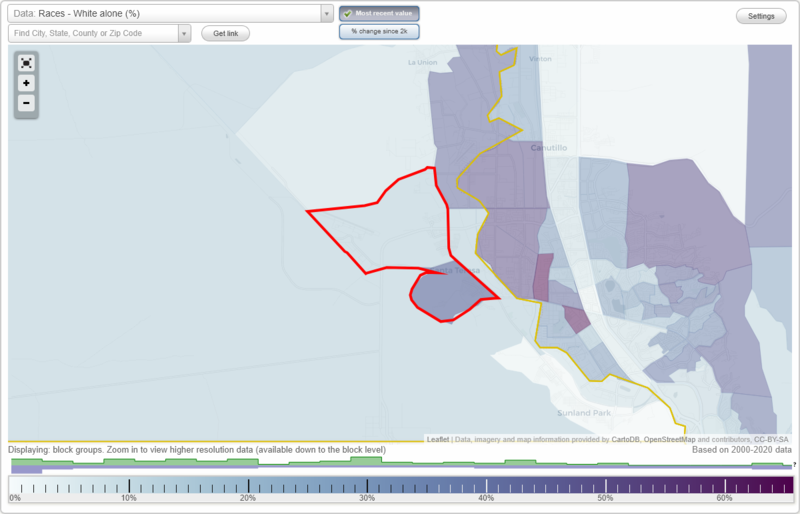
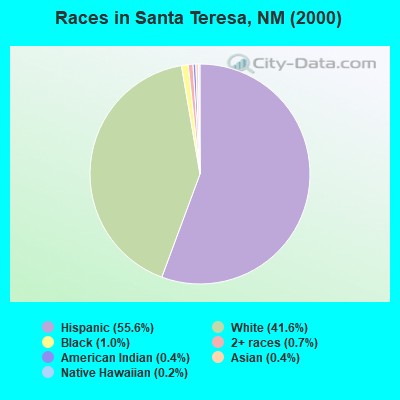
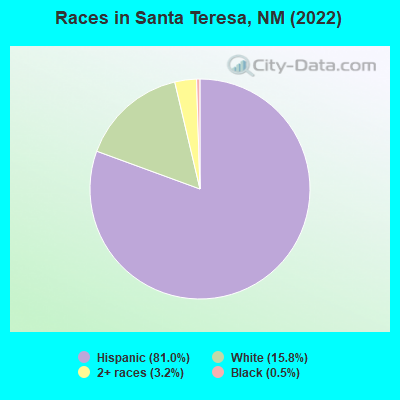
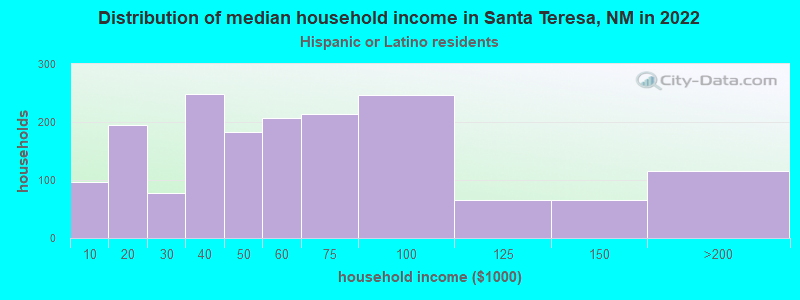
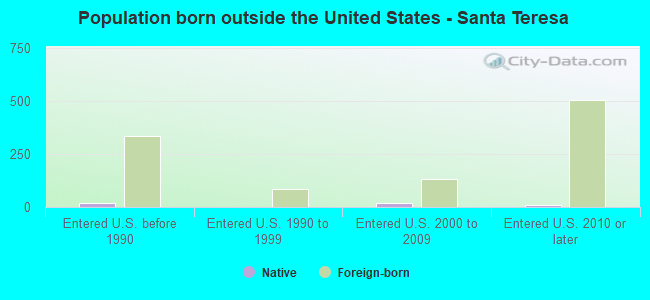
According to 2022 data, the most numerous races in Santa Teresa, NM are Hispanic (5,265 residents), White alone (1,028 residents), and American Indian alone (0 residents). 40.3% of Santa Teresa residents speak English at home. 17.7% of Santa Teresa, NM residents are foreign-born (17.0% born in Latin America), which is 49.2% greater than the foreign-born rate of 9.0% across the entire state of New Mexico.
Race distribution in Santa Teresa
2000 2022
813,495 44.7% White alone 765,386 42.1% Hispanic 161,460 8.9% American Indian alone 30,654 1.7% Black alone 25,793 1.4% Two or more races 18,257 1.0% Asian alone 3,009 0.2% Other race alone 992 0.05% Native Hawaiian and Other
1,059,867 50.2% Hispanic 735,478 34.8% White alone 171,808 8.1% American Indian alone 65,084 3.1% Two or more races 36,870 1.7% Black alone 35,870 1.7% Asian alone 7,582 0.4% Other race alone 785 0.04% Native Hawaiian and Other
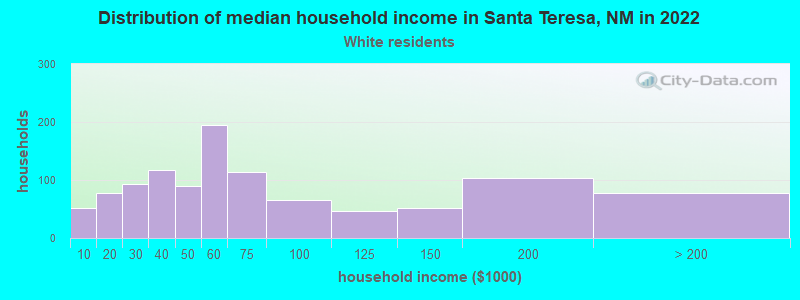
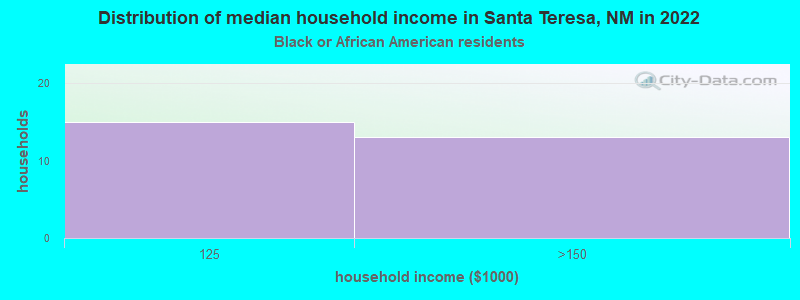
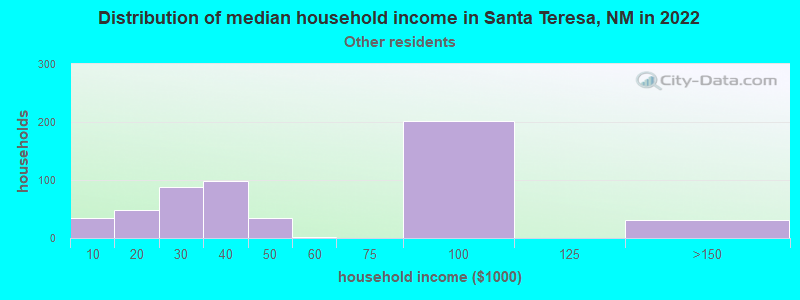
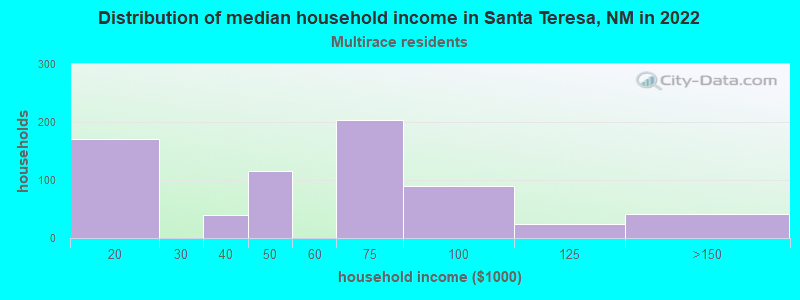
Income and house value in Santa Teresa Median household income in 2022 $58,652 White non-Hispanic householders$57,948 Two or more races householders$56,995 Hispanic or Latino race householdersMedian 2022 house value $289,869 White Non-Hispanic householders$744,891 Black or African American householders$177,071 Some other race householders$170,260 Two or more races householders$177,071 Hispanic or Latino householders
Median age by race in Santa Teresa
35.6 Median age for White residents26.1 43.6 48.7 Median age for Black or African American residents50.6 -500,512,820.0 -713,646,531.7 Median age for American Indian / Alaska Native residents-1,038,413,877.5 -612,560,385.9 27.9 Median age for Asian residents-713,725,489.5 -695,364,237.7 -383,394,383.0 Median age for Native Hawaiian / Pacific Islander residents-685,897,435.2 -663,565,890.8 26.7 Median age for Other race residents27.1 17.5 35.6 Median age for Two or more races residents28.9 55.4 61.3 Median age for White alone residents56.0 72.0 27.9 Median age for Hispanic or Latino residents24.1 34.8
Owner/renter occupied households by race in Santa Teresa
House owners and renters - White residents 738 71.0% Owner occupied301 29.0% Renter occupiedHouse owners and renters - Black or African American residents 25 69.1% Owner occupied11 30.9% Renter occupiedHouse owners and renters - Asian residents 8 100.0% Owner occupiedHouse owners and renters - Other race residents 278 52.6% Owner occupied250 47.4% Renter occupiedHouse owners and renters - Two or more races residents 681 93.2% Owner occupied50 6.8% Renter occupiedHouse owners and renters - White alone residents 537 93.1% Owner occupied40 6.9% Renter occupiedHouse owners and renters - Hispanic or Latino residents 1,116 63.4% Owner occupied643 36.6% Renter occupied
Language usage in Santa Teresa
English speakers - Total 40.3% of residents of Santa Teresa speak English at home.
61.4% of residents speak Spanish at home 1,684 46.2% Speak English very well1,963 53.8% Speak English less than very well0.5% of residents speak other language at home 30 100.0% Speak English very well
English speakers - Born in the United States 50.6% of residents of Santa Teresa speak English at home.
52.2% of residents speak Spanish at home 1,108 49.7% Speak English very well1,123 50.3% Speak English less than very well
English speakers - Native, born elsewhere 39.2% of residents of Santa Teresa speak English at home.
75.9% of residents speak Spanish at home 9 15.0% Speak English very well51 85.0% Speak English less than very well
English speakers - Foreign-born 5.1% of residents of Santa Teresa speak English at home.
91.4% of residents speak Spanish at home 375 37.9% Speak English very well615 62.1% Speak English less than very well2.1% of residents speak other language at home 23 100.0% Speak English very well
White (Caucasian) - Speak only English Native:
57.7% (1,318)Foreign-born:
33.0% (47)
White (Caucasian) - Speak another language Native:
33.9% (774)Foreign-born:
100.0% (141)
Other race - Speak another language Native:
64.9% (674)Foreign-born:
100.0% (290)
Two or more races - Speak another language Native:
53.4% (685)Foreign-born:
96.7% (777)
White alone - Speak only English Native:
83.0% (768)Foreign-born:
63.6% (69)
White alone - Speak another language Native:
18.5% (171)Foreign-born:
43.7% (48)
Hispanic or Latino - Speak only English Native:
36.8% (1,364)Foreign-born:
0.6% (6)
Hispanic or Latino - Speak another language Native:
63.0% (2,339)Foreign-born:
99.5% (980)
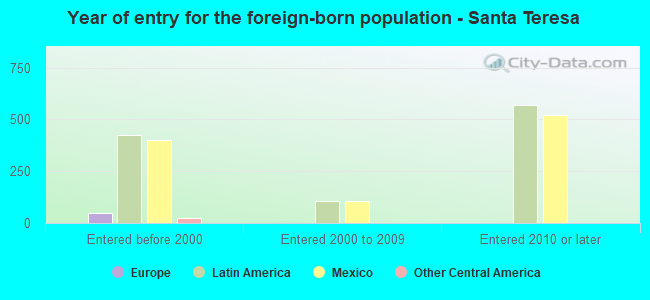
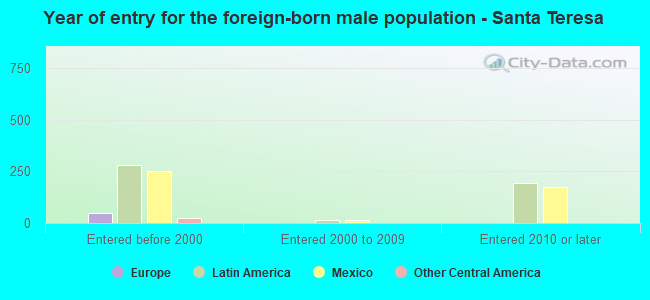
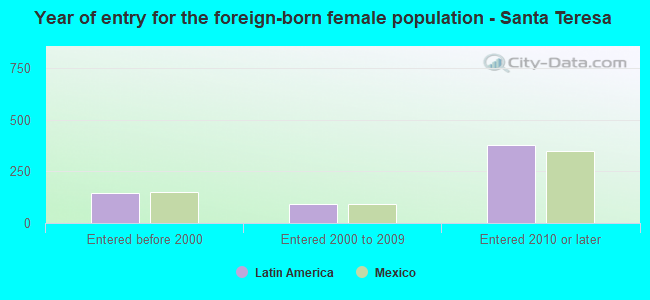
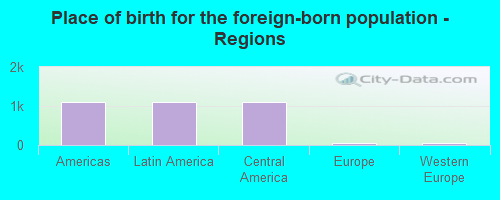
Foreign-born residents in Santa Teresa 1,150 residents are foreign born (17.0% Latin America ).
This city:
17.7%New Mexico:
9.2%
Marital status for residents in Santa Teresa Marital status - White (Caucasian) population 15 years and over
Males 51.7% Never married39.8% Now married0.0% Separated1.9% Widowed6.7% DivorcedFemales 30.1% Never married52.3% Now married0.0% Separated4.4% Widowed13.3% DivorcedWomen who gave birth in the past 12 months Now married:
0.0% (0)Unmarried:
100.0% (47)
Women who did not give birth in the past 12 months Now married:
56.8% (234)Unmarried:
43.2% (178)
Marital status - Asian population 15 years and over
Males 100.0% Never married0.0% Now married0.0% Separated0.0% Widowed0.0% DivorcedFemales 0.0% Never married0.0% Now married0.0% Separated0.0% Widowed100.0% DivorcedWomen who did not give birth in the past 12 months Now married:
0.0% (0)Unmarried:
100.0% (17)
Marital status - Other race population 15 years and over
Males 54.1% Never married36.6% Now married0.0% Separated0.3% Widowed9.0% DivorcedFemales 42.9% Never married49.4% Now married1.3% Separated0.0% Widowed6.5% DivorcedWomen who gave birth in the past 12 months Now married:
14.3% (5)Unmarried:
85.7% (30)
Women who did not give birth in the past 12 months Now married:
49.5% (156)Unmarried:
50.5% (160)
Marital status - Two or more races population 15 years and over
Males 40.5% Never married59.5% Now married0.0% Separated0.0% Widowed0.0% DivorcedFemales 24.7% Never married70.7% Now married0.0% Separated0.0% Widowed4.6% DivorcedWomen who gave birth in the past 12 months Now married:
100.0% (118)Unmarried:
0.0% (0)
Women who did not give birth in the past 12 months Now married:
18.8% (49)Unmarried:
81.2% (213)
Marital status - White alone, not Hispanic / Latino population 15 years and over
Males 27.0% Never married56.2% Now married0.0% Separated3.4% Widowed13.5% DivorcedFemales 7.8% Never married55.2% Now married0.0% Separated5.3% Widowed31.6% DivorcedWomen who did not give birth in the past 12 months Now married:
43.5% (27)Unmarried:
56.5% (35)
Marital status - Hispanic or Latino population 15 years and over
Males 55.3% Never married40.6% Now married0.0% Separated0.7% Widowed3.4% DivorcedFemales 32.9% Never married58.6% Now married0.2% Separated1.9% Widowed6.4% DivorcedWomen who gave birth in the past 12 months Now married:
50.3% (92)Unmarried:
49.7% (91)
Women who did not give birth in the past 12 months Now married:
50.6% (464)Unmarried:
49.4% (453)
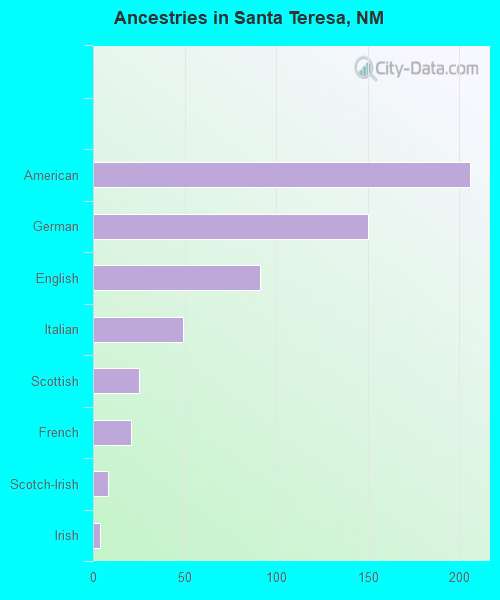
Ancestries in Santa Teresa
206 4.8% American150 3.5% German91 2.1% English49 1.1% Italian25 0.6% Scottish21 0.5% French8 0.2% Scotch-Irish4 0.09% Irish
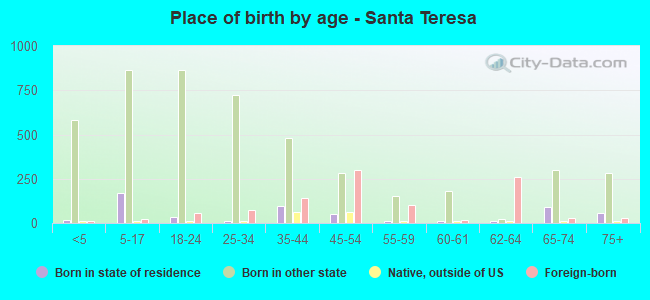
Children Nativity (place of birth) in Santa Teresa
Children under 6 years - Living with two parents One native, one foreign-born parent 381 100.0% NativeChildren under 6 years - Living with one parent Native parent 206 100.0% NativeChildren 6 to 17 years - Living with two parents Both parents native 251 100.0% NativeBoth parents foreign-born 107 80.8% Native25 19.2% Foreign-bornOne native, one foreign-born parent 138 100.0% NativeChildren 6 to 17 years - Living with one parent Native parent 345 100.0% NativeForeign-born parent 103 50.4% Native101 49.6% Foreign-born
Place of birth for residents in Santa Teresa 1,108 Americas1,108 Latin America1,108 Central America41 Europe41 Western Europe
Grandparents responsible for own grandchildren in Santa Teresa
Grandparents (30 to 59 years) Two or more races 64 100.0% Not responsible for grandchildrenHispanic or Latino 121 100.0% Not responsible for grandchildren
Grandparents (60 years and over)