Races in Shaftsbury, Vermont (VT) Detailed Stats
Ancestries, Foreign-born residents, place of birth

Recent posts about races in Shaftsbury, Vermont on our local forum with over 2,400,000 registered users:
 | Bennington, Vermont: Looks nice. What's the catch? (35 replies) |
| Possible Move From Upstate NY To VT (4 replies) |
| Bennington, Vermont area (14 replies) |
| Bennington and surrounding area? (6 replies) |
| Tell me about Bennington, VT (29 replies) |
| Relocation to BENNINGTON/MANCHESTER/DORSET area (39 replies) |
Latest news about races in Shaftsbury, VT collected exclusively by city-data.com from local newspapers, TV, and radio stations
0.6% of Shaftsbury, VT residents are foreign-born , which is 555.1% less than the foreign-born rate of 4.0% across the entire state of Vermont.
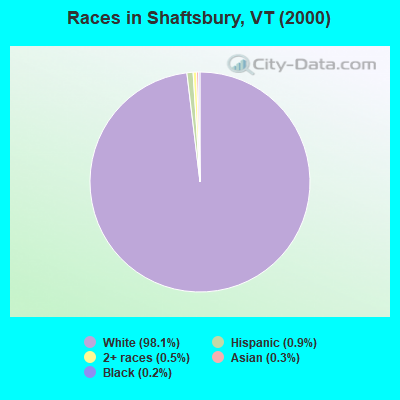
Race distribution in Shaftsbury

- 3,69498.1%White alone
- 340.9%Hispanic
- 190.5%Two or more races
- 110.3%Asian alone
- 70.2%Black alone
- 20.05%American Indian alone
2000
2022
-
- 585,43196.2%White alone
- 6,8091.1%Two or more races
- 5,5040.9%Hispanic
- 5,1600.8%Asian alone
- 2,9210.5%Black alone
- 2,3250.4%American Indian alone
- 5570.09%Other race alone
- 1200.02%Native Hawaiian and Other
Pacific Islander alone

-
- 583,54690.2%White alone
- 27,3404.2%Two or more races
- 14,7702.3%Hispanic
- 11,5121.8%Asian alone
- 6,2641.0%Black alone
- 2,5210.4%Other race alone
- 1,0520.2%American Indian alone
- 590.01%Native Hawaiian and Other
Pacific Islander alone

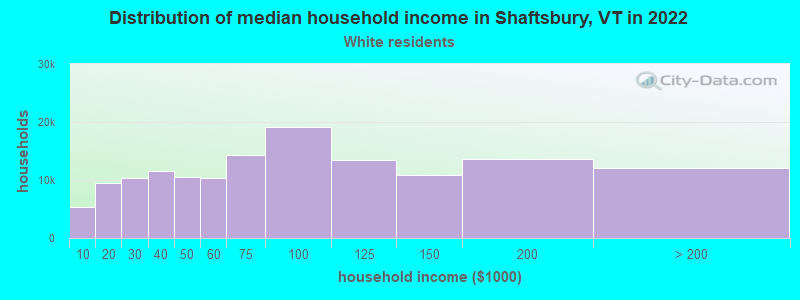
Income and house value in Shaftsbury
- Median household income in 2022
- $81,206White non-Hispanic householders
- Median 2022 house value
- $270,854White Non-Hispanic householders
Household income for White non-Hispanic householders
Foreign-born residents in Shaftsbury
23 residents are foreign born
| This city: | 0.6% |
| Vermont: | 3.8% |
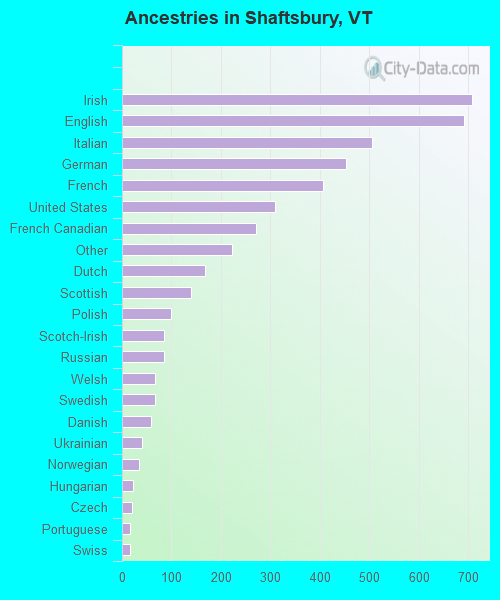
Ancestries in Shaftsbury

- 70715.7%Irish
- 69215.4%English
- 50611.2%Italian
- 45410.1%German
- 4069.0%French
- 3106.9%United States
- 2726.0%French Canadian
- 2235.0%Other
- 1683.7%Dutch
- 1403.1%Scottish
- 992.2%Polish
- 851.9%Scotch-Irish
- 841.9%Russian
- 671.5%Welsh
- 661.5%Swedish
- 591.3%Danish
- 410.9%Ukrainian
- 350.8%Norwegian
- 220.5%Hungarian
- 210.5%Czech
- 170.4%Portuguese
- 170.4%Swiss
- 60.1%Lithuanian
- 50.1%Slovak
Zip codes: 05262.