Races in Silverpeak, Nevada (NV) Detailed Stats
Ancestries, Foreign-born residents, place of birth
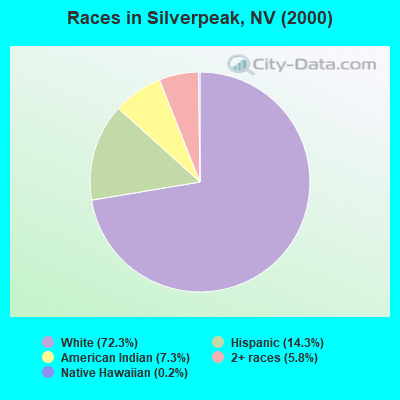
Race distribution in Silverpeak

- 38472.3%White alone
- 7614.3%Hispanic
- 397.3%American Indian alone
- 315.8%Two or more races
- 10.2%Native Hawaiian and Other
Pacific Islander alone
2000
2022
-
- 1,303,00165.2%White alone
- 393,97019.7%Hispanic
- 131,5096.6%Black alone
- 88,5934.4%Asian alone
- 49,2312.5%Two or more races
- 21,3971.1%American Indian alone
- 7,7690.4%Native Hawaiian and Other
Pacific Islander alone - 2,7870.1%Other race alone

-
- 1,410,14544.4%White alone
- 961,35730.3%Hispanic
- 286,4719.0%Black alone
- 281,1498.8%Asian alone
- 182,1515.7%Two or more races
- 20,1020.6%Native Hawaiian and Other
Pacific Islander alone - 18,7810.6%Other race alone
- 17,6160.6%American Indian alone

Income and house value in Silverpeak
- Median household income in 2022
- $68,311White non-Hispanic householders
- $44,566American Indian and Alaska Native householders
- $61,511Some other race householders
- $68,851Two or more races householders
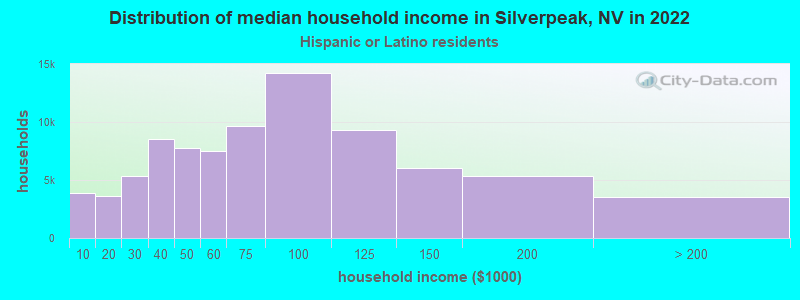
- $73,316Hispanic or Latino race householders
- Median 2022 house value
- $206,185White Non-Hispanic householders
- $244,142American Indian or Alaska Native householders
- $41,002Some other race householders
- $41,002Hispanic or Latino householders
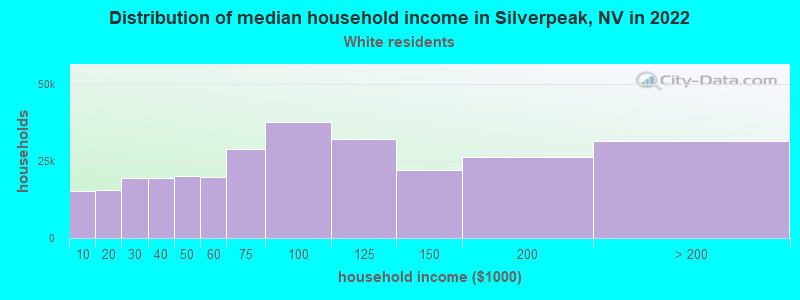
Household income for White non-Hispanic householders
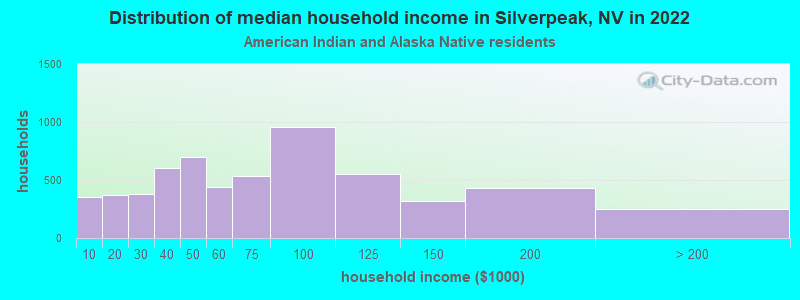
Household income for American Indian and Alaska Native householders
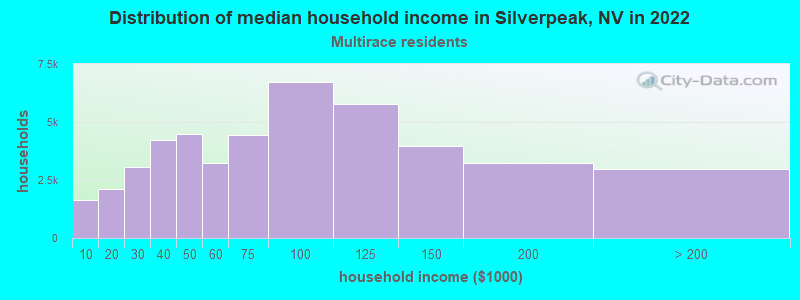
Household income for Two or more races householders
Household income for Hispanic or Latino race householders
Zip code: 89010