Races in Skokie, Illinois (IL) Detailed Stats
Data:
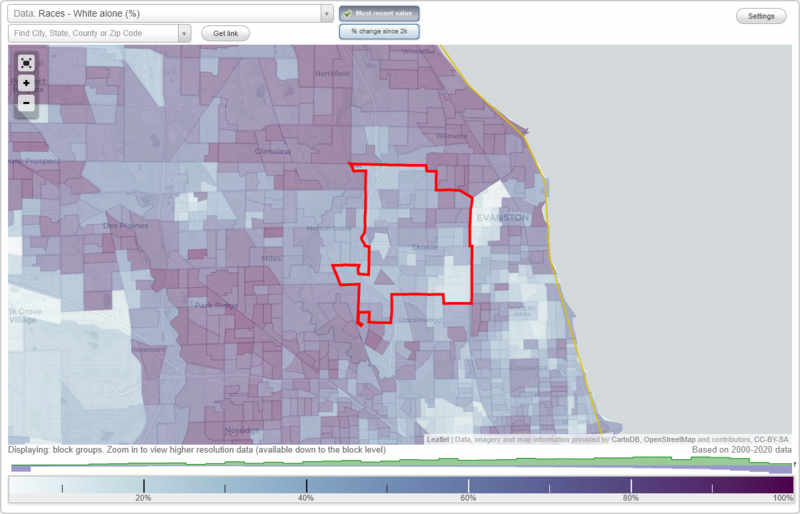
Races - White alone (%)
Races - White alone (% change since 2000)
Races - Black alone (%)
Races - Black alone (% change since 2000)
Races - American Indian alone (%)
Races - American Indian alone (% change since 2000)
Races - Asian alone (%)
Races - Asian alone (% change since 2000)
Races - Hispanic (%)
Races - Hispanic (% change since 2000)
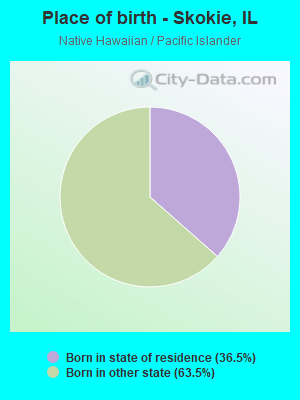
Races - Native Hawaiian and Other Pacific Islander alone (%)
Races - Native Hawaiian and Other Pacific Islander alone (% change since 2000)
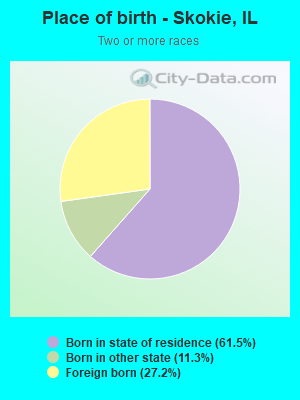
Races - Two or more races(%)
Races - Two or more races(% change since 2000)
Races - Other race alone (%)
Races - Other race alone (% change since 2000)
Racial diversity
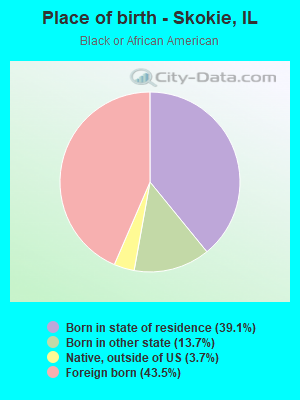
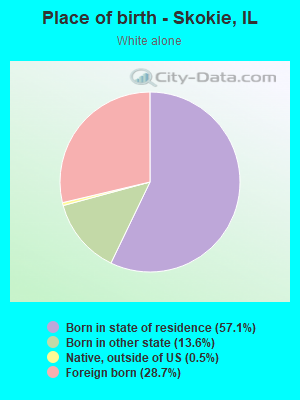
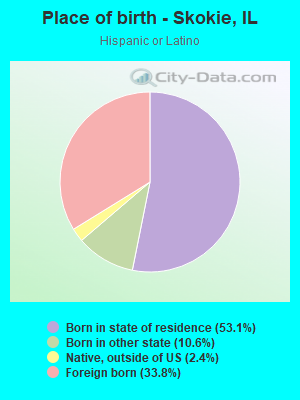
Place of birth - Born in state of residence (%)
Place of birth - Born in state of residence (%) - White
Place of birth - Born in state of residence (%) - Black or African American
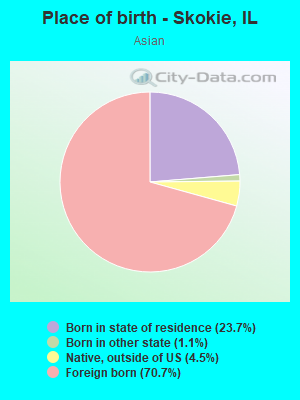
Place of birth - Born in state of residence (%) - Asian
Place of birth - Born in state of residence (%) - Hispanic or Latino
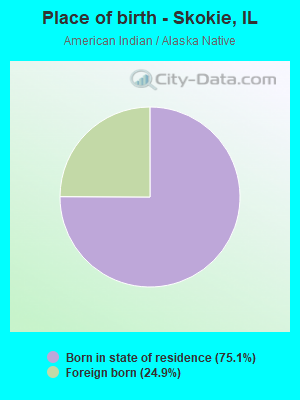
Place of birth - Born in state of residence (%) - American Indian and Alaska Native
Place of birth - Born in state of residence (%) - Multirace
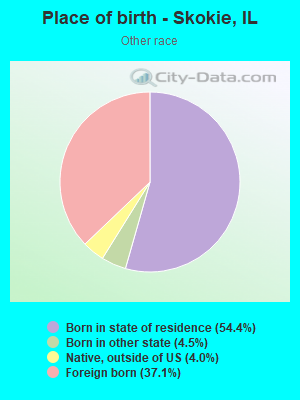
Place of birth - Born in state of residence (%) - Other Race
Place of birth - Born in other state (%)
Place of birth - Born in other state (%) - White
Place of birth - Born in other state (%) - Black or African American
Place of birth - Born in other state (%) - Asian
Place of birth - Born in other state (%) - Hispanic or Latino
Place of birth - Born in other state (%) - American Indian and Alaska Native
Place of birth - Born in other state (%) - Multirace
Place of birth - Born in other state (%) - Other Race
Place of birth - Native, outside of US (%)
Place of birth - Native, outside of US (%) - White
Place of birth - Native, outside of US (%) - Black or African American
Place of birth - Native, outside of US (%) - Asian
Place of birth - Native, outside of US (%) - Hispanic or Latino
Place of birth - Native, outside of US (%) - American Indian and Alaska Native
Place of birth - Native, outside of US (%) - Multirace
Place of birth - Native, outside of US (%) - Other Race
Place of birth - Foreign born (%)
Place of birth - Foreign born (%) - White
Place of birth - Foreign born (%) - Black or African American
Place of birth - Foreign born (%) - Asian
Place of birth - Foreign born (%) - Hispanic or Latino
Place of birth - Foreign born (%) - American Indian and Alaska Native
Place of birth - Foreign born (%) - Multirace
Place of birth - Foreign born (%) - Other Race
Residents speaking English at home (%)
Residents speaking English at home - Born in the United States (%)
Residents speaking English at home - Native, born elsewhere (%)
Residents speaking English at home - Foreign born (%)
Residents speaking Spanish at home (%)
Residents speaking Spanish at home - Born in the United States (%)
Residents speaking Spanish at home - Native, born elsewhere (%)
Residents speaking Spanish at home - Foreign born (%)
Residents speaking other language at home (%)
Residents speaking other language at home - Born in the United States (%)
Residents speaking other language at home - Native, born elsewhere (%)
Residents speaking other language at home - Foreign born (%)
Marital status - Never married (%)
Marital status - Now married (%)
Marital status - Separated (%)
Marital status - Widowed (%)
Marital status - Divorced (%)
Ancestries Reported - Arab (%)
Ancestries Reported - Czech (%)
Ancestries Reported - Danish (%)
Ancestries Reported - Dutch (%)
Ancestries Reported - English (%)
Ancestries Reported - French (%)
Ancestries Reported - French Canadian (%)
Ancestries Reported - German (%)
Ancestries Reported - Greek (%)
Ancestries Reported - Hungarian (%)
Ancestries Reported - Irish (%)
Ancestries Reported - Italian (%)
Ancestries Reported - Lithuanian (%)
Ancestries Reported - Norwegian (%)
Ancestries Reported - Polish (%)
Ancestries Reported - Portuguese (%)
Ancestries Reported - Russian (%)
Ancestries Reported - Scotch-Irish (%)
Ancestries Reported - Scottish (%)
Ancestries Reported - Slovak (%)
Ancestries Reported - Subsaharan African (%)
Ancestries Reported - Swedish (%)
Ancestries Reported - Swiss (%)
Ancestries Reported - Ukrainian (%)
Ancestries Reported - United States (%)
Ancestries Reported - Welsh (%)
Ancestries Reported - West Indian (%)
Ancestries Reported - Other (%)
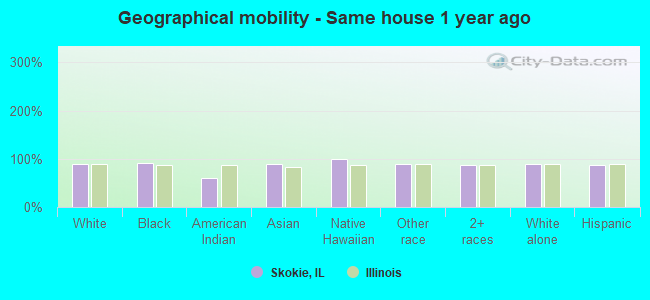
Geographical mobility - Same house 1 year ago (%)
Geographical mobility - Same house 1 year ago (%) - White
Geographical mobility - Same house 1 year ago (%) - Black or African American
Geographical mobility - Same house 1 year ago (%) - Asian
Geographical mobility - Same house 1 year ago (%) - Hispanic or Latino
Geographical mobility - Same house 1 year ago (%) - American Indian and Alaska Native
Geographical mobility - Same house 1 year ago (%) - Multirace
Geographical mobility - Same house 1 year ago (%) - Other Race
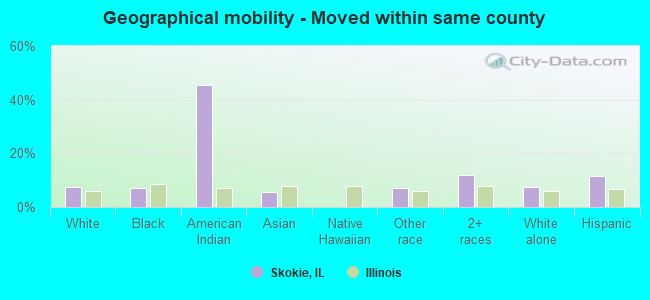
Geographical mobility - Moved within same county (%)
Geographical mobility - Moved within same county (%) - White
Geographical mobility - Moved within same county (%) - Black or African American
Geographical mobility - Moved within same county (%) - Asian
Geographical mobility - Moved within same county (%) - Hispanic or Latino
Geographical mobility - Moved within same county (%) - American Indian and Alaska Native
Geographical mobility - Moved within same county (%) - Multirace
Geographical mobility - Moved within same county (%) - Other Race
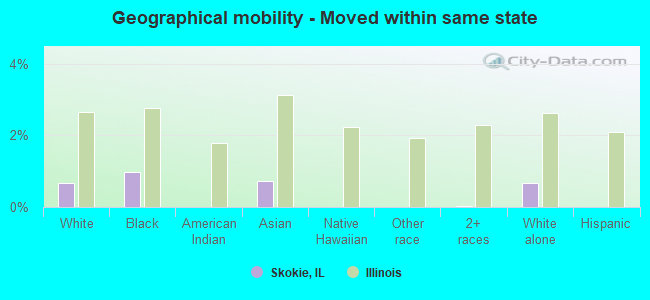
Geographical mobility - Moved from different county within same state (%)
Geographical mobility - Moved from different county within same state (%) - White
Geographical mobility - Moved from different county within same state (%) - Black or African American
Geographical mobility - Moved from different county within same state (%) - Asian
Geographical mobility - Moved from different county within same state (%) - Hispanic or Latino
Geographical mobility - Moved from different county within same state (%) - American Indian and Alaska Native
Geographical mobility - Moved from different county within same state (%) - Multirace
Geographical mobility - Moved from different county within same state (%) - Other Race
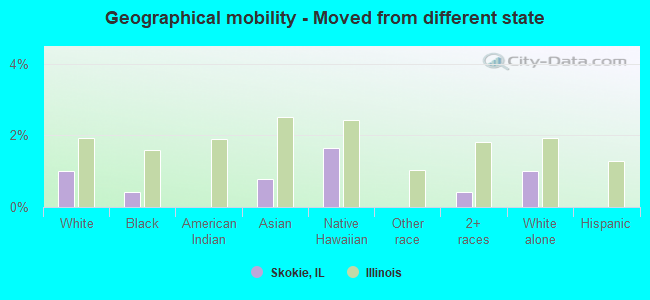
Geographical mobility - Moved from different state (%)
Geographical mobility - Moved from different state (%) - White
Geographical mobility - Moved from different state (%) - Black or African American
Geographical mobility - Moved from different state (%) - Asian
Geographical mobility - Moved from different state (%) - Hispanic or Latino
Geographical mobility - Moved from different state (%) - American Indian and Alaska Native
Geographical mobility - Moved from different state (%) - Multirace
Geographical mobility - Moved from different state (%) - Other Race
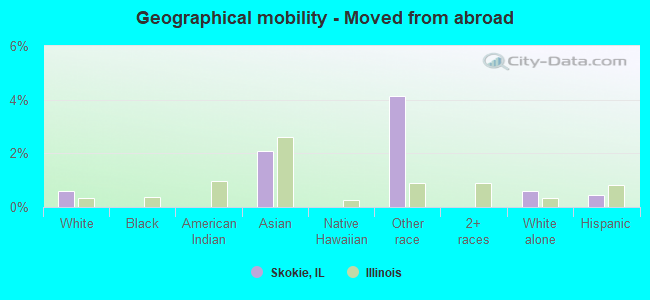
Geographical mobility - Moved from abroad (%)
Geographical mobility - Moved from abroad (%) - White
Geographical mobility - Moved from abroad (%) - Black or African American
Geographical mobility - Moved from abroad (%) - Asian
Geographical mobility - Moved from abroad (%) - Hispanic or Latino
Geographical mobility - Moved from abroad (%) - American Indian and Alaska Native
Geographical mobility - Moved from abroad (%) - Multirace
Geographical mobility - Moved from abroad (%) - Other Race
Place of birth for the foreign-born population - Ireland (%)
Place of birth for the foreign-born population - Denmark (%)
Place of birth for the foreign-born population - Norway (%)
Place of birth for the foreign-born population - Sweden (%)
Place of birth for the foreign-born population - United Kingdom (%)
Place of birth for the foreign-born population - England (%)
Place of birth for the foreign-born population - Scotland (%)
Place of birth for the foreign-born population - Other Northern Europe (%)
Place of birth for the foreign-born population - Austria (%)
Place of birth for the foreign-born population - Belgium (%)
Place of birth for the foreign-born population - France (%)
Place of birth for the foreign-born population - Germany (%)
Place of birth for the foreign-born population - Netherlands (%)
Place of birth for the foreign-born population - Switzerland (%)
Place of birth for the foreign-born population - Other Western Europe (%)
Place of birth for the foreign-born population - Greece (%)
Place of birth for the foreign-born population - Italy (%)
Place of birth for the foreign-born population - Portugal (%)
Place of birth for the foreign-born population - Spain (%)
Place of birth for the foreign-born population - Other Southern Europe (%)
Place of birth for the foreign-born population - Albania (%)
Place of birth for the foreign-born population - Belarus (%)
Place of birth for the foreign-born population - Bosnia and Herzegovina (%)
Place of birth for the foreign-born population - Bulgaria (%)
Place of birth for the foreign-born population - Croatia (%)
Place of birth for the foreign-born population - Czechoslovakia (%)
Place of birth for the foreign-born population - Hungary (%)
Place of birth for the foreign-born population - Latvia (%)
Place of birth for the foreign-born population - Lithuania (%)
Place of birth for the foreign-born population - North Macedonia (Macedonia) (%)
Place of birth for the foreign-born population - Moldova (%)
Place of birth for the foreign-born population - Poland (%)
Place of birth for the foreign-born population - Romania (%)
Place of birth for the foreign-born population - Russia (%)
Place of birth for the foreign-born population - Serbia (%)
Place of birth for the foreign-born population - Ukraine (%)
Place of birth for the foreign-born population - Other Eastern Europe (%)
Place of birth for the foreign-born population - China (%)
Place of birth for the foreign-born population - Hong Kong (%)
Place of birth for the foreign-born population - Taiwan (%)
Place of birth for the foreign-born population - Japan (%)
Place of birth for the foreign-born population - Korea (%)
Place of birth for the foreign-born population - Other Eastern Asia (%)
Place of birth for the foreign-born population - Afghanistan (%)
Place of birth for the foreign-born population - Bangladesh (%)
Place of birth for the foreign-born population - India (%)
Place of birth for the foreign-born population - Iran (%)
Place of birth for the foreign-born population - Kazakhstan (%)
Place of birth for the foreign-born population - Nepal (%)
Place of birth for the foreign-born population - Pakistan (%)
Place of birth for the foreign-born population - Sri Lanka (%)
Place of birth for the foreign-born population - Uzbekistan (%)
Place of birth for the foreign-born population - Other South Central Asia (%)
Place of birth for the foreign-born population - Burma (%)
Place of birth for the foreign-born population - Cambodia (%)
Place of birth for the foreign-born population - Indonesia (%)
Place of birth for the foreign-born population - Laos (%)
Place of birth for the foreign-born population - Malaysia (%)
Place of birth for the foreign-born population - Philippines (%)
Place of birth for the foreign-born population - Singapore (%)
Place of birth for the foreign-born population - Thailand (%)
Place of birth for the foreign-born population - Vietnam (%)
Place of birth for the foreign-born population - Other South Eastern Asia (%)
Place of birth for the foreign-born population - Armenia (%)
Place of birth for the foreign-born population - Iraq (%)
Place of birth for the foreign-born population - Israel (%)
Place of birth for the foreign-born population - Jordan (%)
Place of birth for the foreign-born population - Kuwait (%)
Place of birth for the foreign-born population - Lebanon (%)
Place of birth for the foreign-born population - Saudi Arabia (%)
Place of birth for the foreign-born population - Syria (%)
Place of birth for the foreign-born population - Turkey (%)
Place of birth for the foreign-born population - Yemen (%)
Place of birth for the foreign-born population - Other Western Asia (%)
Place of birth for the foreign-born population - Eritrea (%)
Place of birth for the foreign-born population - Ethiopia (%)
Place of birth for the foreign-born population - Kenya (%)
Place of birth for the foreign-born population - Somalia (%)
Place of birth for the foreign-born population - Uganda (%)
Place of birth for the foreign-born population - Zimbabwe (%)
Place of birth for the foreign-born population - Other Eastern Africa (%)
Place of birth for the foreign-born population - Cameroon (%)
Place of birth for the foreign-born population - Congo (%)
Place of birth for the foreign-born population - Democratic Republic of Congo (Zaire) (%)
Place of birth for the foreign-born population - Other Middle Africa (%)
Place of birth for the foreign-born population - Egypt (%)
Place of birth for the foreign-born population - Morocco (%)
Place of birth for the foreign-born population - Sudan (%)
Place of birth for the foreign-born population - Other Northern Africa (%)
Place of birth for the foreign-born population - South Africa (%)
Place of birth for the foreign-born population - Other Southern Africa (%)
Place of birth for the foreign-born population - Cabo Verde (%)
Place of birth for the foreign-born population - Ghana (%)
Place of birth for the foreign-born population - Liberia (%)
Place of birth for the foreign-born population - Nigeria (%)
Place of birth for the foreign-born population - Senegal (%)
Place of birth for the foreign-born population - Sierra Leone (%)
Place of birth for the foreign-born population - Other Western Africa (%)
Place of birth for the foreign-born population - Australia (%)
Place of birth for the foreign-born population - New Zealand (%)
Place of birth for the foreign-born population - Fiji (%)
Place of birth for the foreign-born population - Micronesia (%)
Place of birth for the foreign-born population - Bahamas (%)
Place of birth for the foreign-born population - Barbados (%)
Place of birth for the foreign-born population - Cuba (%)
Place of birth for the foreign-born population - Dominica (%)
Place of birth for the foreign-born population - Dominican Republic (%)
Place of birth for the foreign-born population - Grenada (%)
Place of birth for the foreign-born population - Haiti (%)
Place of birth for the foreign-born population - Jamaica (%)
Place of birth for the foreign-born population - St. Vincent and the Grenadines (%)
Place of birth for the foreign-born population - Trinidad and Tobago (%)
Place of birth for the foreign-born population - West Indies (%)
Place of birth for the foreign-born population - Other Caribbean (%)
Place of birth for the foreign-born population - Belize (%)
Place of birth for the foreign-born population - Costa Rica (%)
Place of birth for the foreign-born population - El Salvador (%)
Place of birth for the foreign-born population - Guatemala (%)
Place of birth for the foreign-born population - Honduras (%)
Place of birth for the foreign-born population - Mexico (%)
Place of birth for the foreign-born population - Nicaragua (%)
Place of birth for the foreign-born population - Panama (%)
Place of birth for the foreign-born population - Other Central America (%)
Place of birth for the foreign-born population - Argentina (%)
Place of birth for the foreign-born population - Bolivia (%)
Place of birth for the foreign-born population - Brazil (%)
Place of birth for the foreign-born population - Chile (%)
Place of birth for the foreign-born population - Colombia (%)
Place of birth for the foreign-born population - Ecuador (%)
Place of birth for the foreign-born population - Guyana (%)
Place of birth for the foreign-born population - Peru (%)
Place of birth for the foreign-born population - Uruguay (%)
Place of birth for the foreign-born population - Venezuela (%)
Place of birth for the foreign-born population - Other South America (%)
Place of birth for the foreign-born population - Canada (%)
Place of birth for the foreign-born population - Other Northern America (%)
Place of birth for the foreign-born population - Other (%)
Latest news about races in Skokie, IL collected exclusively by city-data.com from local newspapers, TV, and radio stations
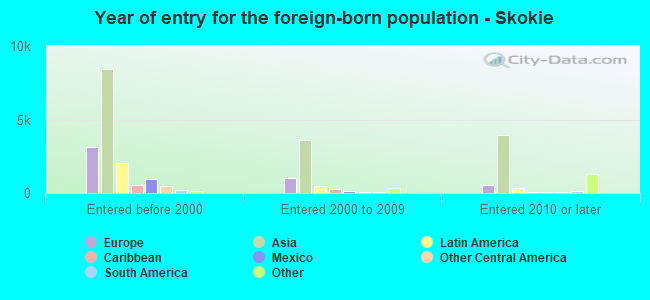
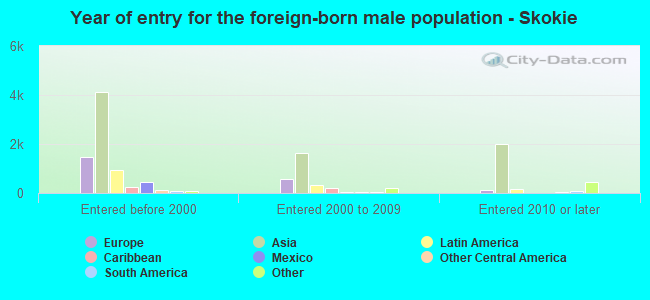
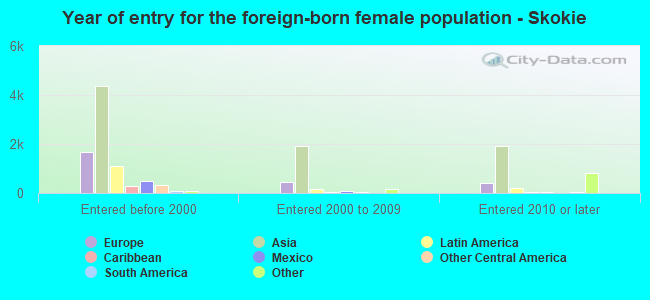
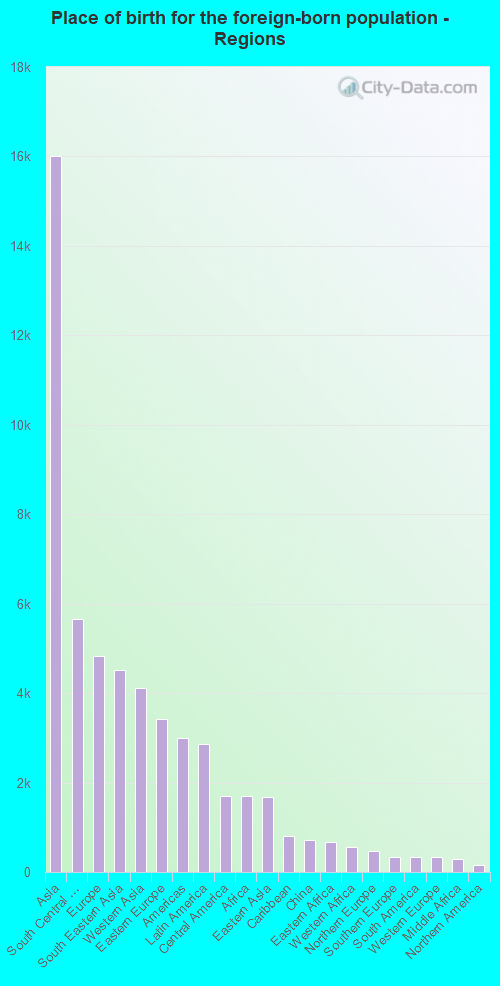
According to 2022 data, the most numerous races in Skokie, IL are White alone (31,598 residents), Hispanic (7,376 residents), and Black alone (5,713 residents). 50.0% of Skokie residents speak English at home. 39.0% of Skokie, IL residents are foreign-born (24.0% born in Asia, 7.2% born in Europe, 4.3% born in Latin America), which is 64.1% greater than the foreign-born rate of 14.0% across the entire state of Illinois.
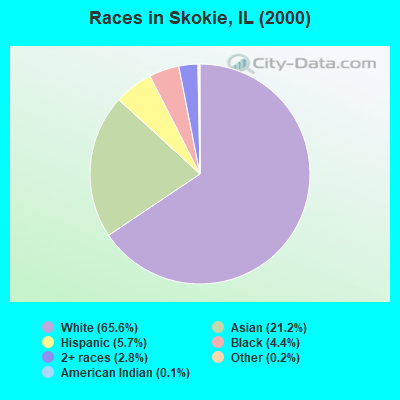
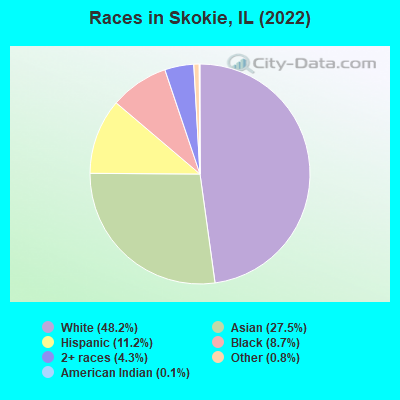
Race distribution in Skokie
2000 2022
41,549 65.6% White alone 13,425 21.2% Asian alone 3,620 5.7% Hispanic 2,798 4.4% Black alone 1,757 2.8% Two or more races 119 0.2% Other race alone 65 0.1% American Indian alone 15 0.02% Native Hawaiian and Other
31,598 48.2% White alone 18,037 27.5% Asian alone 7,376 11.2% Hispanic 5,713 8.7% Black alone 2,840 4.3% Two or more races 527 0.8% Other race alone 89 0.1% American Indian alone 39 0.06% Native Hawaiian and Other
2000 2022
8,424,140 67.8% White alone 1,856,152 14.9% Black alone 1,530,262 12.3% Hispanic 419,916 3.4% Asian alone 153,996 1.2% Two or more races 13,479 0.1% Other race alone 18,232 0.1% American Indian alone 3,116 0.03% Native Hawaiian and Other
7,356,301 58.5% White alone 2,299,726 18.3% Hispanic 1,660,423 13.2% Black alone 747,296 5.9% Asian alone 458,599 3.6% Two or more races 45,386 0.4% Other race alone 10,405 0.08% American Indian alone 3,896 0.03% Native Hawaiian and Other
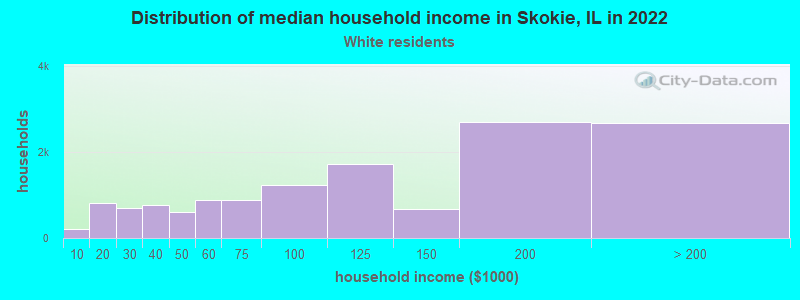
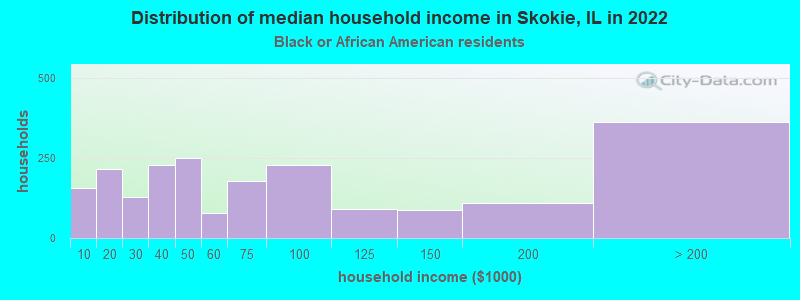
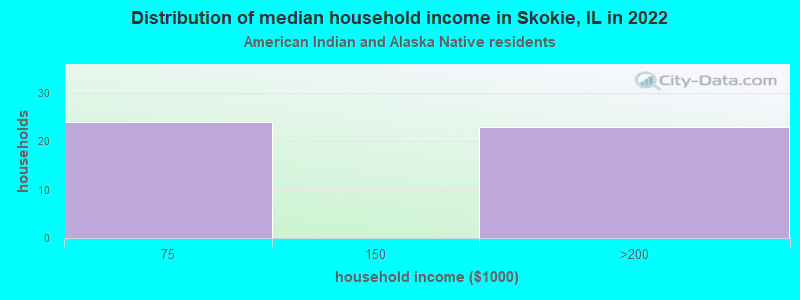
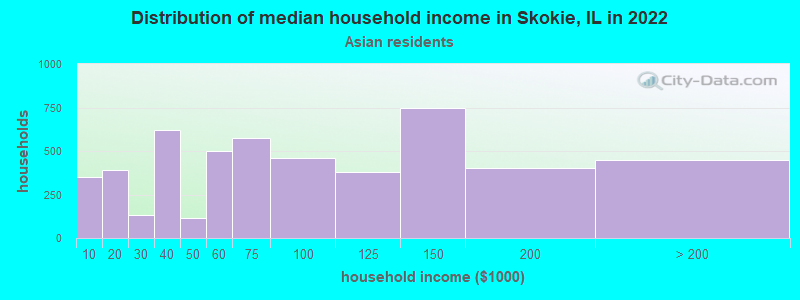
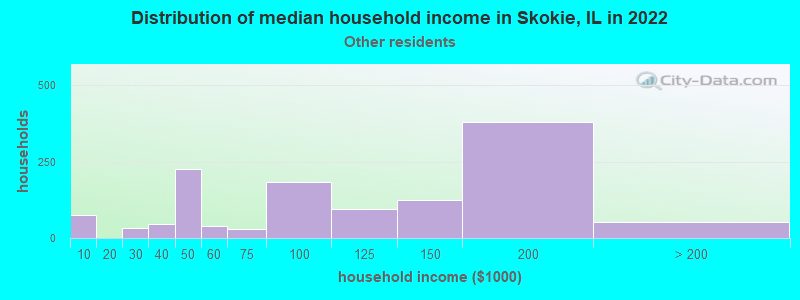
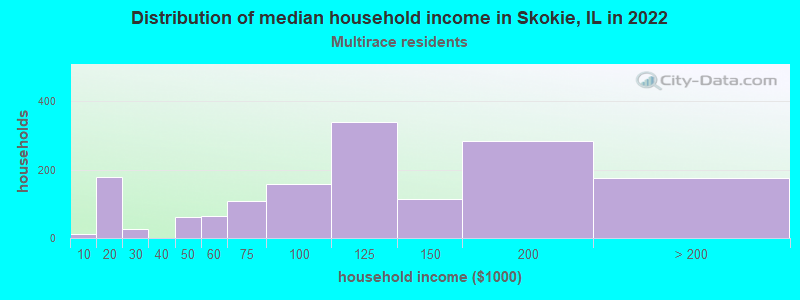
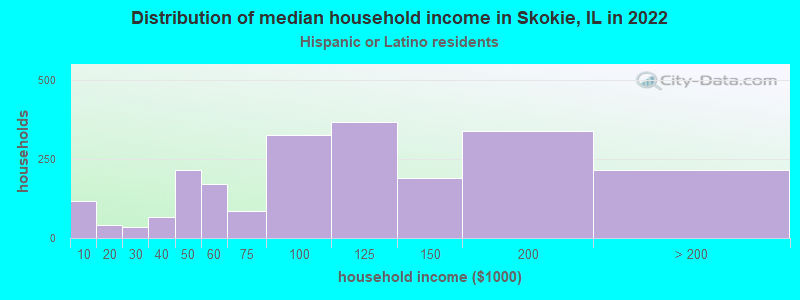
Income and house value in Skokie Median household income in 2022 $110,720 White non-Hispanic householders$73,979 Black householders$66,425 Asian householders$46,324 Some other race householders$145,453 Two or more races householders$50,793 Hispanic or Latino race householdersMedian 2022 house value $377,763 White Non-Hispanic householders$372,985 Black or African American householders$145,030 American Indian or Alaska Native householders $351,145 Asian householders$383,905 Native Hawaiian and other Pacific Islander householders$347,903 Some other race householders$366,160 Two or more races householders$351,316 Hispanic or Latino householders
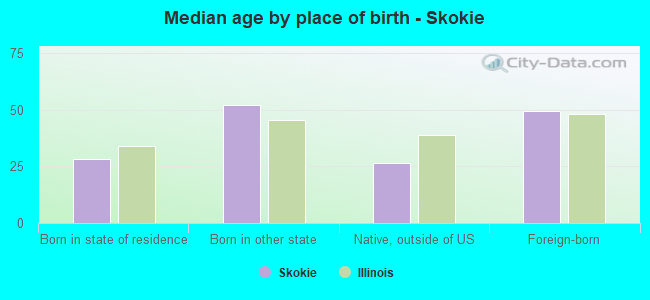
Median age by race in Skokie
45.7 Median age for White residents42.6 46.9 33.9 Median age for Black or African American residents29.8 34.2 -666,666,666.0 Median age for American Indian / Alaska Native residents-666,666,666.0 -666,666,666.0 45.1 Median age for Asian residents43.1 45.9 -666,666,666.0 Median age for Native Hawaiian / Pacific Islander residents-666,666,666.0 -666,666,666.0 35.7 Median age for Other race residents22.5 43.9 32.1 Median age for Two or more races residents27.9 44.0 45.8 Median age for White alone residents43.0 47.0 33.6 Median age for Hispanic or Latino residents27.1 43.2
Owner/renter occupied households by race in Skokie
House owners and renters - White residents 11,426 82.6% Owner occupied2,415 17.4% Renter occupiedHouse owners and renters - Black or African American residents 1,129 49.3% Owner occupied1,162 50.7% Renter occupiedHouse owners and renters - American Indian / Alaska Native residents 26 53.4% Owner occupied23 46.6% Renter occupiedHouse owners and renters - Asian residents 3,488 68.1% Owner occupied1,633 31.9% Renter occupiedHouse owners and renters - Native Hawaiian / Pacific Islander residents 31 100.0% Renter occupiedHouse owners and renters - Other race residents 1,215 81.0% Owner occupied285 19.0% Renter occupiedHouse owners and renters - Two or more races residents 779 65.2% Owner occupied416 34.8% Renter occupiedHouse owners and renters - White alone residents 11,181 82.7% Owner occupied2,332 17.3% Renter occupiedHouse owners and renters - Hispanic or Latino residents 1,728 82.4% Owner occupied368 17.6% Renter occupied
Language usage in Skokie
English speakers - Total 50.0% of residents of Skokie speak English at home.
8.4% of residents speak Spanish at home 4,090 77.7% Speak English very well1,177 22.3% Speak English less than very well41.6% of residents speak other language at home 15,755 60.3% Speak English very well10,354 39.7% Speak English less than very well
English speakers - Born in the United States 86.2% of residents of Skokie speak English at home.
7.0% of residents speak Spanish at home 476 100.0% Speak English very well6.8% of residents speak other language at home 177 38.6% Speak English very well282 61.4% Speak English less than very well
English speakers - Native, born elsewhere 52.4% of residents of Skokie speak English at home.
47.6% of residents speak other language at home 324 62.2% Speak English very well197 37.8% Speak English less than very well
English speakers - Foreign-born 11.0% of residents of Skokie speak English at home.
9.2% of residents speak Spanish at home 1,389 58.2% Speak English very well998 41.8% Speak English less than very well79.8% of residents speak other language at home 11,317 54.6% Speak English very well9,409 45.4% Speak English less than very well
White (Caucasian) - Speak only English Native:
83.2% (19,488)Foreign-born:
7.1% (697)
White (Caucasian) - Speak another language Native:
16.8% (3,934)Foreign-born:
92.9% (9,189)
Black or African American - Speak only English Native:
87.6% (3,077)Foreign-born:
38.6% (1,082)
Black or African American - Speak another language Native:
12.4% (437)Foreign-born:
61.4% (1,721)
American Indian / Alaska Native - Speak another language Native:
59.7% (134)Foreign-born:
100.0% (72)
Asian - Speak only English Native:
54.3% (2,187)Foreign-born:
6.8% (693)
Asian - Speak another language Native:
45.7% (1,843)Foreign-born:
93.2% (9,513)
Other race - Speak only English Native:
55.0% (1,522)Foreign-born:
5.8% (104)
Other race - Speak another language Native:
45.0% (1,247)Foreign-born:
94.2% (1,692)
Two or more races - Speak only English Native:
69.3% (2,979)Foreign-born:
12.7% (160)
Two or more races - Speak another language Native:
29.2% (1,255)Foreign-born:
87.3% (1,099)
White alone - Speak only English Native:
83.3% (18,989)Foreign-born:
6.1% (600)
White alone - Speak another language Native:
16.7% (3,798)Foreign-born:
93.9% (9,189)
Hispanic or Latino - Speak only English Native:
56.1% (2,689)Foreign-born:
10.9% (293)
Hispanic or Latino - Speak another language Native:
43.9% (2,107)Foreign-born:
89.1% (2,387)
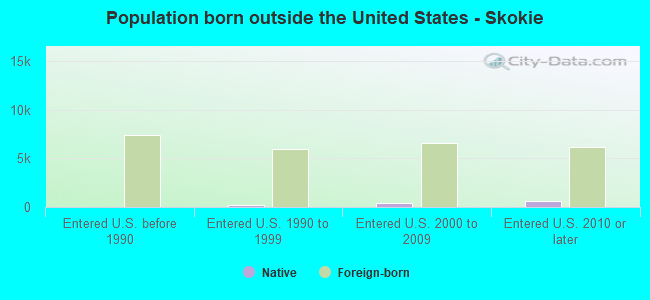
Foreign-born residents in Skokie 25,547 residents are foreign born (24.0% Asia , 7.2% Europe , 4.3% Latin America ).
This city:
39.0%Illinois:
14.1%
Marital status for residents in Skokie Marital status - White (Caucasian) population 15 years and over
Males 27.8% Never married59.2% Now married1.0% Separated6.3% Widowed5.6% DivorcedFemales 29.7% Never married49.9% Now married2.9% Separated10.4% Widowed7.2% DivorcedWomen who gave birth in the past 12 months Now married:
78.5% (194)Unmarried:
21.5% (53)
Women who did not give birth in the past 12 months Now married:
46.7% (3,708)Unmarried:
53.3% (4,226)
Marital status - Black or African American population 15 years and over
Males 36.6% Never married55.8% Now married3.4% Separated0.0% Widowed4.2% DivorcedFemales 42.5% Never married46.1% Now married1.7% Separated2.6% Widowed7.1% DivorcedWomen who gave birth in the past 12 months Now married:
82.7% (63)Unmarried:
17.3% (13)
Women who did not give birth in the past 12 months Now married:
46.4% (592)Unmarried:
53.6% (684)
Marital status - American Indian / Alaska Native population 15 years and over
Males 59.8% Never married14.4% Now married25.8% Separated0.0% Widowed0.0% DivorcedFemales 29.1% Never married45.5% Now married0.0% Separated25.5% Widowed0.0% DivorcedWomen who did not give birth in the past 12 months Now married:
0.0% (0)Unmarried:
100.0% (29)
Marital status - Asian population 15 years and over
Males 33.1% Never married65.0% Now married0.0% Separated1.2% Widowed0.7% DivorcedFemales 29.7% Never married55.7% Now married0.0% Separated8.1% Widowed6.5% DivorcedWomen who gave birth in the past 12 months Now married:
100.0% (329)Unmarried:
0.0% (0)
Women who did not give birth in the past 12 months Now married:
43.2% (1,749)Unmarried:
56.8% (2,301)
Marital status - Native Hawaiian / Pacific Islander population 15 years and over
Males 100.0% Never married0.0% Now married0.0% Separated0.0% Widowed0.0% DivorcedFemales 44.1% Never married0.0% Now married0.0% Separated0.0% Widowed55.9% DivorcedWomen who did not give birth in the past 12 months Now married:
0.0% (0)Unmarried:
100.0% (23)
Marital status - Other race population 15 years and over
Males 57.1% Never married40.5% Now married1.4% Separated0.0% Widowed0.9% DivorcedFemales 26.0% Never married62.5% Now married0.0% Separated0.4% Widowed11.1% DivorcedWomen who gave birth in the past 12 months Now married:
100.0% (7)Unmarried:
0.0% (0)
Women who did not give birth in the past 12 months Now married:
69.7% (418)Unmarried:
30.3% (182)
Marital status - Two or more races population 15 years and over
Males 42.2% Never married45.9% Now married2.4% Separated0.8% Widowed8.8% DivorcedFemales 42.5% Never married41.0% Now married2.1% Separated1.8% Widowed12.6% DivorcedWomen who gave birth in the past 12 months Now married:
100.0% (10)Unmarried:
0.0% (0)
Women who did not give birth in the past 12 months Now married:
37.2% (596)Unmarried:
62.8% (1,006)
Marital status - White alone, not Hispanic / Latino population 15 years and over
Males 27.8% Never married59.1% Now married1.0% Separated6.4% Widowed5.7% DivorcedFemales 29.6% Never married50.2% Now married2.6% Separated10.7% Widowed6.8% DivorcedWomen who gave birth in the past 12 months Now married:
100.0% (194)Unmarried:
0.0% (0)
Women who did not give birth in the past 12 months Now married:
46.1% (3,527)Unmarried:
53.9% (4,127)
Marital status - Hispanic or Latino population 15 years and over
Males 46.1% Never married46.6% Now married1.8% Separated0.0% Widowed5.5% DivorcedFemales 35.0% Never married53.8% Now married1.9% Separated1.8% Widowed7.6% DivorcedWomen who gave birth in the past 12 months Now married:
93.5% (101)Unmarried:
6.5% (7)
Women who did not give birth in the past 12 months Now married:
55.7% (987)Unmarried:
44.3% (787)
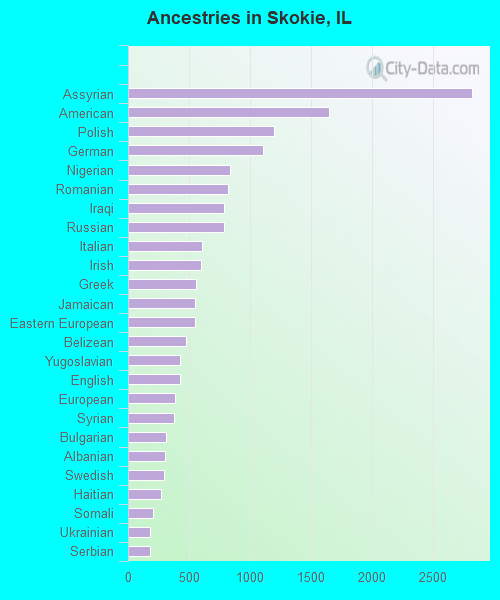
Ancestries in Skokie
2,822 7.2% Assyrian1,650 4.2% American1,199 3.1% Polish1,104 2.8% German835 2.1% Nigerian822 2.1% Romanian790 2.0% Iraqi787 2.0% Russian609 1.6% Italian603 1.5% Irish557 1.4% Greek552 1.4% Jamaican547 1.4% Eastern European478 1.2% Belizean429 1.1% Yugoslavian428 1.1% English385 1.0% European375 1.0% Syrian314 0.8% Bulgarian306 0.8% Albanian292 0.7% Swedish269 0.7% Haitian206 0.5% Somali182 0.5% Ukrainian180 0.5% Serbian178 0.5% Lithuanian167 0.4% Ethiopian150 0.4% Palestinian149 0.4% Croatian132 0.3% Scottish111 0.3% Lebanese95 0.2% Iranian86 0.2% Afghan69 0.2% Czech59 0.2% Arab55 0.1% Israeli52 0.1% Norwegian45 0.1% Guyanese43 0.1% Dutch43 0.1% Hungarian39 0.10% Armenian35 0.09% Finnish34 0.09% Moroccan31 0.08% Turkish31 0.08% Macedonian30 0.08% Austrian27 0.07% African26 0.07% Latvian25 0.06% Portuguese24 0.06% Danish21 0.05% Canadian16 0.04% Egyptian14 0.04% French Canadian14 0.04% Czechoslovakian13 0.03% Sudanese12 0.03% West Indian11 0.03% Luxembourger10 0.03% British7 0.02% Jordanian6 0.02% Belgian6 0.02% Slovak5 0.01% Ghanaian
Geographical mobility in Skokie Same house 1 year ago 27,381 90.0% White (Caucasian)5,311 91.6% Black or African American177 60.1% American Indian / Alaska Native16,132 90.3% Asian63 99.4% Native Hawaiian / Pacific Islander3,108 88.7% Other race5,226 87.0% Two or more races28,255 89.9% White alone, not Hispanic / Latino6,822 87.9% Hispanic or LatinoMoved within same county 2,213 7.3% White / Caucasian409 7.1% Black or African American133 45.3% American Indian / Alaska Native1,002 5.6% Asian251 7.2% Other race706 11.7% Two or more races2,327 7.4% White alone, not Hispanic / Latino901 11.6% Hispanic or LatinoMoved within same state 201 0.7% White / Caucasian56 1.0% Black or African American130 0.7% Asian1 0.0% Two or more races211 0.7% White alone, not Hispanic / LatinoMoved from different state 304 1.0% White / Caucasian25 0.4% Black or African American139 0.8% Asian1 1.7% Native Hawaiian / Pacific Islander25 0.4% Two or more races312 1.0% White alone, not Hispanic / LatinoMoved from abroad 176 0.6% White376 2.1% Asian145 4.2% Other race192 0.6% White alone, not Hispanic / Latino35 0.5% Hispanic or Latino
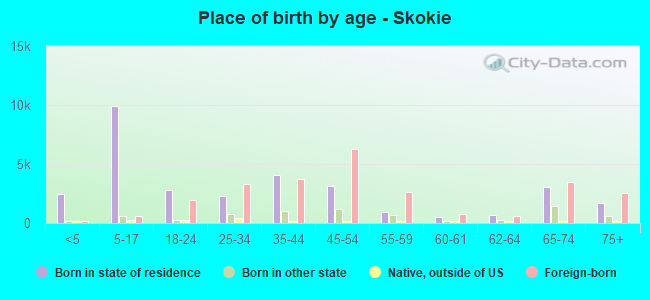
Children Nativity (place of birth) in Skokie
Children under 6 years - Living with two parents Both parents native 1,669 100.0% NativeBoth parents foreign-born 410 78.4% Native113 21.6% Foreign-bornOne native, one foreign-born parent 925 100.0% NativeChildren under 6 years - Living with one parent Native parent 115 100.0% NativeForeign-born parent 127 100.0% NativeChildren 6 to 17 years - Living with two parents Both parents native 3,053 100.0% NativeBoth parents foreign-born 2,747 85.8% Native454 14.2% Foreign-bornOne native, one foreign-born parent 2,100 100.0% NativeChildren 6 to 17 years - Living with one parent Native parent 997 100.0% NativeForeign-born parent 1,185 52.6% Native1,066 47.4% Foreign-born
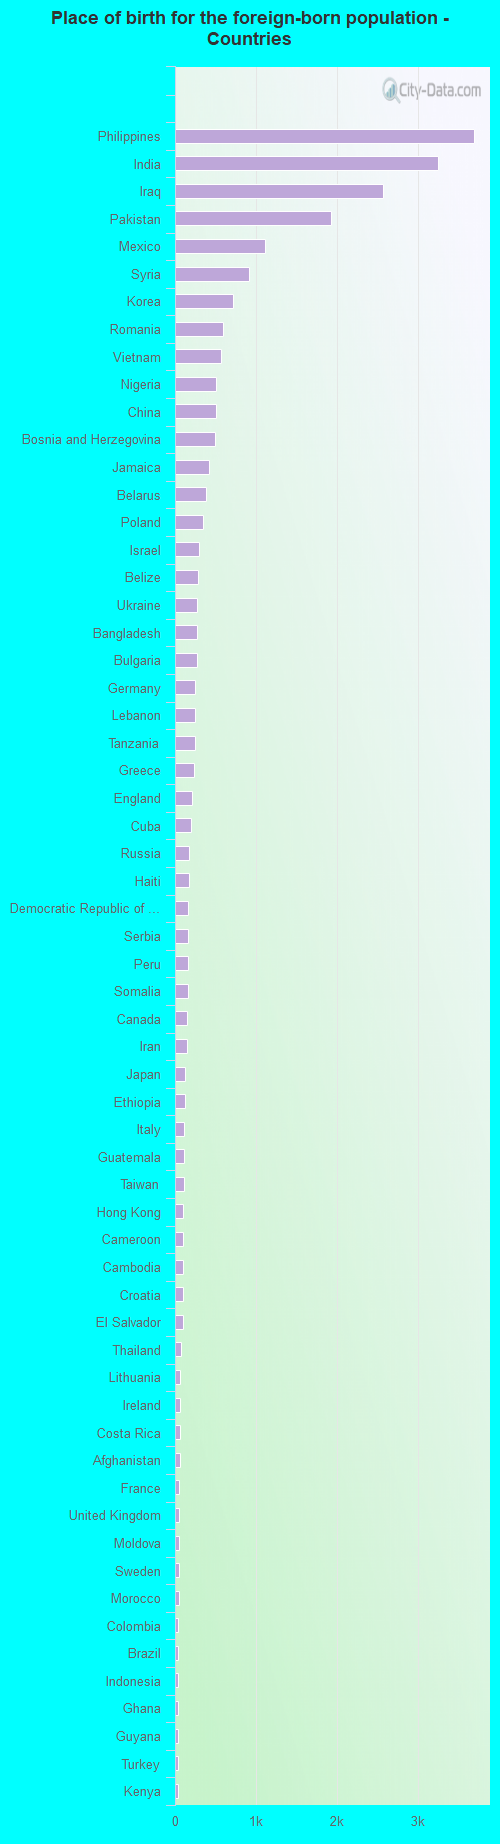
Place of birth for residents in Skokie 16,013 Asia5,658 South Central Asia4,825 Europe4,520 South Eastern Asia4,114 Western Asia3,430 Eastern Europe3,007 Americas2,853 Latin America1,704 Central America1,690 Africa1,678 Eastern Asia807 Caribbean709 China675 Eastern Africa564 Western Africa471 Northern Europe343 Southern Europe341 South America327 Western Europe286 Middle Africa154 Northern America57 Northern Africa8 Oceania8 Australia and New Zealand Subregion3,693 Philippines3,249 India2,567 Iraq1,927 Pakistan1,116 Mexico908 Syria719 Korea588 Romania562 Vietnam506 Nigeria502 China490 Bosnia and Herzegovina422 Jamaica385 Belarus347 Poland292 Israel285 Belize276 Ukraine273 Bangladesh266 Bulgaria251 Germany247 Lebanon243 Tanzania231 Greece212 England200 Cuba174 Russia170 Haiti165 Democratic Republic of Congo (Zaire)163 Serbia162 Peru161 Somalia154 Canada148 Iran120 Japan119 Ethiopia112 Italy107 Guatemala105 Taiwan101 Hong Kong100 Cameroon96 Cambodia95 Croatia93 El Salvador78 Thailand67 Lithuania64 Ireland62 Costa Rica56 Afghanistan50 France50 United Kingdom47 Moldova46 Sweden44 Morocco43 Colombia41 Brazil40 Indonesia38 Ghana36 Guyana36 Turkey34 Kenya33 Jordan28 Denmark28 Scotland27 Eritrea26 Bolivia25 Czechoslovakia25 Zimbabwe24 Latvia24 Albania24 Malaysia23 Honduras22 Venezuela20 Congo20 Saudi Arabia18 Ivory Coast17 Austria15 Panama12 Egypt12 Burma (Myanmar)10 Laos9 Uganda8 Australia7 Chile6 Belgium6 United Arab Emirates3 Kazakhstan
Grandparents responsible for own grandchildren in Skokie
Grandparents (30 to 59 years) Black or African American 12 32.0% Responsible for grandchildren26 68.0% Not responsible for grandchildrenAsian 57 34.2% Responsible for grandchildren109 65.8% Not responsible for grandchildrenOther race 12 100.0% Responsible for grandchildrenTwo or more races 23 100.0% Not responsible for grandchildrenHispanic or Latino 8 100.0% Responsible for grandchildrenGrandparents (60 years and over) Black or African American 67 100.0% Not responsible for grandchildrenAsian 666 100.0% Not responsible for grandchildrenOther race 8 51.7% Responsible for grandchildren8 48.3% Not responsible for grandchildrenTwo or more races 15 100.0% Not responsible for grandchildrenHispanic or Latino 9 11.8% Responsible for grandchildren66 88.2% Not responsible for grandchildren