Races in Southampton, New York (NY) Detailed Stats
Ancestries, Foreign-born residents, place of birth
Settings
X


Recent posts about races in Southampton, New York on our local forum with over 2,400,000 registered users:
 | Upper Middle class african-american communities in ny (2034 replies) |
| smaller Upstate NY cities and towns/African American communities (5949 replies) |
| What makes Long Island worth it? (523 replies) |
| Hamptons Bachelorette (33 replies) |
| Official Coronavirus Thread (any other threads made about coronavirus will be closed) (4892 replies) |
| Eastport South Manor & Center Moriches SD (3 replies) |
Latest news about races in Southampton, NY collected exclusively by city-data.com from local newspapers, TV, and radio stations
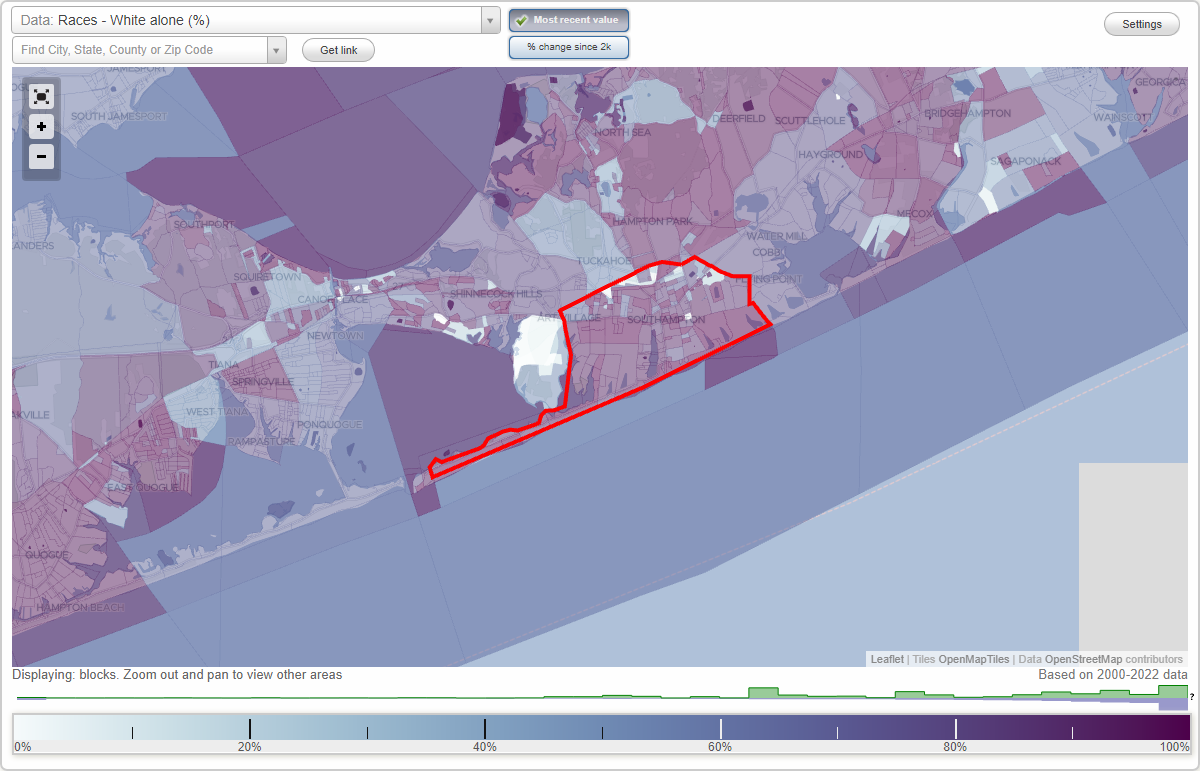
According to 2022 data, the most numerous races in Southampton, NY are White alone (3,154 residents), Hispanic (745 residents), and Black alone (252 residents). 73.6% of Southampton residents speak English at home. 21.7% of Southampton, NY residents are foreign-born (8.1% born in Europe, 7.3% born in Latin America, 5.6% born in Asia), which is about the same as the foreign-born rate of 22.0% across the entire state of New York.
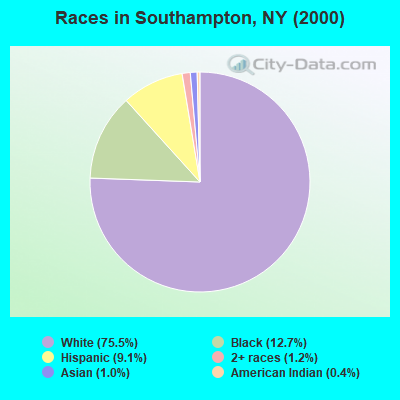
Race distribution in Southampton
2000
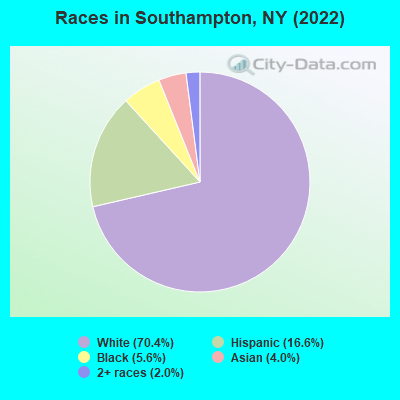
2022

- 2,99475.5%White alone
- 50212.7%Black alone
- 3599.1%Hispanic
- 481.2%Two or more races
- 411.0%Asian alone
- 170.4%American Indian alone
- 30.08%Other race alone
- 10.03%Native Hawaiian and Other
Pacific Islander alone
-
- 3,15470.4%White alone
- 74516.6%Hispanic
- 2525.6%Black alone
- 1804.0%Asian alone
- 912.0%Two or more races
- 20.04%American Indian alone
2000
2022
-
- 11,760,98162.0%White alone
- 2,867,58315.1%Hispanic
- 2,812,62314.8%Black alone
- 1,035,9265.5%Asian alone
- 366,1161.9%Two or more races
- 75,4990.4%Other race alone
- 52,4990.3%American Indian alone
- 5,2300.03%Native Hawaiian and Other
Pacific Islander alone

-
- 10,408,93352.9%White alone
- 3,867,29919.7%Hispanic
- 2,633,84013.4%Black alone
- 1,776,2869.0%Asian alone
- 732,6703.7%Two or more races
- 216,1101.1%Other race alone
- 35,0820.2%American Indian alone
- 6,9310.04%Native Hawaiian and Other
Pacific Islander alone

Income and house value in Southampton
- Median household income in 2022
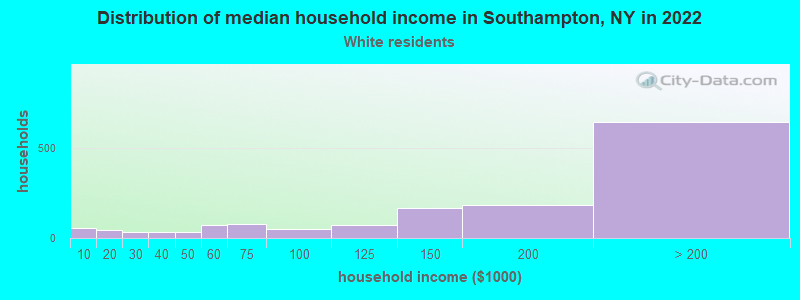
- $181,443White non-Hispanic householders
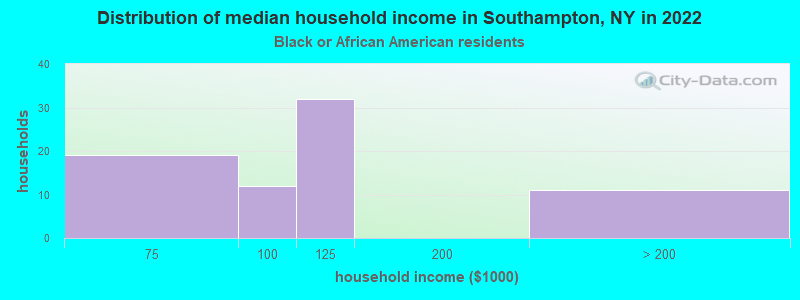
- $102,566Black householders
- over $200,000Asian householders
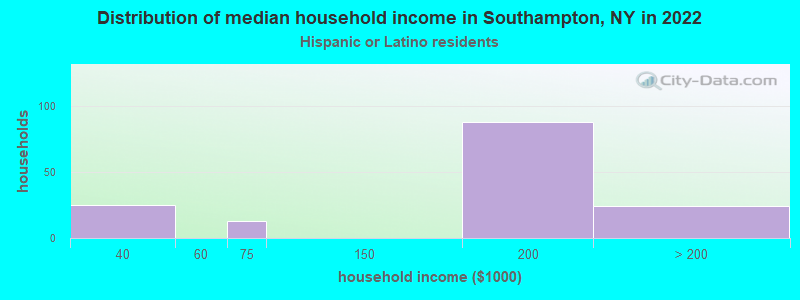
- $185,801Hispanic or Latino race householders
- Median 2022 house value
- over $1,000,000White Non-Hispanic householders
- $702,074Black or African American householders
- over $1,000,000Asian householders
- over $1,000,000Two or more races householders
Household income for White non-Hispanic householders
Household income for Black householders
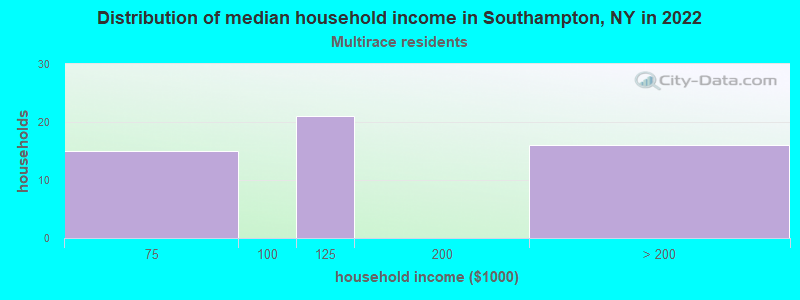
Household income for Two or more races householders
Household income for Hispanic or Latino race householders
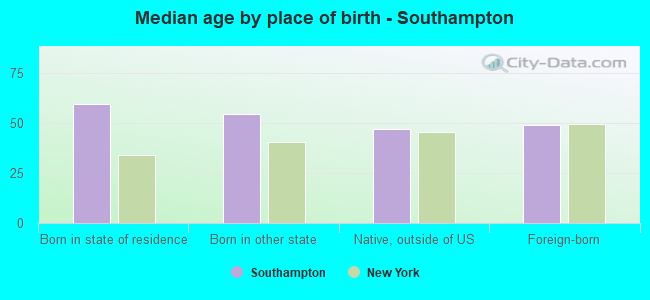
Median age by race in Southampton
- 59.1Median age for White residents
- 58.8Males
- 54.4Females
- 50.9Median age for Black or African American residents
- 30.2Males
- 54.6Females
- 53.0Median age for American Indian / Alaska Native residents
- 41.9Males
- 36.8Females
- 59.1Median age for Asian residents
- 59.6Males
- 62.2Females
- -742,816,091.2Median age for Native Hawaiian / Pacific Islander residents
- -831,187,409.8Males
- -771,300,447.7Females
- 49.7Median age for Other race residents
- -643,206,255.5Males
- -677,215,189.2Females
- 42.5Median age for Two or more races residents
- -673,733,803.8Males
- 44.5Females
- 59.0Median age for White alone residents
- 59.2Males
- 59.0Females
- 31.7Median age for Hispanic or Latino residents
- 32.5Males
- 27.0Females
Owner/renter occupied households by race in Southampton
- House owners and renters - White residents
- 1,23284.0%Owner occupied
- 23516.0%Renter occupied
- House owners and renters - Black or African American residents
- 73100.0%Owner occupied
- House owners and renters - American Indian / Alaska Native residents
- 448.7%Owner occupied
- 551.3%Renter occupied
- House owners and renters - Asian residents
- 28.6%Owner occupied
- 2491.4%Renter occupied
- House owners and renters - Two or more races residents
- 3361.9%Owner occupied
- 2038.1%Renter occupied
- House owners and renters - White alone residents
- 1,20685.0%Owner occupied
- 21215.0%Renter occupied
- House owners and renters - Hispanic or Latino residents
- 7754.2%Owner occupied
- 6545.8%Renter occupied
Language usage in Southampton
- English speakers - Total
- 73.6% of residents of Southampton speak English at home.
- 16.0% of residents speak Spanish at home
- 39255.6%Speak English very well
- 31344.4%Speak English less than very well
- 10.7% of residents speak other language at home
- 37880.3%Speak English very well
- 9319.7%Speak English less than very well
- English speakers - Born in the United States
- 86.2% of residents of Southampton speak English at home.
- 2.0% of residents speak Spanish at home
- 1565.2%Speak English very well
- 834.8%Speak English less than very well
- 12.2% of residents speak other language at home
- 141100.0%Speak English very well
- English speakers - Native, born elsewhere
- 71.7% of residents of Southampton speak English at home.
- 28.3% of residents speak Spanish at home
- 5585.9%Speak English very well
- 914.1%Speak English less than very well
- 2.7% of residents speak other language at home
- 6100.0%Speak English very well
- English speakers - Foreign-born
- 25.6% of residents of Southampton speak English at home.
- 46.3% of residents speak Spanish at home
- 26554.1%Speak English very well
- 22545.9%Speak English less than very well
- 25.4% of residents speak other language at home
- 17464.7%Speak English very well
- 9535.3%Speak English less than very well
White (Caucasian) - Speak only English
| Native: | 91.7% (2,579) |
| Foreign-born: | 22.2% (105) |
White (Caucasian) - Speak another language
| Native: | 7.5% (210) |
| Foreign-born: | 75.6% (358) |
Black or African American - Speak only English
| Native: | 97.0% (216) |
| Foreign-born: | 100.0% (32) |
American Indian / Alaska Native - Speak only English
| Native: | 57.4% (6) |
| Foreign-born: | 14.9% (4) |
Asian - Speak only English
| Native: | 91.6% (33) |
| Foreign-born: | 53.3% (74) |
Two or more races - Speak another language
| Native: | 58.7% (106) |
| Foreign-born: | 100.0% (156) |
White alone - Speak only English
| Native: | 93.5% (2,570) |
| Foreign-born: | 32.0% (114) |
White alone - Speak another language
| Native: | 6.7% (183) |
| Foreign-born: | 68.0% (244) |
Hispanic or Latino - Speak only English
| Native: | 28.4% (79) |
| Foreign-born: | 0.9% (4) |
Hispanic or Latino - Speak another language
| Native: | 70.3% (195) |
| Foreign-born: | 99.7% (466) |
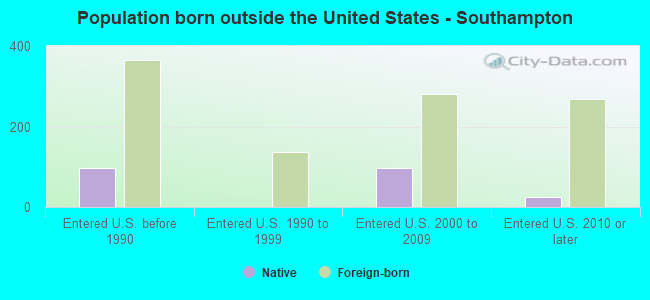
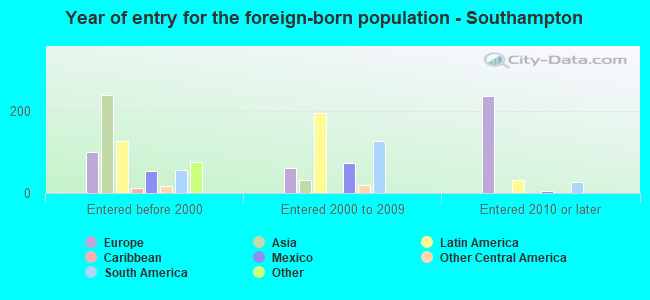
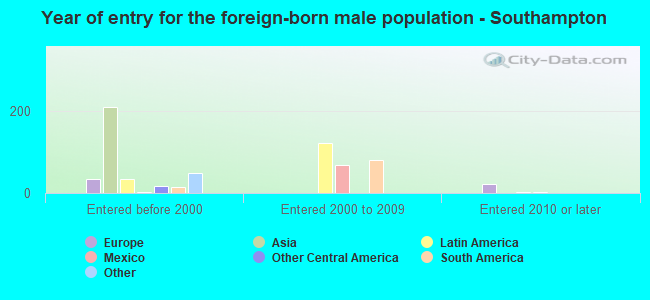
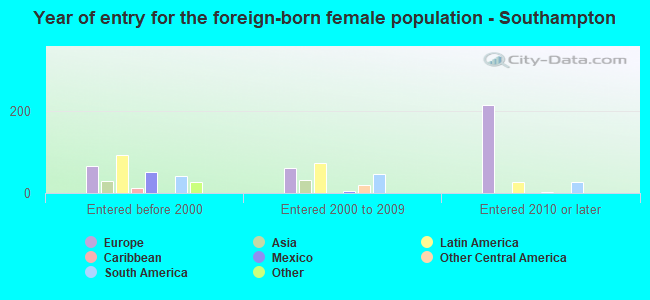
Foreign-born residents in Southampton
975 residents are foreign born (8.1% Europe, 7.3% Latin America, 5.6% Asia).
| This city: | 21.7% |
| New York: | 22.6% |
Marital status for residents in Southampton
Marital status - White (Caucasian) population 15 years and over
- Males
- 24.9%Never married
- 62.2%Now married
- 1.2%Separated
- 3.6%Widowed
- 8.0%Divorced
- Females
- 23.1%Never married
- 52.8%Now married
- 0.0%Separated
- 13.0%Widowed
- 11.1%Divorced
Women who did not give birth in the past 12 months
| Now married: | 47.0% (262) |
| Unmarried: | 53.0% (295) |
Marital status - Black or African American population 15 years and over
- Males
- 31.8%Never married
- 68.2%Now married
- 0.0%Separated
- 0.0%Widowed
- 0.0%Divorced
- Females
- 12.0%Never married
- 47.9%Now married
- 0.0%Separated
- 16.2%Widowed
- 24.0%Divorced
Women who did not give birth in the past 12 months
| Now married: | 100.0% (64) |
| Unmarried: | 0.0% (0) |
Marital status - American Indian / Alaska Native population 15 years and over
- Males
- 63.6%Never married
- 0.0%Now married
- 0.0%Separated
- 0.0%Widowed
- 36.4%Divorced
- Females
- 60.0%Never married
- 0.0%Now married
- 0.0%Separated
- 0.0%Widowed
- 40.0%Divorced
Women who did not give birth in the past 12 months
| Now married: | 0.0% (0) |
| Unmarried: | 100.0% (9) |
Marital status - Asian population 15 years and over
- Males
- 13.6%Never married
- 86.4%Now married
- 0.0%Separated
- 0.0%Widowed
- 0.0%Divorced
- Females
- 50.9%Never married
- 23.6%Now married
- 0.0%Separated
- 21.8%Widowed
- 3.6%Divorced
Women who did not give birth in the past 12 months
| Now married: | 0.0% (0) |
| Unmarried: | 100.0% (14) |
Marital status - Other race population 15 years and over
- Males
- 0.0%Never married
- 100.0%Now married
- 0.0%Separated
- 0.0%Widowed
- 0.0%Divorced
- Females
- 100.0%Never married
- 0.0%Now married
- 0.0%Separated
- 0.0%Widowed
- 0.0%Divorced
Women who did not give birth in the past 12 months
| Now married: | 0.0% (0) |
| Unmarried: | 100.0% (3) |
Marital status - Two or more races population 15 years and over
- Males
- 54.8%Never married
- 45.2%Now married
- 0.0%Separated
- 0.0%Widowed
- 0.0%Divorced
- Females
- 25.0%Never married
- 64.8%Now married
- 0.0%Separated
- 10.2%Widowed
- 0.0%Divorced
Women who did not give birth in the past 12 months
| Now married: | 100.0% (86) |
| Unmarried: | 0.0% (0) |
Marital status - White alone, not Hispanic / Latino population 15 years and over
- Males
- 23.3%Never married
- 65.5%Now married
- 1.4%Separated
- 4.1%Widowed
- 5.7%Divorced
- Females
- 21.8%Never married
- 51.1%Now married
- 0.0%Separated
- 14.6%Widowed
- 12.5%Divorced
Women who did not give birth in the past 12 months
| Now married: | 46.6% (229) |
| Unmarried: | 53.4% (263) |
Marital status - Hispanic or Latino population 15 years and over
- Males
- 44.0%Never married
- 30.6%Now married
- 0.0%Separated
- 0.0%Widowed
- 25.4%Divorced
- Females
- 29.8%Never married
- 66.2%Now married
- 0.0%Separated
- 4.0%Widowed
- 0.0%Divorced
Women who did not give birth in the past 12 months
| Now married: | 63.2% (121) |
| Unmarried: | 36.8% (70) |
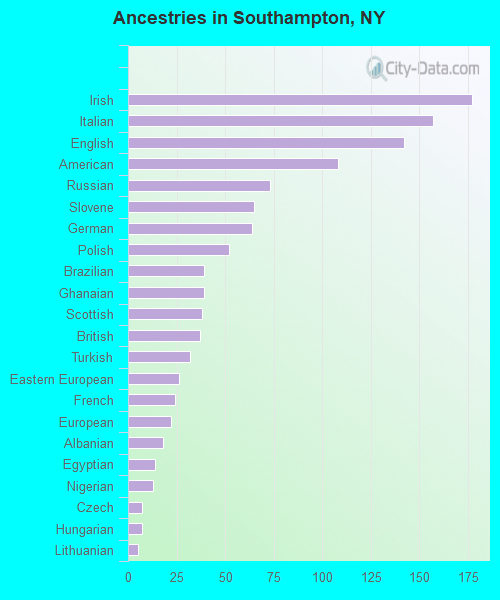
Ancestries in Southampton

- 17710.6%Irish
- 1579.4%Italian
- 1428.5%English
- 1086.5%American
- 734.4%Russian
- 653.9%Slovene
- 643.8%German
- 523.1%Polish
- 392.3%Brazilian
- 392.3%Ghanaian
- 382.3%Scottish
- 372.2%British
- 321.9%Turkish
- 261.6%Eastern European
- 241.4%French
- 221.3%European
- 181.1%Albanian
- 140.8%Egyptian
- 130.8%Nigerian
- 70.4%Czech
- 70.4%Hungarian
- 50.3%Lithuanian
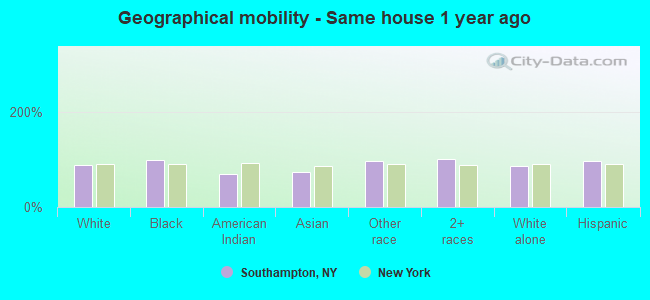
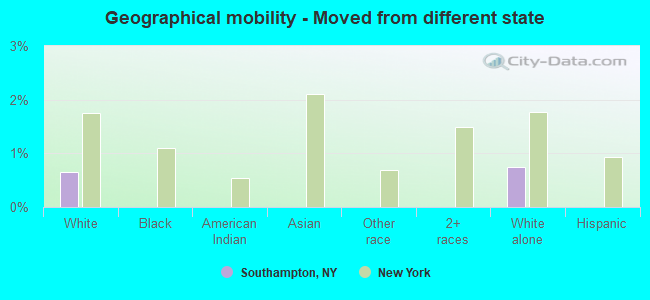
Geographical mobility in Southampton

- Same house 1 year ago
- 3,01187.5%White (Caucasian)
- 25598.4%Black or African American
- 1969.0%American Indian / Alaska Native
- 13172.9%Asian
- 897.3%Other race
- 339100.0%Two or more races
- 2,70985.8%White alone, not Hispanic / Latino
- 71996.3%Hispanic or Latino
-
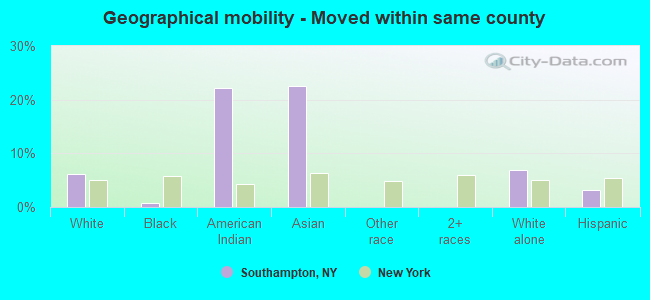
- Moved within same county
- 2126.2%White / Caucasian
- 20.7%Black or African American
- 622.3%American Indian / Alaska Native
- 4122.5%Asian
- 2197.0%White alone, not Hispanic / Latino
- 243.2%Hispanic or Latino
-
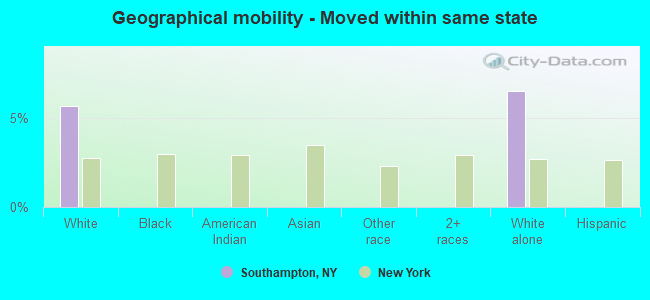
- Moved within same state
- 1955.7%White / Caucasian
- 2046.5%White alone, not Hispanic / Latino
-
- Moved from different state
- 220.6%White / Caucasian
- 230.7%White alone, not Hispanic / Latino
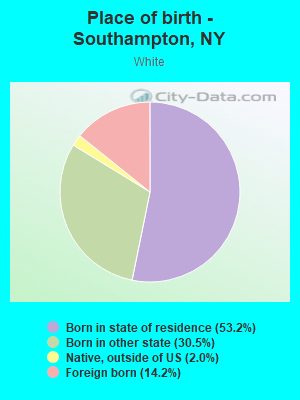
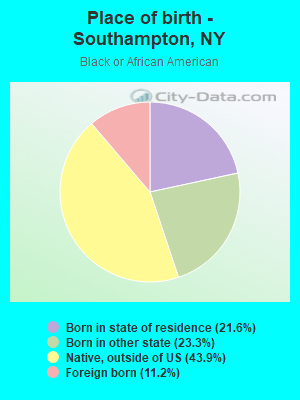
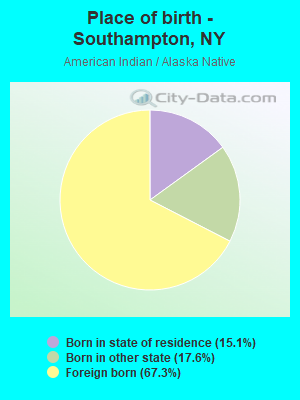
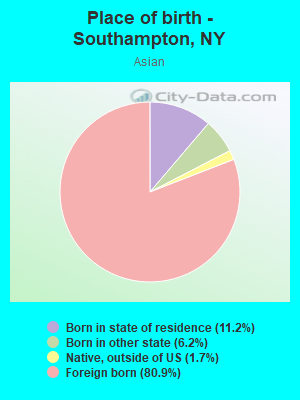
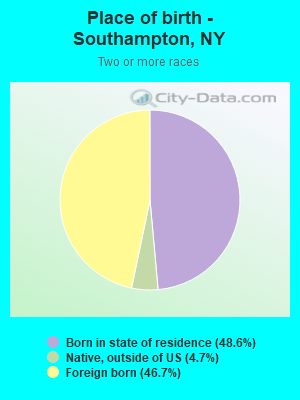
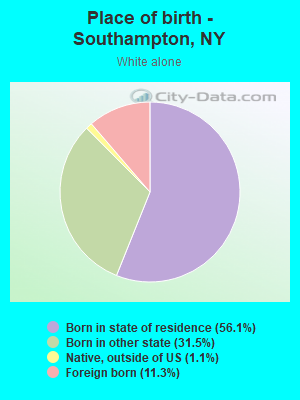
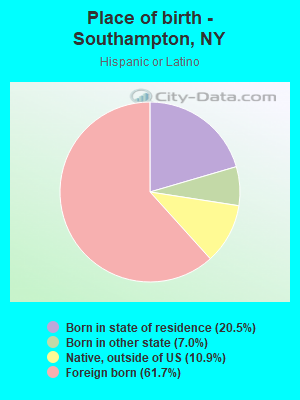
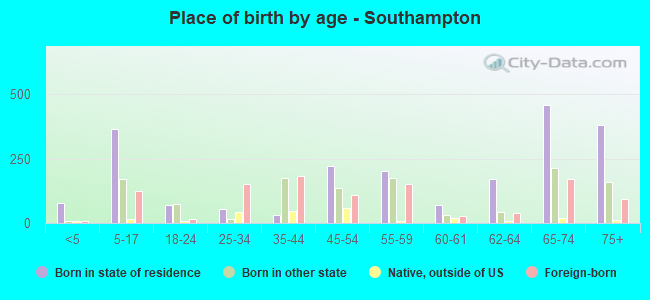
Children Nativity (place of birth) in Southampton
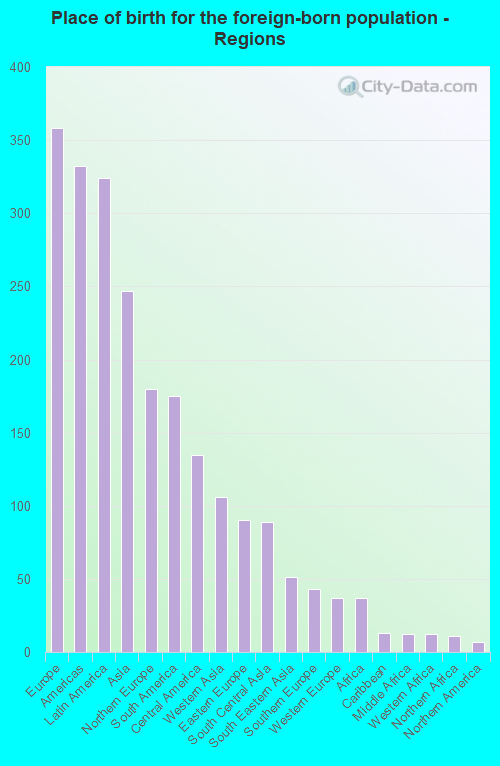
Place of birth for residents in Southampton
![Place of birth for the foreign-born population - Regions]()
- 358Europe
- 332Americas
- 324Latin America
- 247Asia
- 180Northern Europe
- 175South America
- 135Central America
- 106Western Asia
- 90Eastern Europe
- 89South Central Asia
- 51South Eastern Asia
- 43Southern Europe
- 37Western Europe
- 37Africa
- 13Caribbean
- 12Middle Africa
- 12Western Africa
- 11Northern Africa
- 7Northern America
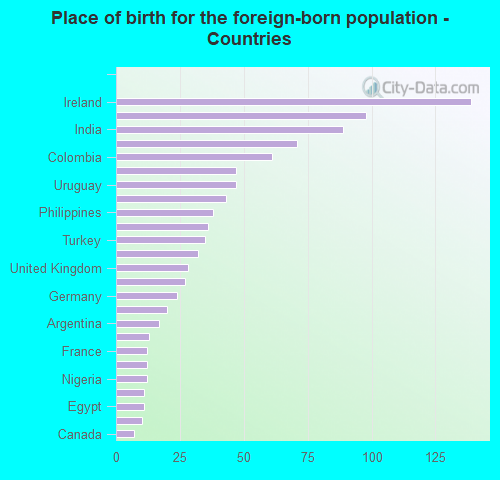
![Place of birth for the foreign-born population - Countries]()
- 139Ireland
- 98Mexico
- 89India
- 71Israel
- 61Colombia
- 47Poland
- 47Uruguay
- 43Italy
- 38Philippines
- 36El Salvador
- 35Turkey
- 32Russia
- 28United Kingdom
- 27Brazil
- 24Germany
- 20Ecuador
- 17Argentina
- 13Dominican Republic
- 12France
- 12Singapore
- 12Nigeria
- 11Scotland
- 11Egypt
- 10Czechoslovakia
- 7Canada
Zip codes: 11968.