Races in Spring Valley, Texas (TX) Detailed Stats
Ancestries, Foreign-born residents, place of birth

Discuss Spring Valley, Texas races on our local forum with over 2,400,000 registered users
7.8% of Spring Valley, TX residents are foreign-born (3.7% born in Europe, 2.3% born in Asia), which is 117.7% less than the foreign-born rate of 17.0% across the entire state of Texas.
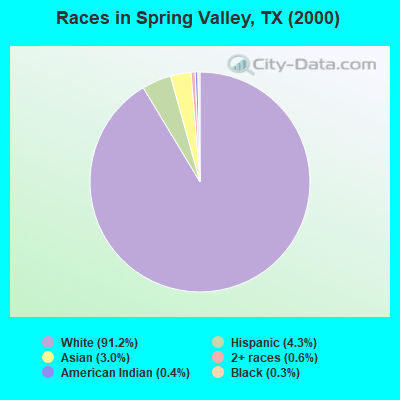
Race distribution in Spring Valley

- 3,29491.2%White alone
- 1564.3%Hispanic
- 1073.0%Asian alone
- 230.6%Two or more races
- 160.4%American Indian alone
- 120.3%Black alone
- 20.06%Other race alone
- 10.03%Native Hawaiian and Other
Pacific Islander alone
2000
2022
-
- 10,933,31352.4%White alone
- 6,669,66632.0%Hispanic
- 2,364,25511.3%Black alone
- 554,4452.7%Asian alone
- 230,5671.1%Two or more races
- 68,8590.3%American Indian alone
- 19,9580.10%Other race alone
- 10,7570.05%Native Hawaiian and Other
Pacific Islander alone

-
- 12,070,64240.2%Hispanic
- 11,683,43038.9%White alone
- 3,508,70611.7%Black alone
- 1,608,1735.4%Asian alone
- 956,5603.2%Two or more races
- 125,7630.4%Other race alone
- 47,0230.2%American Indian alone
- 29,2750.10%Native Hawaiian and Other
Pacific Islander alone

Income and house value in Spring Valley
- Median household income in 2022
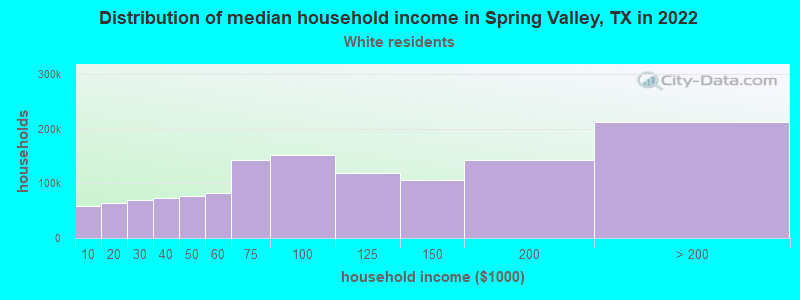
- $163,931White non-Hispanic householders
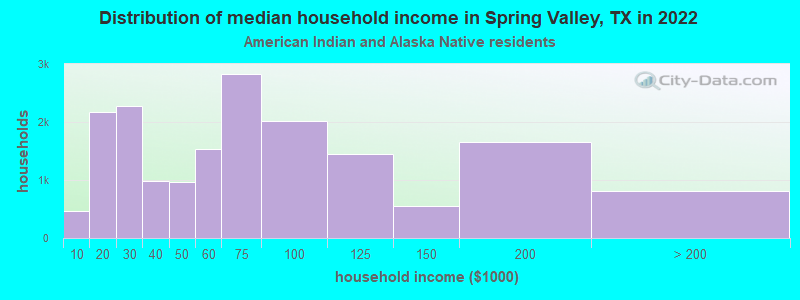
- $53,631American Indian and Alaska Native householders
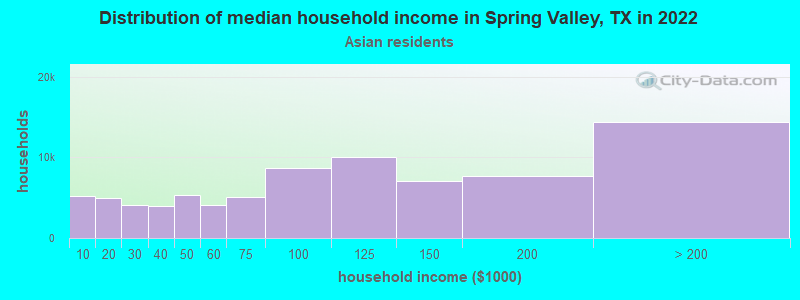
- $60,622Asian householders
- $148,395Some other race householders
- $187,558Two or more races householders
- $171,144Hispanic or Latino race householders
- Median 2022 house value
- $676,304White Non-Hispanic householders
- $61,453American Indian or Alaska Native householders
- $370,289Asian householders
- $587,885Some other race householders
- $705,463Two or more races householders
- $621,748Hispanic or Latino householders
Household income for White non-Hispanic householders
Household income for American Indian and Alaska Native householders
Household income for Asian householders
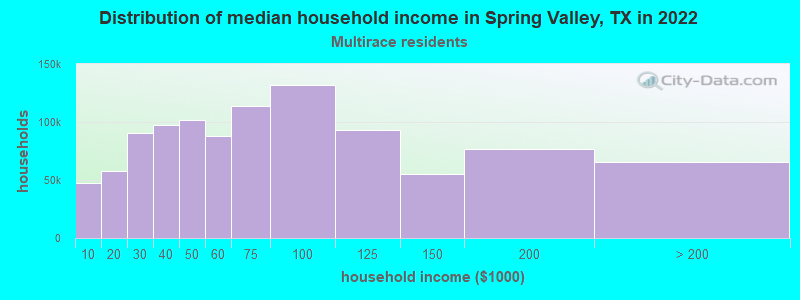
Household income for Two or more races householders
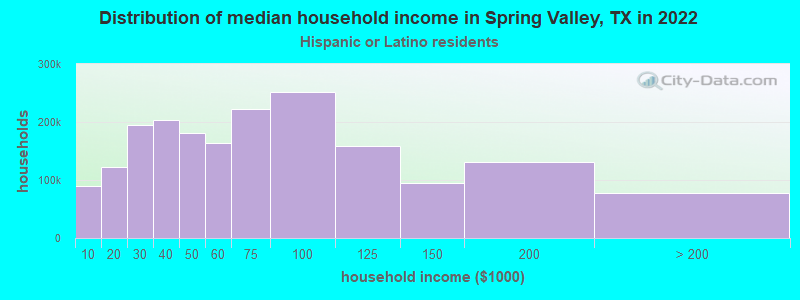
Household income for Hispanic or Latino race householders
Foreign-born residents in Spring Valley
282 residents are foreign born (3.7% Europe, 2.3% Asia).
| This city: | 7.8% |
| Texas: | 13.9% |
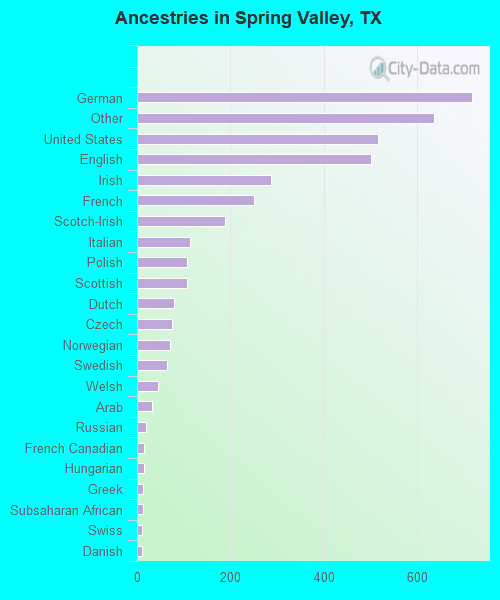
Ancestries in Spring Valley

- 71918.5%German
- 63616.3%Other
- 51713.3%United States
- 50112.9%English
- 2877.4%Irish
- 2516.4%French
- 1884.8%Scotch-Irish
- 1132.9%Italian
- 1072.7%Polish
- 1072.7%Scottish
- 802.1%Dutch
- 751.9%Czech
- 711.8%Norwegian
- 651.7%Swedish
- 451.2%Welsh
- 320.8%Arab
- 200.5%Russian
- 160.4%French Canadian
- 150.4%Hungarian
- 130.3%Greek
- 120.3%Subsaharan African
- 110.3%Swiss
- 100.3%Danish
- 60.2%Slovak
Zip codes: 77055.