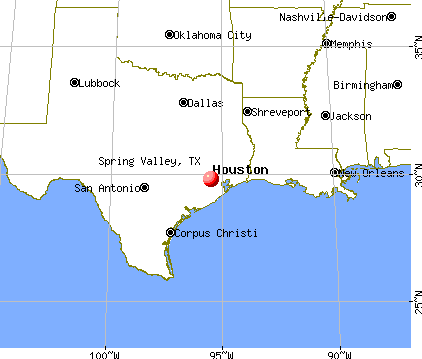
Spring Valley, Texas
Submit your own pictures of this city and show them to the world
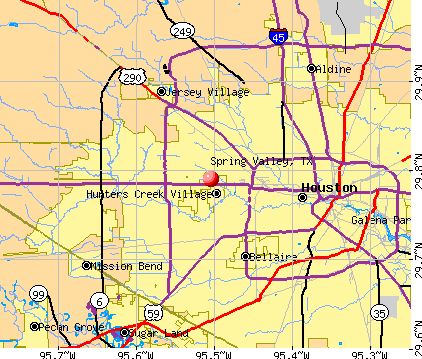
- OSM Map
- General Map
- Google Map
- MSN Map
| Males: 2,016 | |
| Females: 2,119 |
| Median resident age: | 41.3 years |
| Texas median age: | 32.3 years |
Zip codes: 77055.
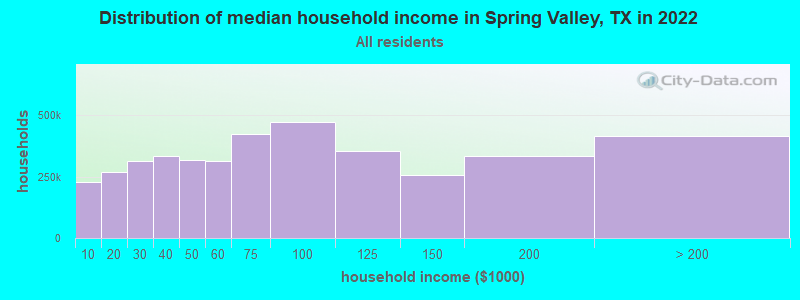
| Spring Valley: | $155,470 |
| TX: | $72,284 |
Estimated per capita income in 2022: $79,302 (it was $44,912 in 2000)
Spring Valley city income, earnings, and wages data
Estimated median house or condo value in 2022: $669,720 (it was $213,600 in 2000)
| Spring Valley: | $669,720 |
| TX: | $275,400 |
Mean prices in 2022: all housing units: $351,842; detached houses: $364,274; townhouses or other attached units: $318,336; in 2-unit structures: $370,492; in 3-to-4-unit structures: $220,695; in 5-or-more-unit structures: $300,125; mobile homes: $115,450; occupied boats, rvs, vans, etc.: $137,528
Detailed information about poverty and poor residents in Spring Valley, TX
Compare current foreclosures near Spring Valley, TX:
| Photo | Address | Area | Beds / Baths | Price | Details |
|---|---|---|---|---|---|

|
#1
Meadowview Dr
Missouri City, TX 77459
|
1,845 sq. feet
|
2 baths 3 beds |
$284,900
|
show details |

|
#2
W Antone Cir
Houston, TX 77071
|
1,932 sq. feet
|
2 baths 4 beds |
$284,900
|
show details |

|
#3
Clover St
Houston, TX 77033
|
1,584 sq. feet
|
2 baths 4 beds |
show details | |

|
#4
Camellia Knoll Trl
Houston, TX 77084
|
2,486 sq. feet
|
3 baths 4 beds |
show details | |

|
#5
Meadowhollow Dr
Stafford, TX 77477
|
1,884 sq. feet
|
2 baths 3 beds |
show details | |

|
#6
Way St
Houston, TX 77028
|
1,248 sq. feet
|
2 baths 3 beds |
show details | |

|
#7
Verbena Blossom Trail
Katy, TX 77449
|
2,344 sq. feet
|
2 baths 4 beds |
show details | |

|
#8
Northspring Bend Ln
Cypress, TX 77429
|
3,719 sq. feet
|
3 baths 5 beds |
show details | |

|
#9
Bayou View Dr
Houston, TX 77091
|
2,208 sq. feet
|
2 baths 7 beds |
show details | |

|
#10
Lydia St
Houston, TX 77021
|
1,274 sq. feet
|
2 baths 4 beds |
show details |
| Photo | Address | Area | Beds / Baths | Price | Details |
|---|---|---|---|---|---|

|
#11
Casa Calvet Dr
Katy, TX 77449
|
- sq. feet
|
3 baths 4 beds |
show details | |

|
#12
Emerson St
Houston, TX 77006
|
1,941 sq. feet
|
2 baths 3 beds |
show details | |

|
#13
Rockcrest Dr
Houston, TX 77041
|
1,321 sq. feet
|
2 baths 3 beds |
show details | |

|
#14
Lakehurst Dr
Houston, TX 77087
|
1,224 sq. feet
|
1 baths 3 beds |
show details | |

|
#15
Hillcroft St
Houston, TX 77096
|
2,207 sq. feet
|
2 baths 3 beds |
show details | |

|
#16
Willow St
Houston, TX 77088
|
1,590 sq. feet
|
2 baths 4 beds |
show details | |

|
#17
Briar Forest Dr
Houston, TX 77042
|
1,872 sq. feet
|
2 baths 3 beds |
show details | |

|
#18
San Felipe St # 2405
Houston, TX 77027
|
- sq. feet
|
- baths - beds |
$948,900
|
show details |

|
#19
Indian Ridge Ct
Katy, TX 77450
|
1,879 sq. feet
|
2 baths 4 beds |
show details | |

|
#20
Peninsulas Dr
Missouri City, TX 77459
|
5,953 sq. feet
|
3 baths 5 beds |
show details |
| Photo | Address | Area | Beds / Baths | Price | Details |
|---|---|---|---|---|---|

|
#21
Reedpoint Dr
Houston, TX 77090
|
2,642 sq. feet
|
2 baths 4 beds |
show details | |

|
#22
Legacy Oak St
Katy, TX 77493
|
- sq. feet
|
2 baths 3 beds |
show details | |

|
#23
Loganberry Park Ln
Houston, TX 77014
|
1,685 sq. feet
|
2 baths 3 beds |
show details | |

|
#24
Painted Trail Dr
Houston, TX 77084
|
2,140 sq. feet
|
2 baths 4 beds |
show details | |

|
#25
Gentle Cove Ct
Houston, TX 77084
|
3,234 sq. feet
|
2 baths 4 beds |
show details | |

|
#26
Lost Thicket Dr
Houston, TX 77085
|
1,415 sq. feet
|
2 baths 3 beds |
show details | |

|
#27
N Brompton Dr
Pearland, TX 77584
|
1,106 sq. feet
|
2 baths 2 beds |
show details | |

|
#28
E 40th 1/2 St
Houston, TX 77022
|
1,156 sq. feet
|
2 baths 3 beds |
show details | |

|
#29
Thicket Ln
Houston, TX 77079
|
2,160 sq. feet
|
2 baths 4 beds |
show details | |

|
#30
Blackjack Ln
Houston, TX 77088
|
2,118 sq. feet
|
2 baths 3 beds |
show details |
| Photo | Address | Area | Beds / Baths | Price | Details |
|---|---|---|---|---|---|

|
#31
Bissonet
Houston, TX 77057
|
924 sq. feet
|
1 baths 1 beds |
show details | |

|
#32
Hillbrook Dr
Houston, TX 77070
|
2,212 sq. feet
|
3 baths 4 beds |
show details | |

|
#33
Piney Meadow Ct
Houston, TX 77041
|
1,458 sq. feet
|
2 baths 3 beds |
show details | |

|
#34
John Dreaper Dr
Houston, TX 77056
|
3,938 sq. feet
|
3 baths 3 beds |
show details | |

|
#35
S Ferndale Place Dr
Houston, TX 77064
|
2,104 sq. feet
|
2 baths 3 beds |
show details | |

|
#36
Shady Oaks Ct
Missouri City, TX 77489
|
1,509 sq. feet
|
2 baths 3 beds |
show details | |

|
#37
Cornish St
Houston, TX 77007
|
2,310 sq. feet
|
3 baths 3 beds |
show details | |

|
#38
Red Creek Cove Ln
Humble, TX 77396
|
4,825 sq. feet
|
4 baths 6 beds |
show details | |

|
#39
Catamore St
Houston, TX 77076
|
1,235 sq. feet
|
1 baths 3 beds |
show details | |

|
#40
Hackamore Hollow Ln
Houston, TX 77014
|
1,493 sq. feet
|
2 baths 3 beds |
show details |
| Photo | Address | Area | Beds / Baths | Price | Details |
|---|---|---|---|---|---|

|
#41
Fernbluff Dr
Spring, TX 77379
|
3,554 sq. feet
|
3 baths 4 beds |
show details | |

|
#42
Park Orchard Dr
Katy, TX 77450
|
2,432 sq. feet
|
2 baths 3 beds |
show details | |

|
#43
Bristol Bluff Ln
Richmond, TX 77407
|
- sq. feet
|
2 baths 4 beds |
show details | |

|
#44
Canyon Chase Dr
Houston, TX 77095
|
3,783 sq. feet
|
3 baths 5 beds |
show details | |

|
#45
Blue Willow Dr
Houston, TX 77042
|
1,888 sq. feet
|
2 baths 3 beds |
show details | |

|
#46
Archer Glen Dr
Houston, TX 77073
|
1,822 sq. feet
|
2 baths 3 beds |
show details | |

|
#47
Autumn Lks
Missouri City, TX 77459
|
3,408 sq. feet
|
3 baths 5 beds |
show details | |

|
#48
S Youngwood Ln
Houston, TX 77043
|
2,354 sq. feet
|
2 baths 3 beds |
show details | |

|
#49
Mopan Valley Ln
Houston, TX 77066
|
2,878 sq. feet
|
2 baths 5 beds |
show details | |

|
Check over 1 million property listings on Foreclosure.com!
|
browse all offers | |||

- 3,29491.2%White alone
- 1564.3%Hispanic
- 1073.0%Asian alone
- 230.6%Two or more races
- 160.4%American Indian alone
- 120.3%Black alone
- 20.06%Other race alone
- 10.03%Native Hawaiian and Other
Pacific Islander alone
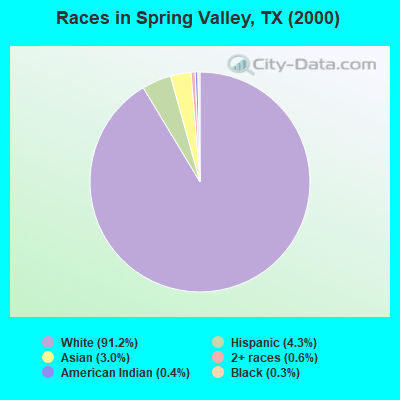
Races in Spring Valley detailed stats: ancestries, foreign born residents, place of birth
Type |
2009 |
2010 |
2011 |
2012 |
2013 |
2014 |
2015 |
2016 |
2017 |
2018 |
2019 |
2020 |
2021 |
2022 |
|---|---|---|---|---|---|---|---|---|---|---|---|---|---|---|
| Murders (per 100,000) | 0 (0.0) | 0 (0.0) | 0 (0.0) | 0 (0.0) | 0 (0.0) | 0 (0.0) | 0 (0.0) | 0 (0.0) | 0 (0.0) | 0 (0.0) | 0 (0.0) | 0 (0.0) | 0 (0.0) | 0 (0.0) |
| Rapes (per 100,000) | 0 (0.0) | 0 (0.0) | 0 (0.0) | 1 (26.0) | 1 (24.9) | 1 (24.5) | 0 (0.0) | 0 (0.0) | 0 (0.0) | 0 (0.0) | 0 (0.0) | 0 (0.0) | 1 (22.9) | 0 (0.0) |
| Robberies (per 100,000) | 5 (127.9) | 3 (80.8) | 2 (52.7) | 0 (0.0) | 1 (24.9) | 1 (24.5) | 4 (94.1) | 0 (0.0) | 2 (46.4) | 1 (22.9) | 1 (22.7) | 0 (0.0) | 2 (45.8) | 1 (23.8) |
| Assaults (per 100,000) | 1 (25.6) | 2 (53.8) | 1 (26.4) | 5 (129.8) | 5 (124.7) | 3 (73.4) | 1 (23.5) | 6 (139.9) | 2 (46.4) | 2 (45.8) | 0 (0.0) | 1 (22.8) | 2 (45.8) | 2 (47.5) |
| Burglaries (per 100,000) | 12 (306.9) | 15 (403.8) | 26 (685.5) | 16 (415.3) | 23 (573.7) | 14 (342.6) | 17 (399.9) | 21 (489.6) | 4 (92.8) | 11 (252.1) | 3 (68.0) | 2 (45.6) | 4 (91.7) | 2 (47.5) |
| Thefts (per 100,000) | 84 (2,148) | 103 (2,773) | 83 (2,188) | 105 (2,725) | 113 (2,819) | 103 (2,521) | 83 (1,952) | 119 (2,775) | 64 (1,484) | 57 (1,306) | 70 (1,586) | 65 (1,481) | 64 (1,467) | 72 (1,711) |
| Auto thefts (per 100,000) | 1 (25.6) | 4 (107.7) | 6 (158.2) | 7 (181.7) | 6 (149.7) | 4 (97.9) | 5 (117.6) | 5 (116.6) | 4 (92.8) | 5 (114.6) | 12 (271.9) | 14 (319.0) | 8 (183.4) | 8 (190.1) |
| Arson (per 100,000) | 0 (0.0) | 0 (0.0) | 0 (0.0) | 0 (0.0) | 0 (0.0) | 0 (0.0) | 0 (0.0) | 0 (0.0) | 0 (0.0) | 0 (0.0) | 0 (0.0) | 0 (0.0) | 0 (0.0) | 0 (0.0) |
| City-Data.com crime index | 152.9 | 182.8 | 169.3 | 199.3 | 217.3 | 174.3 | 148.4 | 182.6 | 96.5 | 95.1 | 96.7 | 92.5 | 121.0 | 103.6 |
The City-Data.com crime index weighs serious crimes and violent crimes more heavily. Higher means more crime, U.S. average is 246.1. It adjusts for the number of visitors and daily workers commuting into cities.
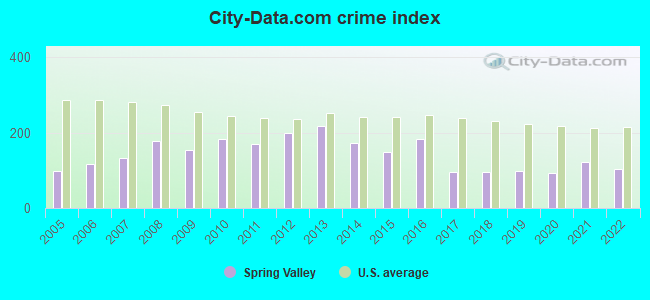
Crime rate in Spring Valley detailed stats: murders, rapes, robberies, assaults, burglaries, thefts, arson
Full-time law enforcement employees in 2021, including police officers: 26 (20 officers - 18 male; 2 female).
| Officers per 1,000 residents here: | 4.58 |
| Texas average: | 2.07 |
 Recent articles from our blog. Our writers, many of them Ph.D. graduates or candidates, create easy-to-read articles on a wide variety of topics.

Latest news from Spring Valley, TX collected exclusively by city-data.com from local newspapers, TV, and radio stations
Ancestries: German (19.9%), United States (14.3%), English (13.9%), Irish (7.9%), French (7.0%), Scotch-Irish (5.2%).
Current Local Time: CST time zone
Land area: 1.31 square miles.
Population density: 3,155 people per square mile (average).
282 residents are foreign born (3.7% Europe, 2.3% Asia).
| This city: | 7.8% |
| Texas: | 13.9% |
| Spring Valley city: | 1.7% ($3,641) |
| Texas: | 1.8% ($1,393) |
Nearest city with pop. 50,000+: Houston, TX  (7.5 miles , pop. 1,953,631).
Nearest cities:
), ), ), ), ), ), ), )Latitude: 29.79 N, Longitude: 95.50 W
Daytime population change due to commuting: +2,750 (+76.2%)
Workers who live and work in this city: 176 (10.9%)
Spring Valley, Texas accommodation & food services, waste management - Economy and Business Data
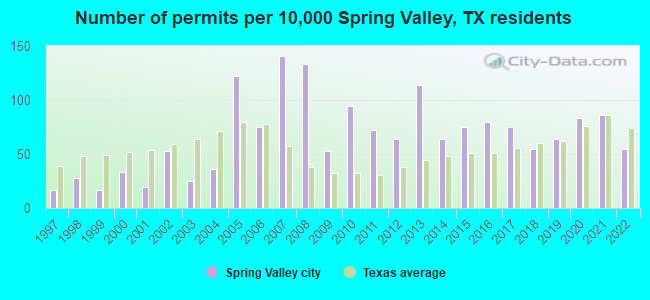
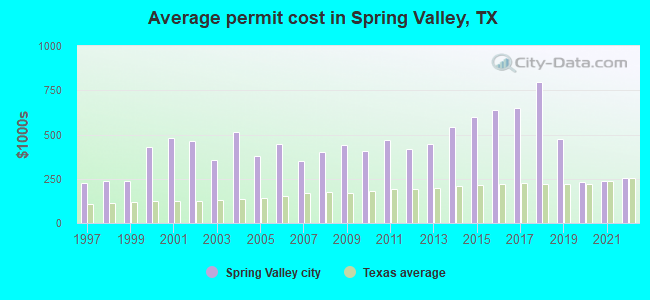
Single-family new house construction building permits:
- 2022: 20 buildings, average cost: $256,200
- 2021: 31 buildings, average cost: $238,300
- 2020: 30 buildings, average cost: $233,100
- 2019: 23 buildings, average cost: $475,800
- 2018: 20 buildings, average cost: $796,300
- 2017: 27 buildings, average cost: $646,800
- 2016: 29 buildings, average cost: $639,100
- 2015: 27 buildings, average cost: $597,800
- 2014: 23 buildings, average cost: $542,200
- 2013: 41 buildings, average cost: $445,800
- 2012: 23 buildings, average cost: $416,600
- 2011: 26 buildings, average cost: $466,700
- 2010: 34 buildings, average cost: $409,300
- 2009: 19 buildings, average cost: $438,900
- 2008: 48 buildings, average cost: $399,400
- 2007: 51 buildings, average cost: $351,800
- 2006: 27 buildings, average cost: $448,900
- 2005: 44 buildings, average cost: $380,800
- 2004: 13 buildings, average cost: $515,000
- 2003: 9 buildings, average cost: $358,300
- 2002: 19 buildings, average cost: $464,700
- 2001: 7 buildings, average cost: $483,400
- 2000: 12 buildings, average cost: $430,100
- 1999: 6 buildings, average cost: $239,500
- 1998: 10 buildings, average cost: $238,700
- 1997: 6 buildings, average cost: $225,500
| Here: | 3.8% |
| Texas: | 3.5% |
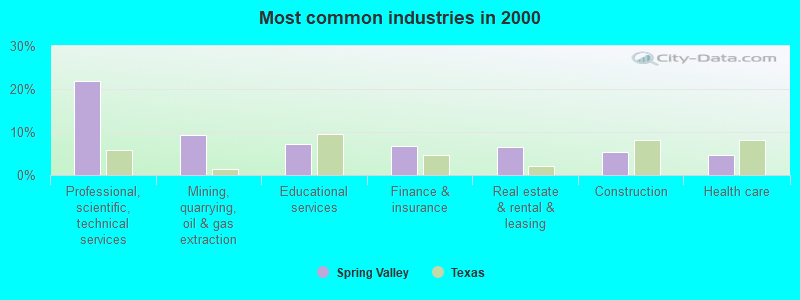
- Professional, scientific, technical services (21.9%)
- Mining, quarrying, oil & gas extraction (9.3%)
- Educational services (7.3%)
- Finance & insurance (6.7%)
- Real estate & rental & leasing (6.5%)
- Construction (5.2%)
- Health care (4.7%)
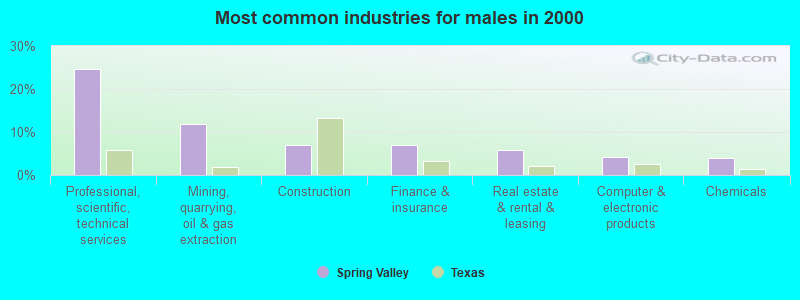
- Professional, scientific, technical services (24.6%)
- Mining, quarrying, oil & gas extraction (11.9%)
- Construction (6.9%)
- Finance & insurance (6.9%)
- Real estate & rental & leasing (5.9%)
- Computer & electronic products (4.2%)
- Chemicals (3.9%)
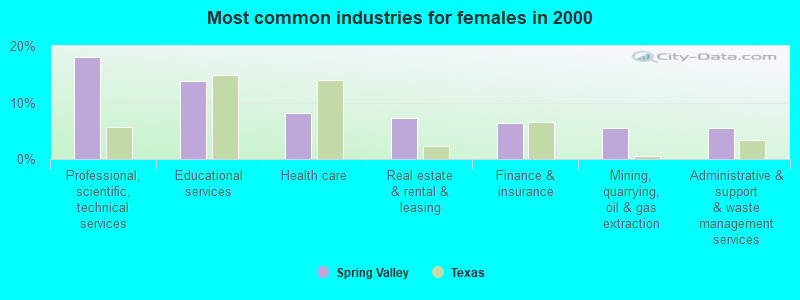
- Professional, scientific, technical services (18.0%)
- Educational services (13.9%)
- Health care (8.1%)
- Real estate & rental & leasing (7.2%)
- Finance & insurance (6.4%)
- Mining, quarrying, oil & gas extraction (5.5%)
- Administrative & support & waste management services (5.5%)
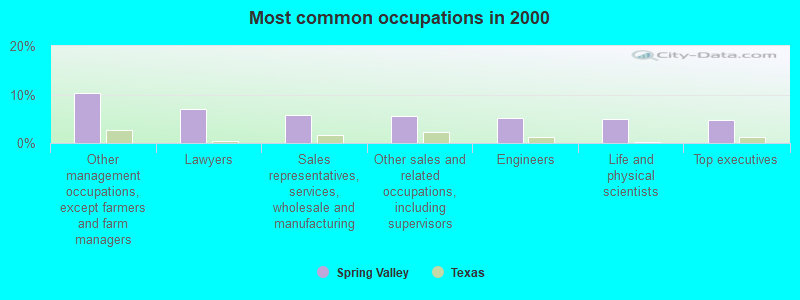
- Other management occupations, except farmers and farm managers (10.2%)
- Lawyers (7.0%)
- Sales representatives, services, wholesale and manufacturing (5.8%)
- Other sales and related occupations, including supervisors (5.7%)
- Engineers (5.2%)
- Life and physical scientists (5.0%)
- Top executives (4.7%)
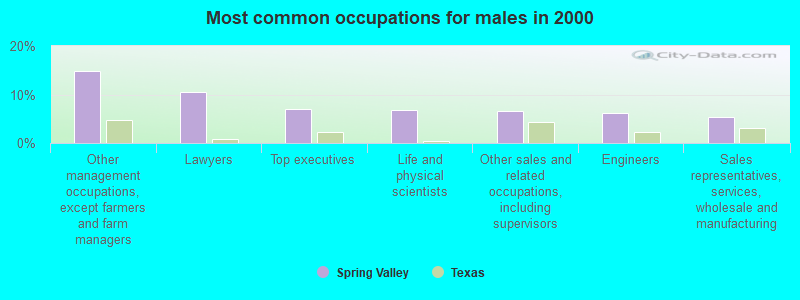
- Other management occupations, except farmers and farm managers (14.9%)
- Lawyers (10.6%)
- Top executives (6.9%)
- Life and physical scientists (6.8%)
- Other sales and related occupations, including supervisors (6.5%)
- Engineers (6.2%)
- Sales representatives, services, wholesale and manufacturing (5.3%)
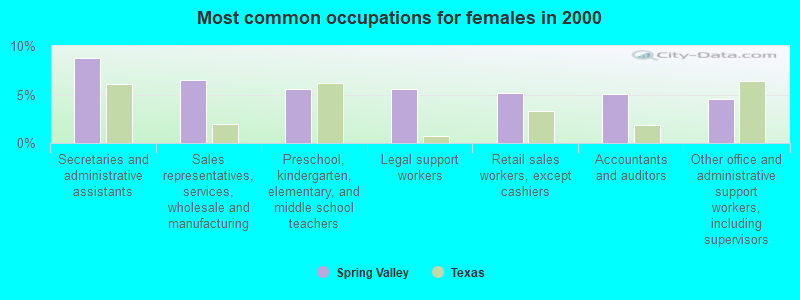
- Secretaries and administrative assistants (8.7%)
- Sales representatives, services, wholesale and manufacturing (6.5%)
- Preschool, kindergarten, elementary, and middle school teachers (5.6%)
- Legal support workers (5.6%)
- Retail sales workers, except cashiers (5.2%)
- Accountants and auditors (5.0%)
- Other office and administrative support workers, including supervisors (4.6%)
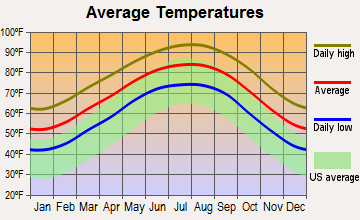
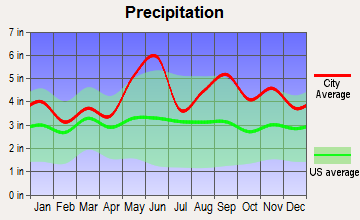
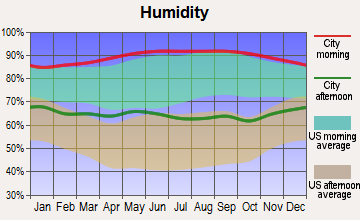
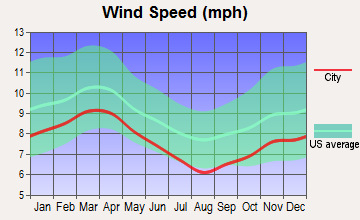
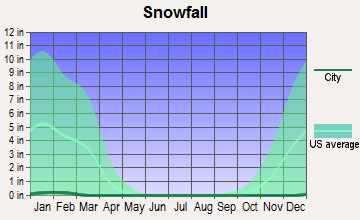
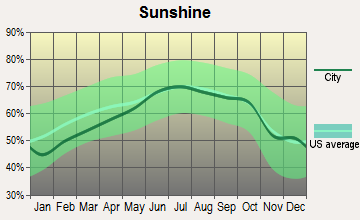
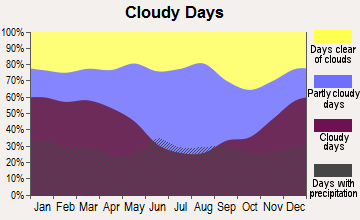
Average climate in Spring Valley, Texas
Based on data reported by over 4,000 weather stations
|
|


(lower is better)
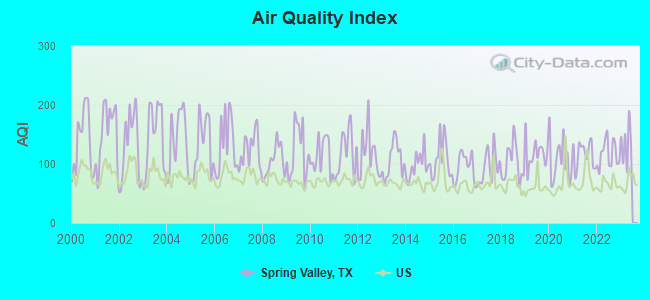
Air Quality Index (AQI) level in 2022 was 116. This is significantly worse than average.
| City: | 116 |
| U.S.: | 73 |
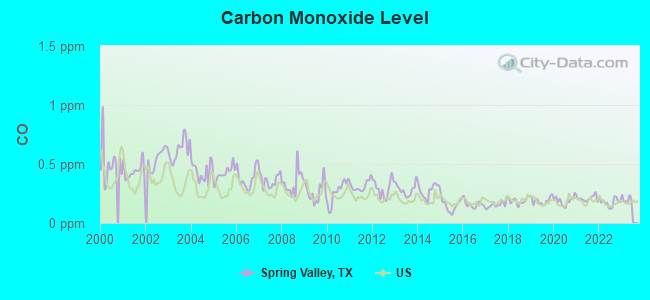
Carbon Monoxide (CO) [ppm] level in 2022 was 0.177. This is significantly better than average. Closest monitor was 3.2 miles away from the city center.
| City: | 0.177 |
| U.S.: | 0.251 |
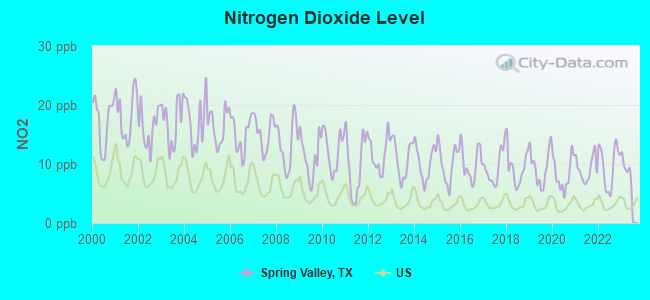
Nitrogen Dioxide (NO2) [ppb] level in 2022 was 9.70. This is significantly worse than average. Closest monitor was 2.4 miles away from the city center.
| City: | 9.70 |
| U.S.: | 5.11 |
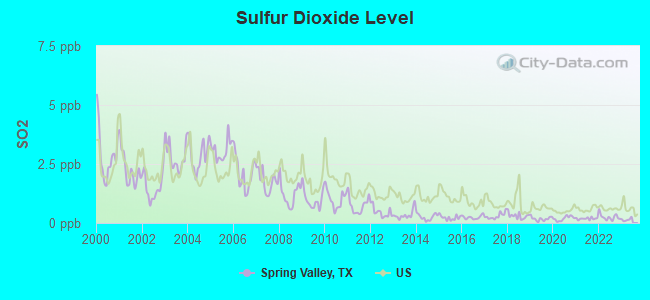
Sulfur Dioxide (SO2) [ppb] level in 2022 was 0.251. This is significantly better than average. Closest monitor was 2.4 miles away from the city center.
| City: | 0.251 |
| U.S.: | 1.515 |
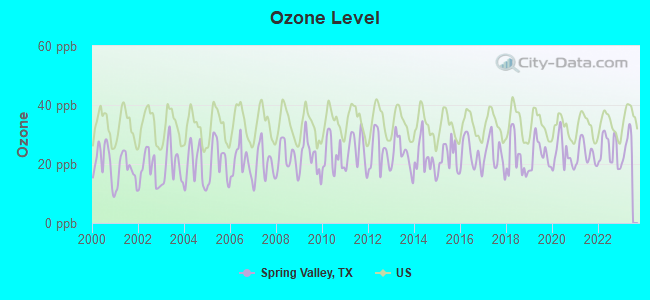
Ozone [ppb] level in 2022 was 24.9. This is better than average. Closest monitor was 3.2 miles away from the city center.
| City: | 24.9 |
| U.S.: | 33.3 |
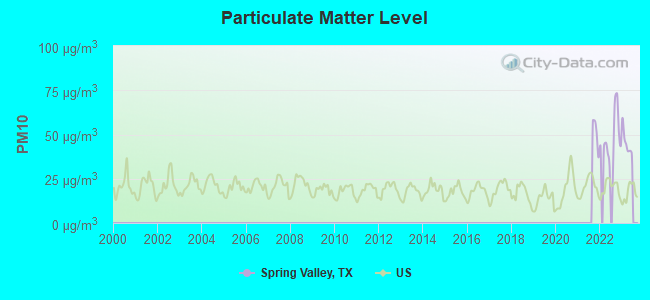
Particulate Matter (PM10) [µg/m3] level in 2022 was 48.1. This is significantly worse than average. Closest monitor was 3.2 miles away from the city center.
| City: | 48.1 |
| U.S.: | 19.2 |
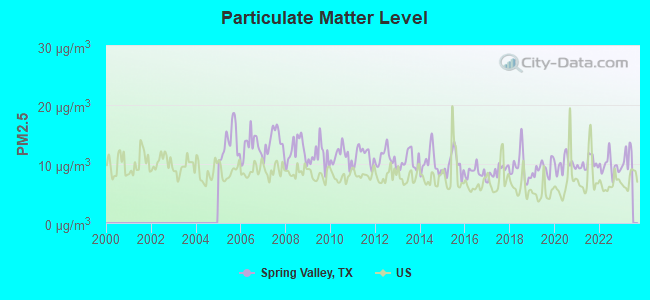
Particulate Matter (PM2.5) [µg/m3] level in 2022 was 9.63. This is about average. Closest monitor was 6.5 miles away from the city center.
| City: | 9.63 |
| U.S.: | 8.11 |
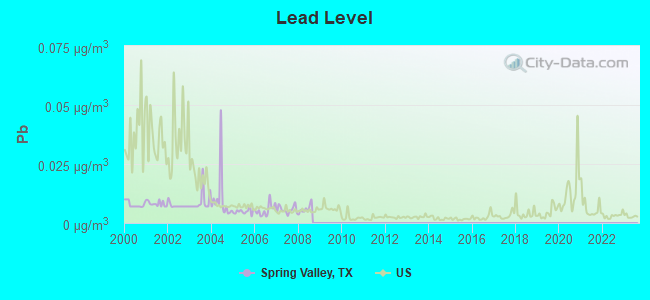
Lead (Pb) [µg/m3] level in 2008 was 0.00590. This is significantly better than average. Closest monitor was 2.4 miles away from the city center.
| City: | 0.00590 |
| U.S.: | 0.00931 |
Tornado activity:
Spring Valley-area historical tornado activity is slightly above Texas state average. It is 85% greater than the overall U.S. average.
On 11/21/1992, a category F4 (max. wind speeds 207-260 mph) tornado 14.1 miles away from the Spring Valley city center injured 16 people and caused between $50,000,000 and $500,000,000 in damages.
On 2/5/1986, a category F3 (max. wind speeds 158-206 mph) tornado 13.2 miles away from the city center killed 2 people and caused between $5,000,000 and $50,000,000 in damages.
Earthquake activity:
Spring Valley-area historical earthquake activity is significantly above Texas state average. It is 35% smaller than the overall U.S. average.On 5/17/2012 at 08:12:00, a magnitude 4.8 (4.8 MW, Depth: 3.1 mi, Class: Light, Intensity: IV - V) earthquake occurred 162.4 miles away from the city center
On 10/20/2011 at 12:24:41, a magnitude 4.8 (4.8 MW, Depth: 3.1 mi) earthquake occurred 167.9 miles away from the city center
On 9/2/2013 at 23:51:15, a magnitude 4.3 (4.3 MW, Depth: 2.9 mi) earthquake occurred 160.0 miles away from the city center
On 4/9/1993 at 12:29:19, a magnitude 4.3 (4.1 MB, 4.3 LG, Depth: 3.1 mi) earthquake occurred 171.9 miles away from Spring Valley center
On 9/2/2013 at 21:52:38, a magnitude 4.2 (4.2 MW, Depth: 3.0 mi) earthquake occurred 161.3 miles away from the city center
On 1/25/2013 at 07:01:19, a magnitude 4.1 (4.1 MB, Depth: 3.1 mi) earthquake occurred 159.1 miles away from the city center
Magnitude types: regional Lg-wave magnitude (LG), body-wave magnitude (MB), moment magnitude (MW)
Natural disasters:
The number of natural disasters in Harris County (32) is a lot greater than the US average (15).Major Disasters (Presidential) Declared: 22
Emergencies Declared: 6
Causes of natural disasters: Storms: 16, Floods: 15, Hurricanes: 9, Tornadoes: 7, Tropical Storms: 4, Fires: 2, Winds: 2, Other: 1 (Note: some incidents may be assigned to more than one category).

Hospitals and medical centers near Spring Valley:
- CONFIDENT CARE HOME HEALTH SERVICES INC (Home Health Center, about 1 miles away; HOUSTON, TX)
- WOODRIDGE NURSING AND REHABILITATION (Nursing Home, about 1 miles away; HOUSTON, TX)
- SPRING BRANCH MEDICAL CENTER (Hospital, about 1 miles away; HOUSTON, TX)
- SAM HOUSTON MEMORIAL HOSPITAL (Hospital, about 1 miles away; HOUSTON, TX)
- SPRING BRANCH MEDICAL CTR SNF SAM HOUS (Nursing Home, about 1 miles away; HOUSTON, TX)
- SPRING BRANCH TRANSITIONAL CARE CENTER (Nursing Home, about 1 miles away; HOUSTON, TX)
- HOME CARE PROVIDERS INC (Home Health Center, about 2 miles away; HOUSTON, TX)
Amtrak stations near Spring Valley:
- 9 miles: HOUSTON (902 WASHINGTON AVE.) . Services: ticket office, fully wheelchair accessible, enclosed waiting area, public restrooms, public payphones, vending machines, free short-term parking, free long-term parking, taxi stand, public transit connection.
- 19 miles: SOUTH HOUSTON (1546 COLLEGE) - Bus Station
Colleges/universities with over 2000 students nearest to Spring Valley:
- The Art Institute of Houston (about 6 miles; Houston, TX; Full-time enrollment: 2,429)
- Houston Baptist University (about 7 miles; Houston, TX; FT enrollment: 2,340)
- University of St Thomas (about 8 miles; Houston, TX; FT enrollment: 2,747)
- Rice University (about 8 miles; Houston, TX; FT enrollment: 6,713)
- Houston Community College (about 9 miles; Houston, TX; FT enrollment: 38,303)
- The University of Texas Health Science Center at Houston (about 9 miles; Houston, TX; FT enrollment: 3,023)
- University of Houston-Downtown (about 9 miles; Houston, TX; FT enrollment: 10,122)
Public high schools in Spring Valley:
- SAN ANGELO STATE SCHOOL (Students: 11, Location: 18000 WILDCAT DR, Grades: 9)
- WATER VALLEY VOC TRAIN (Location: 17974 COMMERCE, Grades: 9-12)
- WATER VALLEY H S (Location: 17886 WILDCAT DR, Grades: 7-12)
- FAIRVIEW SPECIAL PROGRAMS (Location: 17886 WILDCAT DR, Grades: 7-11)
- WATER VALLEY / VERIBEST SPECIAL PROGRAMS (Location: 18000 WILDCAT DR, Grades: PK-12)
Public elementary/middle schools in Spring Valley:
- WATER VALLEY EL (Students: 179, Location: 15575 ADAMS AVE, Grades: PK-6)
- WALL SPECIAL PROGRAMS (Location: 15575 ADAMS AVE, Grades: 1-5)
Points of interest:
Notable locations in Spring Valley: Spring Valley Police Department (A), City of Spring Valley Fire Department (B). Display/hide their locations on the map
Churches in Spring Valley include: Korean Presbyterian Church of Houston (A), Spring Branch Church of the Nazarene (B), Grace Community Church of Houston (C), Grace Chinese American New Testament Fellowship Church (D). Display/hide their locations on the map
Park in Spring Valley: Reggie Grob Stadium (1). Display/hide its location on the map
| This city: | 2.6 people |
| Texas: | 2.7 people |
| This city: | 79.1% |
| Whole state: | 71.5% |
| This city: | 2.2% |
| Whole state: | 4.4% |
Likely homosexual households (counted as self-reported same-sex unmarried-partner households)
- Lesbian couples: 0.3% of all households
- Gay men: 0.4% of all households
| This city: | 2.7% |
| Whole state: | 15.4% |
| This city: | 1.4% |
| Whole state: | 6.7% |
For population 15 years and over in Spring Valley:
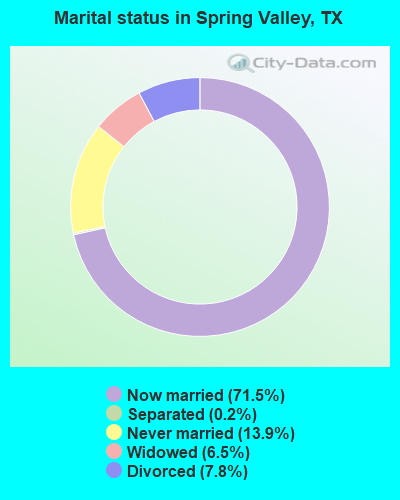
- Never married: 13.9%
- Now married: 71.5%
- Separated: 0.2%
- Widowed: 6.5%
- Divorced: 7.8%
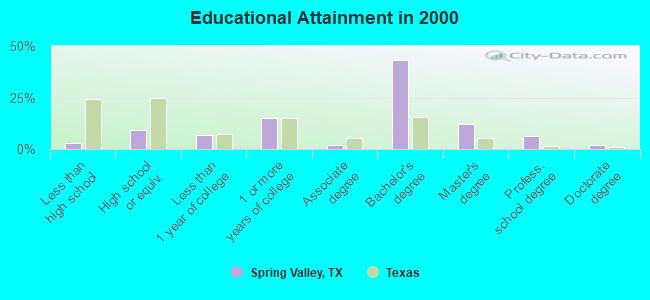
For population 25 years and over in Spring Valley:
- High school or higher: 96.9%
- Bachelor's degree or higher: 63.7%
- Graduate or professional degree: 20.6%
- Unemployed: 3.7%
- Mean travel time to work (commute): 20.7 minutes
| Here: | 8.5 |
| Texas average: | 15.6 |
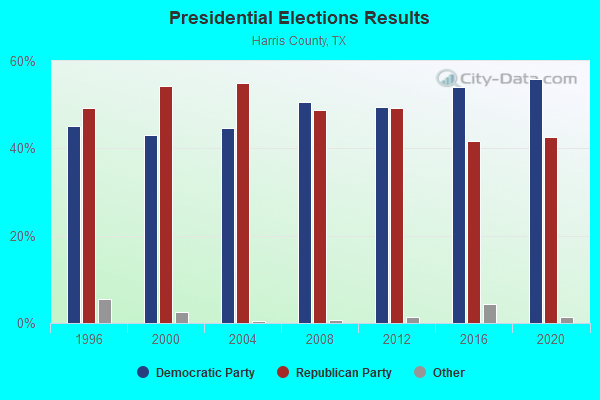
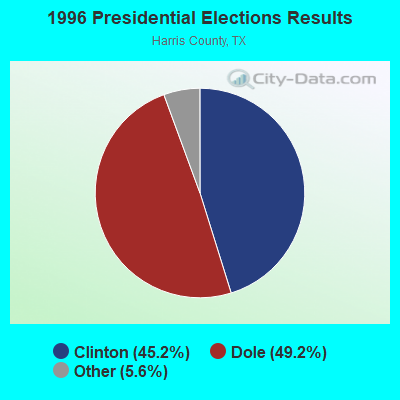
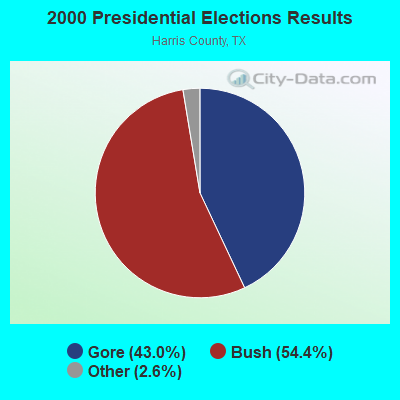
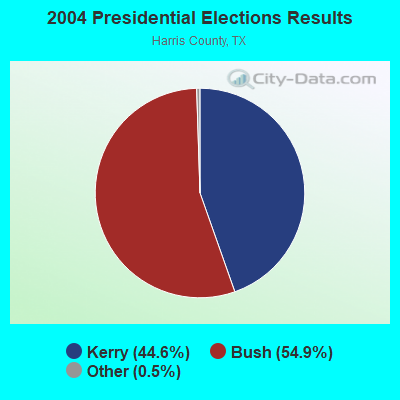
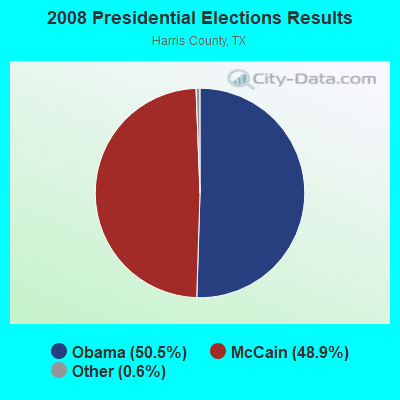
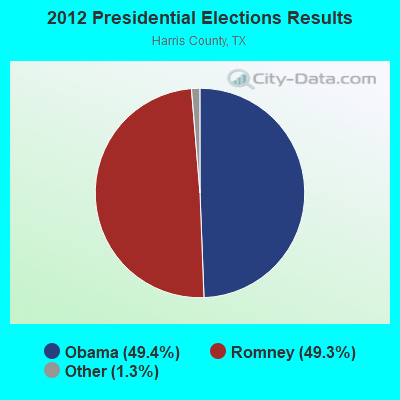
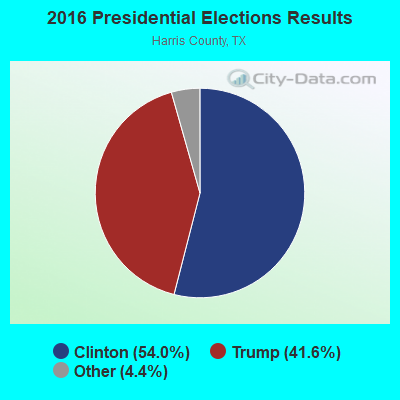
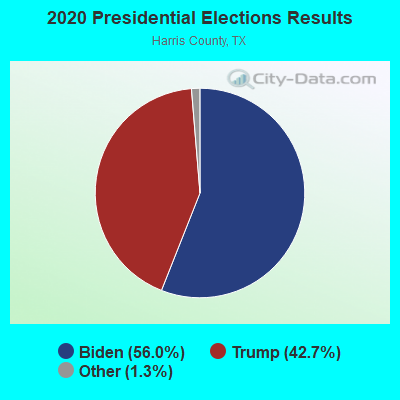
Graphs represent county-level data. Detailed 2008 Election Results
Religion statistics for Spring Valley, TX (based on Harris County data)
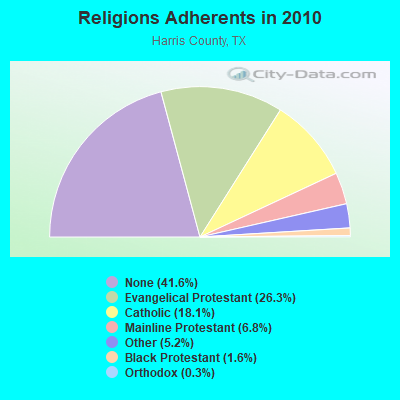
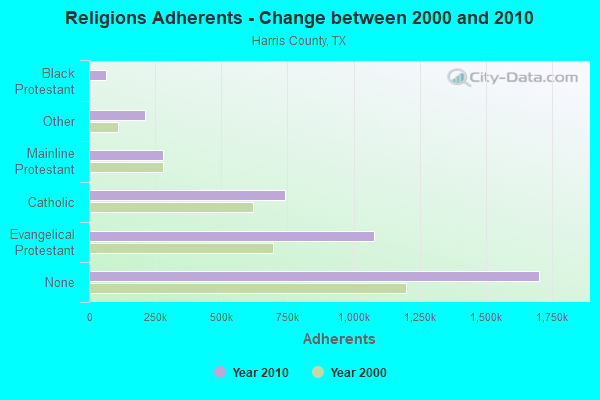
| Religion | Adherents | Congregations |
|---|---|---|
| Evangelical Protestant | 1,077,287 | 2,102 |
| Catholic | 741,896 | 109 |
| Mainline Protestant | 278,855 | 288 |
| Other | 213,212 | 296 |
| Black Protestant | 65,641 | 211 |
| Orthodox | 12,884 | 25 |
| None | 1,702,684 | - |
Food Environment Statistics:
| This county: | 1.88 / 10,000 pop. |
| State: | 1.47 / 10,000 pop. |
| Harris County: | 0.10 / 10,000 pop. |
| State: | 0.14 / 10,000 pop. |
| Here: | 1.35 / 10,000 pop. |
| Texas: | 1.11 / 10,000 pop. |
| Harris County: | 3.38 / 10,000 pop. |
| Texas: | 3.95 / 10,000 pop. |
| This county: | 5.88 / 10,000 pop. |
| State: | 6.13 / 10,000 pop. |
| This county: | 8.9% |
| State: | 8.9% |
| Here: | 26.0% |
| State: | 26.6% |
| Harris County: | 17.1% |
| Texas: | 15.7% |
| Local government employment and payroll (March 2022) | |||||
| Function | Full-time employees | Monthly full-time payroll | Average yearly full-time wage | Part-time employees | Monthly part-time payroll |
|---|---|---|---|---|---|
| Police Protection - Officers | 17 | $87,536 | $61,790 | 0 | $0 |
| Police - Other | 9 | $50,076 | $66,768 | 2 | $967 |
| Water Supply | 5 | $23,335 | $56,004 | 0 | $0 |
| Other Government Administration | 5 | $31,274 | $75,058 | 0 | $0 |
| Financial Administration | 3 | $14,980 | $59,920 | 0 | $0 |
| Judicial and Legal | 2 | $7,490 | $44,940 | 0 | $0 |
| Streets and Highways | 2 | $5,720 | $34,320 | 0 | $0 |
| Totals for Government | 43 | $220,411 | $61,510 | 2 | $967 |
5.26% of this county's 2021 resident taxpayers lived in other counties in 2020 ($67,872 average adjusted gross income)
| Here: | 5.26% |
| Texas average: | 8.12% |
0.02% of residents moved from foreign countries ($158 average AGI)
Harris County: 0.02% Texas average: 0.04%
Top counties from which taxpayers relocated into this county between 2020 and 2021:
| from Fort Bend County, TX | |
| from Montgomery County, TX | |
| from Galveston County, TX |
5.91% of this county's 2020 resident taxpayers moved to other counties in 2021 ($76,622 average adjusted gross income)
| Here: | 5.91% |
| Texas average: | 7.40% |
0.01% of residents moved to foreign countries ($155 average AGI)
Harris County: 0.01% Texas average: 0.03%
Top counties to which taxpayers relocated from this county between 2020 and 2021:
| to Fort Bend County, TX | |
| to Montgomery County, TX | |
| to Brazoria County, TX |
Businesses in Spring Valley, TX
- Starbucks: 1
Strongest AM radio stations in Spring Valley:
- KMIC (1590 AM; 5 kW; HOUSTON, TX; Owner: ABC, INC)
- KILT (610 AM; 5 kW; HOUSTON, TX; Owner: TEXAS INFINITY BROADCASTING L.P.)
- KBME (790 AM; 5 kW; HOUSTON, TX; Owner: AMFM TEXAS LICENSES LTD. PARTNERSHIP)
- KEYH (850 AM; 10 kW; HOUSTON, TX; Owner: LIBERMAN BROADCASTING OF HOUSTON LICENSE CORP.)
- KGOL (1180 AM; 50 kW; HUMBLE, TX; Owner: ENTRAVISION HOLDINGS, LLC)
- KTRH (740 AM; 50 kW; HOUSTON, TX; Owner: AMFM TEXAS LICENSES LIMITED PARTNERSHIP)
- KKHT (1070 AM; 10 kW; HOUSTON, TX; Owner: SOUTH TEXAS BROADCASTING, INC.)
- KLAT (1010 AM; 10 kW; HOUSTON, TX; Owner: TICHENOR LICENSE CORPORATION ("TLC"))
- KILE (1560 AM; 50 kW; BELLAIRE, TX; Owner: THE RAFTT CORPORATION)
- KPRC (950 AM; 5 kW; HOUSTON, TX; Owner: CCB TEXAS LICENSES, L.P.)
- KSEV (700 AM; 15 kW; TOMBALL, TX; Owner: LIBERMAN BROADCASTING OF HOUSTON LICENSE CORP.)
- KQUE (1230 AM; 1 kW; HOUSTON, TX; Owner: LIBERMAN BROADCASTING OF HOUSTON LICENSE CORP.)
- KCOH (1430 AM; 5 kW; HOUSTON, TX; Owner: KCOH, INC.)
Strongest FM radio stations in Spring Valley:
- KMJQ (102.1 FM; HOUSTON, TX; Owner: RADIO ONE LICENSES, LLC)
- KPFT (90.1 FM; HOUSTON, TX; Owner: PACIFICA FOUNDATION, INC.)
- KBXX (97.9 FM; HOUSTON, TX; Owner: RADIO ONE LICENSES, LLC)
- KHJZ-FM (95.7 FM; HOUSTON, TX; Owner: TEXAS INFINITY BROADCASTING L.P.)
- KHMX (96.5 FM; HOUSTON, TX; Owner: CITICASTERS LICENSES, L.P.)
- KILT-FM (100.3 FM; HOUSTON, TX; Owner: TEXAS INFINITY BROADCASTING L.P.)
- KKBQ-FM (92.9 FM; PASADENA, TX; Owner: CXR HOLDINGS, INC.)
- KLOL (101.1 FM; HOUSTON, TX; Owner: AMFM TEXAS LICENSES LIMITED PARTNERSHIP)
- KODA (99.1 FM; HOUSTON, TX; Owner: AMFM TEXAS LICENSES LIMITED PARTNERSHIP)
- KTBZ-FM (94.5 FM; HOUSTON, TX; Owner: AMFM TEXAS LICENSES LIMITED PARTNERSHIP)
- KRBE (104.1 FM; HOUSTON, TX; Owner: KRBE LICO, INC.)
- KKRW (93.7 FM; HOUSTON, TX; Owner: CAPSTAR TX LIMITED PARTNERSHIP)
- KUHF (88.7 FM; HOUSTON, TX; Owner: UNIVERSITY OF HOUSTON SYSTEM)
- KLTN (102.9 FM; HOUSTON, TX; Owner: HBC HOUSTON LICENSE CORPORATION)
- KHCB-FM (105.7 FM; HOUSTON, TX; Owner: HOUSTON CHRISTIAN BROADCASTERS, INC.)
- KPTY (104.9 FM; MISSOURI CITY, TX; Owner: TICHENOR LICENSE CORPORATION ("TLC"))
- K259AB (99.7 FM; SUGAR LAND, TX; Owner: THE KSBJ EDUCATIONAL FOUNDATION)
- KLDE (107.5 FM; LAKE JACKSON, TX; Owner: CXR HOLDINGS, INC.)
- KHPT (106.9 FM; CONROE, TX; Owner: CXR HOLDINGS, INC.)
- KTSU (90.9 FM; HOUSTON, TX; Owner: TEXAS SOUTHERN UNIVERSITY)
TV broadcast stations around Spring Valley:
- KPRC-TV (Channel 2; HOUSTON, TX; Owner: POST-NEWSWEEK STATIONS, HOUSTON, LP)
- KHOU-TV (Channel 11; HOUSTON, TX; Owner: KHOU-TV, L.P.)
- KVVV-LP (Channel 53; HOUSTON, TX; Owner: KAZH LICENSE, LLC)
- KRIV (Channel 26; HOUSTON, TX; Owner: FOX TELEVISION STATIONS, INC.)
- KPXB (Channel 49; CONROE, TX; Owner: PAXSON HOUSTON LICENSE, INC.)
- KTRK-TV (Channel 13; HOUSTON, TX; Owner: KTRK TELEVISION, INC.)
- KFTH (Channel 67; ALVIN, TX; Owner: TELEFUTURA HOUSTON LLC)
- KHWB (Channel 39; HOUSTON, TX; Owner: KHWB, INC.)
- KUHT (Channel 8; HOUSTON, TX; Owner: UNIVERSITY OF HOUSTON SYSTEM)
- KTBU (Channel 55; CONROE, TX; Owner: HUMANITY INTERESTED MEDIA, INC.)
- KTXH (Channel 20; HOUSTON, TX; Owner: FOX TELEVISION STATIONS, INC.)
- KNWS-TV (Channel 51; KATY, TX; Owner: JOHNSON BROADCASTING, INC.)
- KXLN-TV (Channel 45; ROSENBERG, TX; Owner: KXLN LICENSE PARTNERSHIP, L.P.)
- KVDO-LP (Channel 69; CLEAR LAKE, TX; Owner: FAR EASTERN TELECASTERS)
- KZJL (Channel 61; HOUSTON, TX; Owner: KZJL LICENSE CORP.)
- KETH (Channel 14; HOUSTON, TX; Owner: COMMUNITY EDUCATIONAL TV, INC.)
- KBPX-LP (Channel 33; HOUSTON, TX; Owner: PAXSON COMMUNICATIONS LPTV, INC.)
- K30CV (Channel 30; HOUSTON, TX; Owner: BROADCASTING SYSTEMS, INC.)
- KHMV-LP (Channel 28; HOUSTON, TX; Owner: PAPPAS TELECASTING OF THE GULF COAST, A CALIFORNIA LP)
- KVIT-LP (Channel 28; VICTORIA, TX; Owner: CLUB COMMUNICATIONS)
- KJIB-LP (Channel 5; CLEAR LAKE CITY, TX; Owner: FAR EASTERN TELECASTERS)
- KTMD (Channel 48; GALVESTON, TX; Owner: TELEMUNDO OF TEXAS PARTNERSHIP, LP)
- KVQT-LP (Channel 24; HOUSTON, TX; Owner: C. DOWEN JOHNSON)
- KLTJ (Channel 22; GALVESTON, TX; Owner: WORD OF GOD FELLOWSHIP, INC.)
- KAZH (Channel 57; BAYTOWN, TX; Owner: KAZH LICENSE, LLC)
FCC Registered Antenna Towers:
26 (See the full list of FCC Registered Antenna Towers in Spring Valley)FCC Registered Private Land Mobile Towers:
1- 1.2 Mi Ne Us290 & Jones Rd Jct (Lat: 29.905778 Lon: -95.574944), Structure height: 61 m, Call Sign: WNZK877,
Assigned Frequencies: 862.137 MHz, 862.162 MHz, 862.187 MHz, 862.212 MHz, 862.237 MHz, 862.337 MHz, 862.362 MHz, 862.387 MHz, 862.462 MHz, 862.487 MHz... (+84 more), Grant Date: 07/06/2017, Expiration Date: 07/30/2027, Cancellation Date: 06/11/2020, Certifier: Kyle B Entz, Registrant: Sprint Corporation, 12502 Sunrise Valley Drive, M/S: Varesa0209, Reston, VA 20196, Phone: (800) 572-8256, Fax: (703) 433-4483, Email:
FCC Registered Broadcast Land Mobile Towers:
2- 8400 Central Memorial Parkway (Lat: 29.785500 Lon: -95.494944), Type: Pole, Structure height: 30.5 m, Overall height: 36 m, Call Sign: KWF852,
Assigned Frequencies: 453.275 MHz, Grant Date: 06/19/2014, Expiration Date: 09/14/2024, Registrant: City Of Spring Valley, 1025 Campbell Rd, Houston, TX 77055, Phone: (713) 465-8323, Fax: (713) 465-3135, Email:
- 1025 Campbell Rd (Lat: 29.787444 Lon: -95.515500), Call Sign: KWF851, Licensee ID: L00117746,
Assigned Frequencies: 155.370 MHz, Grant Date: 06/30/2004, Expiration Date: 09/14/2014, Cancellation Date: 11/15/2014, Registrant: City Of Spring Valley, 1025 Campbell Rd, Houston, TX 77055
FCC Registered Microwave Towers:
3- 1962MRCAMBELAP, Lat: 29.794444 Lon: -95.507694, Type: Upole, Structure height: 6.1 m, Call Sign: WQJY595,
Assigned Frequencies: 3650.00 MHz, Grant Date: 02/12/2019, Expiration Date: 10/17/2020, Cancellation Date: 12/19/2020, Certifier: Gregory A Angst Pe, Registrant: Mona Lee & Associates, 3730 Kirby Drive, Suite 1200 Pmb 165, Houston, TX 77098, Phone: (832) 850-7646, Email:
- TX-HOU5328B, 10660 Jones Rd (Lat: 29.927500 Lon: -95.583444), Type: Tower, Structure height: 36.9 m, Overall height: 38.4 m, Call Sign: WQLK963,
Assigned Frequencies: 17815.0 MHz, 17915.0 MHz, 11585.0 MHz, 11665.0 MHz, Grant Date: 04/21/2020, Expiration Date: 02/26/2030, Cancellation Date: 09/10/2021, Certifier: Nadja S Sodos-Wallace, Registrant: T-Mobile Usa, Inc., 12920 Se 38th Street, Bellevue, WA 98006, Phone: (425) 383-8402, Fax: (425) 383-4840, Email:
- TS-HOU0015, Katy Fwy, 2 Blocks W Of Campbell Road (Lat: 29.785278 Lon: -95.516111), Type: Building, Structure height: 6.1 m, Overall height: 7.9 m, Call Sign: WQNM959,
Assigned Frequencies: 17760.0 MHz, Grant Date: 03/28/2011, Expiration Date: 03/28/2021, Cancellation Date: 03/08/2021, Certifier: Arthur G Giftakis, Registrant: Towerstream Corp, 76 Hammarlund Way, Middletown, RI 02842, Phone: (401) 608-8308, Fax: (866) 762-2250, Email:
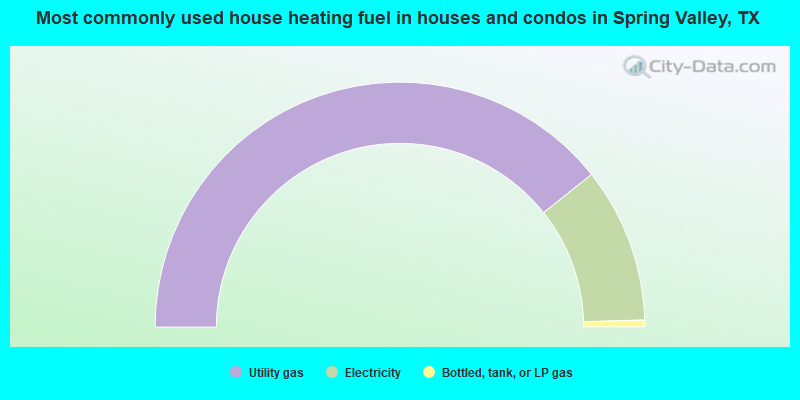
- 78.7%Utility gas
- 20.5%Electricity
- 0.9%Bottled, tank, or LP gas
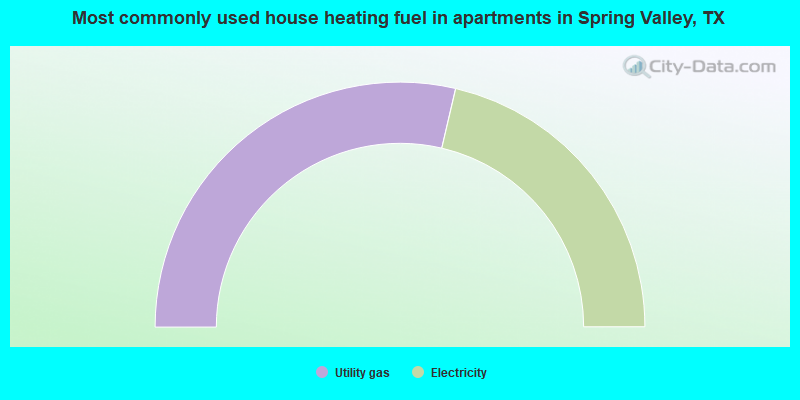
- 57.3%Utility gas
- 42.7%Electricity
Spring Valley compared to Texas state average:
- Median household income above state average.
- Median house value significantly above state average.
- Unemployed percentage significantly below state average.
- Black race population percentage significantly below state average.
- Hispanic race population percentage significantly below state average.
- Median age significantly above state average.
- Foreign-born population percentage below state average.
- Renting percentage significantly below state average.
- Length of stay since moving in significantly above state average.
- Number of rooms per house significantly below state average.
- House age significantly below state average.
- Percentage of population with a bachelor's degree or higher significantly above state average.

|
Total of 5 patent applications in 2008-2024.