Races in Stratford, New Jersey (NJ) Detailed Stats
Data:
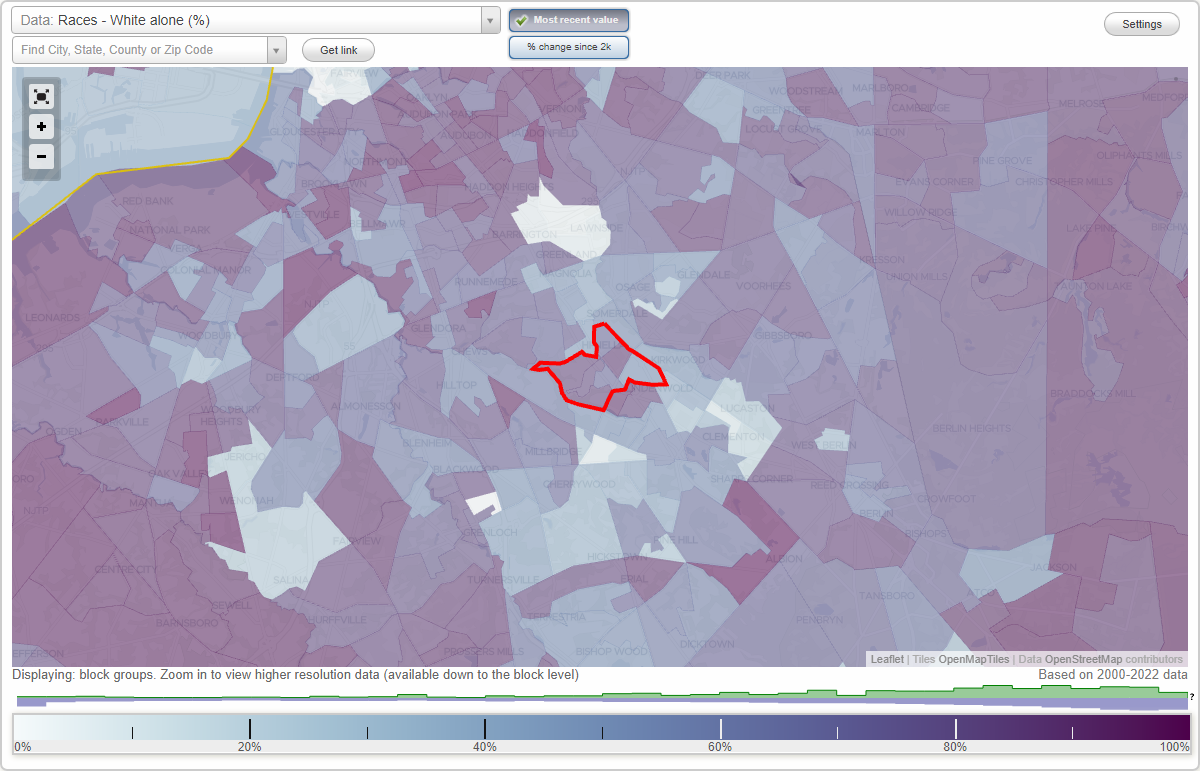
Races - White alone (%)
Races - White alone (% change since 2000)
Races - Black alone (%)
Races - Black alone (% change since 2000)
Races - American Indian alone (%)
Races - American Indian alone (% change since 2000)
Races - Asian alone (%)
Races - Asian alone (% change since 2000)
Races - Hispanic (%)
Races - Hispanic (% change since 2000)
Races - Native Hawaiian and Other Pacific Islander alone (%)
Races - Native Hawaiian and Other Pacific Islander alone (% change since 2000)
Races - Two or more races(%)
Races - Two or more races(% change since 2000)
Races - Other race alone (%)
Races - Other race alone (% change since 2000)
Racial diversity
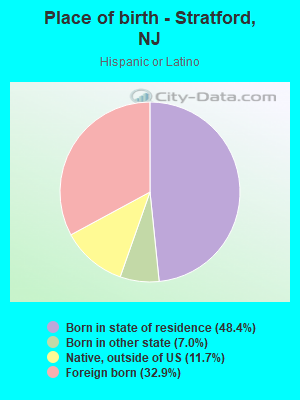
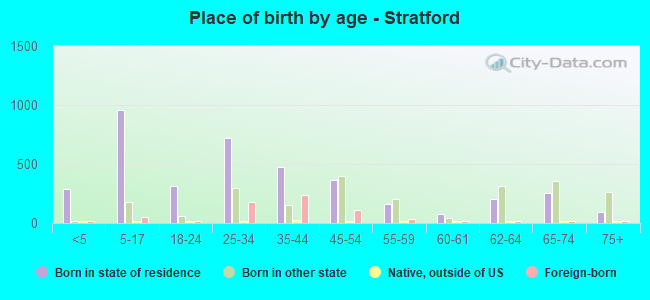
Place of birth - Born in state of residence (%)
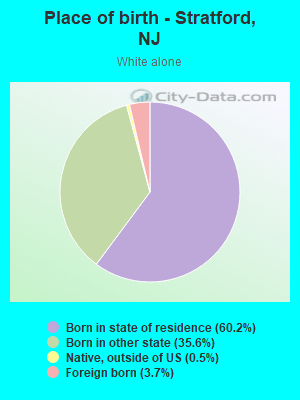
Place of birth - Born in state of residence (%) - White
Place of birth - Born in state of residence (%) - Black or African American
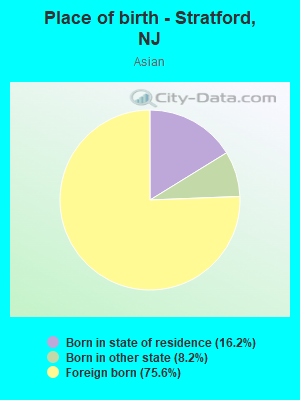
Place of birth - Born in state of residence (%) - Asian
Place of birth - Born in state of residence (%) - Hispanic or Latino
Place of birth - Born in state of residence (%) - American Indian and Alaska Native
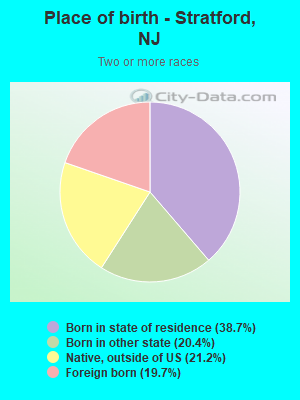
Place of birth - Born in state of residence (%) - Multirace
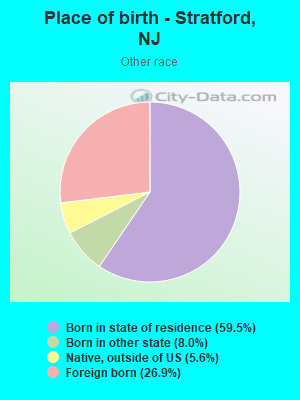
Place of birth - Born in state of residence (%) - Other Race
Place of birth - Born in other state (%)
Place of birth - Born in other state (%) - White
Place of birth - Born in other state (%) - Black or African American
Place of birth - Born in other state (%) - Asian
Place of birth - Born in other state (%) - Hispanic or Latino
Place of birth - Born in other state (%) - American Indian and Alaska Native
Place of birth - Born in other state (%) - Multirace
Place of birth - Born in other state (%) - Other Race
Place of birth - Native, outside of US (%)
Place of birth - Native, outside of US (%) - White
Place of birth - Native, outside of US (%) - Black or African American
Place of birth - Native, outside of US (%) - Asian
Place of birth - Native, outside of US (%) - Hispanic or Latino
Place of birth - Native, outside of US (%) - American Indian and Alaska Native
Place of birth - Native, outside of US (%) - Multirace
Place of birth - Native, outside of US (%) - Other Race
Place of birth - Foreign born (%)
Place of birth - Foreign born (%) - White
Place of birth - Foreign born (%) - Black or African American
Place of birth - Foreign born (%) - Asian
Place of birth - Foreign born (%) - Hispanic or Latino
Place of birth - Foreign born (%) - American Indian and Alaska Native
Place of birth - Foreign born (%) - Multirace
Place of birth - Foreign born (%) - Other Race
Residents speaking English at home (%)
Residents speaking English at home - Born in the United States (%)
Residents speaking English at home - Native, born elsewhere (%)
Residents speaking English at home - Foreign born (%)
Residents speaking Spanish at home (%)
Residents speaking Spanish at home - Born in the United States (%)
Residents speaking Spanish at home - Native, born elsewhere (%)
Residents speaking Spanish at home - Foreign born (%)
Residents speaking other language at home (%)
Residents speaking other language at home - Born in the United States (%)
Residents speaking other language at home - Native, born elsewhere (%)
Residents speaking other language at home - Foreign born (%)
Marital status - Never married (%)
Marital status - Now married (%)
Marital status - Separated (%)
Marital status - Widowed (%)
Marital status - Divorced (%)
Ancestries Reported - Arab (%)
Ancestries Reported - Czech (%)
Ancestries Reported - Danish (%)
Ancestries Reported - Dutch (%)
Ancestries Reported - English (%)
Ancestries Reported - French (%)
Ancestries Reported - French Canadian (%)
Ancestries Reported - German (%)
Ancestries Reported - Greek (%)
Ancestries Reported - Hungarian (%)
Ancestries Reported - Irish (%)
Ancestries Reported - Italian (%)
Ancestries Reported - Lithuanian (%)
Ancestries Reported - Norwegian (%)
Ancestries Reported - Polish (%)
Ancestries Reported - Portuguese (%)
Ancestries Reported - Russian (%)
Ancestries Reported - Scotch-Irish (%)
Ancestries Reported - Scottish (%)
Ancestries Reported - Slovak (%)
Ancestries Reported - Subsaharan African (%)
Ancestries Reported - Swedish (%)
Ancestries Reported - Swiss (%)
Ancestries Reported - Ukrainian (%)
Ancestries Reported - United States (%)
Ancestries Reported - Welsh (%)
Ancestries Reported - West Indian (%)
Ancestries Reported - Other (%)
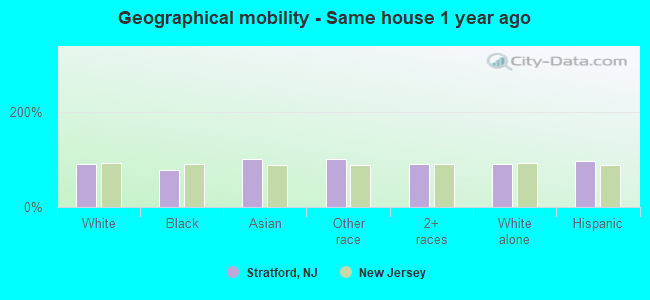
Geographical mobility - Same house 1 year ago (%)
Geographical mobility - Same house 1 year ago (%) - White
Geographical mobility - Same house 1 year ago (%) - Black or African American
Geographical mobility - Same house 1 year ago (%) - Asian
Geographical mobility - Same house 1 year ago (%) - Hispanic or Latino
Geographical mobility - Same house 1 year ago (%) - American Indian and Alaska Native
Geographical mobility - Same house 1 year ago (%) - Multirace
Geographical mobility - Same house 1 year ago (%) - Other Race
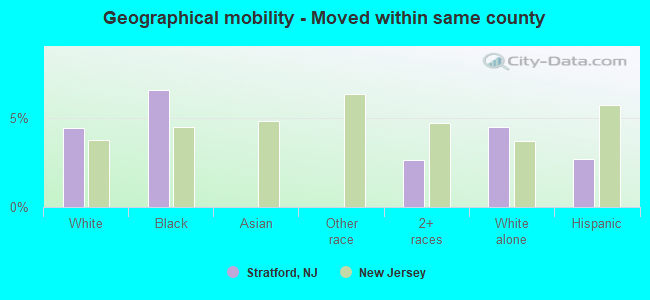
Geographical mobility - Moved within same county (%)
Geographical mobility - Moved within same county (%) - White
Geographical mobility - Moved within same county (%) - Black or African American
Geographical mobility - Moved within same county (%) - Asian
Geographical mobility - Moved within same county (%) - Hispanic or Latino
Geographical mobility - Moved within same county (%) - American Indian and Alaska Native
Geographical mobility - Moved within same county (%) - Multirace
Geographical mobility - Moved within same county (%) - Other Race
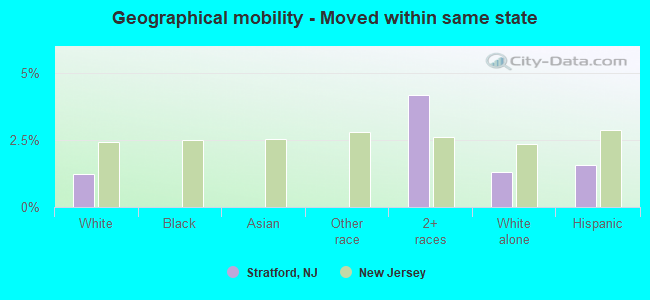
Geographical mobility - Moved from different county within same state (%)
Geographical mobility - Moved from different county within same state (%) - White
Geographical mobility - Moved from different county within same state (%) - Black or African American
Geographical mobility - Moved from different county within same state (%) - Asian
Geographical mobility - Moved from different county within same state (%) - Hispanic or Latino
Geographical mobility - Moved from different county within same state (%) - American Indian and Alaska Native
Geographical mobility - Moved from different county within same state (%) - Multirace
Geographical mobility - Moved from different county within same state (%) - Other Race
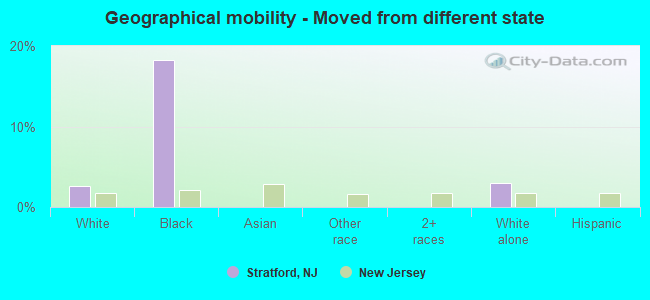
Geographical mobility - Moved from different state (%)
Geographical mobility - Moved from different state (%) - White
Geographical mobility - Moved from different state (%) - Black or African American
Geographical mobility - Moved from different state (%) - Asian
Geographical mobility - Moved from different state (%) - Hispanic or Latino
Geographical mobility - Moved from different state (%) - American Indian and Alaska Native
Geographical mobility - Moved from different state (%) - Multirace
Geographical mobility - Moved from different state (%) - Other Race
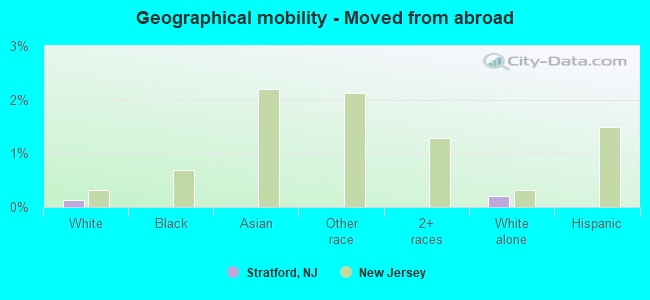
Geographical mobility - Moved from abroad (%)
Geographical mobility - Moved from abroad (%) - White
Geographical mobility - Moved from abroad (%) - Black or African American
Geographical mobility - Moved from abroad (%) - Asian
Geographical mobility - Moved from abroad (%) - Hispanic or Latino
Geographical mobility - Moved from abroad (%) - American Indian and Alaska Native
Geographical mobility - Moved from abroad (%) - Multirace
Geographical mobility - Moved from abroad (%) - Other Race
Place of birth for the foreign-born population - Ireland (%)
Place of birth for the foreign-born population - Denmark (%)
Place of birth for the foreign-born population - Norway (%)
Place of birth for the foreign-born population - Sweden (%)
Place of birth for the foreign-born population - United Kingdom (%)
Place of birth for the foreign-born population - England (%)
Place of birth for the foreign-born population - Scotland (%)
Place of birth for the foreign-born population - Other Northern Europe (%)
Place of birth for the foreign-born population - Austria (%)
Place of birth for the foreign-born population - Belgium (%)
Place of birth for the foreign-born population - France (%)
Place of birth for the foreign-born population - Germany (%)
Place of birth for the foreign-born population - Netherlands (%)
Place of birth for the foreign-born population - Switzerland (%)
Place of birth for the foreign-born population - Other Western Europe (%)
Place of birth for the foreign-born population - Greece (%)
Place of birth for the foreign-born population - Italy (%)
Place of birth for the foreign-born population - Portugal (%)
Place of birth for the foreign-born population - Spain (%)
Place of birth for the foreign-born population - Other Southern Europe (%)
Place of birth for the foreign-born population - Albania (%)
Place of birth for the foreign-born population - Belarus (%)
Place of birth for the foreign-born population - Bosnia and Herzegovina (%)
Place of birth for the foreign-born population - Bulgaria (%)
Place of birth for the foreign-born population - Croatia (%)
Place of birth for the foreign-born population - Czechoslovakia (%)
Place of birth for the foreign-born population - Hungary (%)
Place of birth for the foreign-born population - Latvia (%)
Place of birth for the foreign-born population - Lithuania (%)
Place of birth for the foreign-born population - North Macedonia (Macedonia) (%)
Place of birth for the foreign-born population - Moldova (%)
Place of birth for the foreign-born population - Poland (%)
Place of birth for the foreign-born population - Romania (%)
Place of birth for the foreign-born population - Russia (%)
Place of birth for the foreign-born population - Serbia (%)
Place of birth for the foreign-born population - Ukraine (%)
Place of birth for the foreign-born population - Other Eastern Europe (%)
Place of birth for the foreign-born population - China (%)
Place of birth for the foreign-born population - Hong Kong (%)
Place of birth for the foreign-born population - Taiwan (%)
Place of birth for the foreign-born population - Japan (%)
Place of birth for the foreign-born population - Korea (%)
Place of birth for the foreign-born population - Other Eastern Asia (%)
Place of birth for the foreign-born population - Afghanistan (%)
Place of birth for the foreign-born population - Bangladesh (%)
Place of birth for the foreign-born population - India (%)
Place of birth for the foreign-born population - Iran (%)
Place of birth for the foreign-born population - Kazakhstan (%)
Place of birth for the foreign-born population - Nepal (%)
Place of birth for the foreign-born population - Pakistan (%)
Place of birth for the foreign-born population - Sri Lanka (%)
Place of birth for the foreign-born population - Uzbekistan (%)
Place of birth for the foreign-born population - Other South Central Asia (%)
Place of birth for the foreign-born population - Burma (%)
Place of birth for the foreign-born population - Cambodia (%)
Place of birth for the foreign-born population - Indonesia (%)
Place of birth for the foreign-born population - Laos (%)
Place of birth for the foreign-born population - Malaysia (%)
Place of birth for the foreign-born population - Philippines (%)
Place of birth for the foreign-born population - Singapore (%)
Place of birth for the foreign-born population - Thailand (%)
Place of birth for the foreign-born population - Vietnam (%)
Place of birth for the foreign-born population - Other South Eastern Asia (%)
Place of birth for the foreign-born population - Armenia (%)
Place of birth for the foreign-born population - Iraq (%)
Place of birth for the foreign-born population - Israel (%)
Place of birth for the foreign-born population - Jordan (%)
Place of birth for the foreign-born population - Kuwait (%)
Place of birth for the foreign-born population - Lebanon (%)
Place of birth for the foreign-born population - Saudi Arabia (%)
Place of birth for the foreign-born population - Syria (%)
Place of birth for the foreign-born population - Turkey (%)
Place of birth for the foreign-born population - Yemen (%)
Place of birth for the foreign-born population - Other Western Asia (%)
Place of birth for the foreign-born population - Eritrea (%)
Place of birth for the foreign-born population - Ethiopia (%)
Place of birth for the foreign-born population - Kenya (%)
Place of birth for the foreign-born population - Somalia (%)
Place of birth for the foreign-born population - Uganda (%)
Place of birth for the foreign-born population - Zimbabwe (%)
Place of birth for the foreign-born population - Other Eastern Africa (%)
Place of birth for the foreign-born population - Cameroon (%)
Place of birth for the foreign-born population - Congo (%)
Place of birth for the foreign-born population - Democratic Republic of Congo (Zaire) (%)
Place of birth for the foreign-born population - Other Middle Africa (%)
Place of birth for the foreign-born population - Egypt (%)
Place of birth for the foreign-born population - Morocco (%)
Place of birth for the foreign-born population - Sudan (%)
Place of birth for the foreign-born population - Other Northern Africa (%)
Place of birth for the foreign-born population - South Africa (%)
Place of birth for the foreign-born population - Other Southern Africa (%)
Place of birth for the foreign-born population - Cabo Verde (%)
Place of birth for the foreign-born population - Ghana (%)
Place of birth for the foreign-born population - Liberia (%)
Place of birth for the foreign-born population - Nigeria (%)
Place of birth for the foreign-born population - Senegal (%)
Place of birth for the foreign-born population - Sierra Leone (%)
Place of birth for the foreign-born population - Other Western Africa (%)
Place of birth for the foreign-born population - Australia (%)
Place of birth for the foreign-born population - New Zealand (%)
Place of birth for the foreign-born population - Fiji (%)
Place of birth for the foreign-born population - Micronesia (%)
Place of birth for the foreign-born population - Bahamas (%)
Place of birth for the foreign-born population - Barbados (%)
Place of birth for the foreign-born population - Cuba (%)
Place of birth for the foreign-born population - Dominica (%)
Place of birth for the foreign-born population - Dominican Republic (%)
Place of birth for the foreign-born population - Grenada (%)
Place of birth for the foreign-born population - Haiti (%)
Place of birth for the foreign-born population - Jamaica (%)
Place of birth for the foreign-born population - St. Vincent and the Grenadines (%)
Place of birth for the foreign-born population - Trinidad and Tobago (%)
Place of birth for the foreign-born population - West Indies (%)
Place of birth for the foreign-born population - Other Caribbean (%)
Place of birth for the foreign-born population - Belize (%)
Place of birth for the foreign-born population - Costa Rica (%)
Place of birth for the foreign-born population - El Salvador (%)
Place of birth for the foreign-born population - Guatemala (%)
Place of birth for the foreign-born population - Honduras (%)
Place of birth for the foreign-born population - Mexico (%)
Place of birth for the foreign-born population - Nicaragua (%)
Place of birth for the foreign-born population - Panama (%)
Place of birth for the foreign-born population - Other Central America (%)
Place of birth for the foreign-born population - Argentina (%)
Place of birth for the foreign-born population - Bolivia (%)
Place of birth for the foreign-born population - Brazil (%)
Place of birth for the foreign-born population - Chile (%)
Place of birth for the foreign-born population - Colombia (%)
Place of birth for the foreign-born population - Ecuador (%)
Place of birth for the foreign-born population - Guyana (%)
Place of birth for the foreign-born population - Peru (%)
Place of birth for the foreign-born population - Uruguay (%)
Place of birth for the foreign-born population - Venezuela (%)
Place of birth for the foreign-born population - Other South America (%)
Place of birth for the foreign-born population - Canada (%)
Place of birth for the foreign-born population - Other Northern America (%)
Place of birth for the foreign-born population - Other (%)
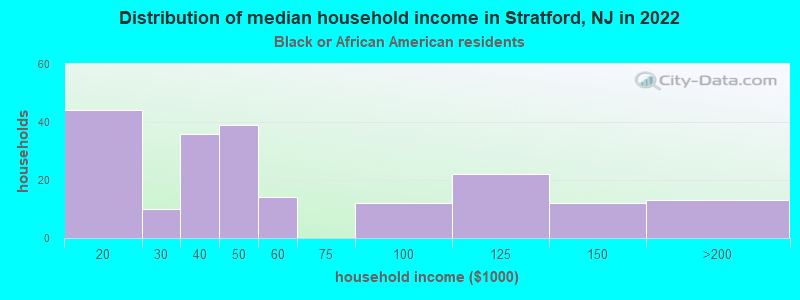
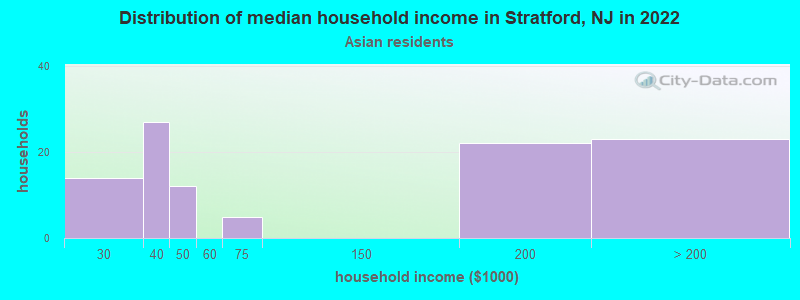
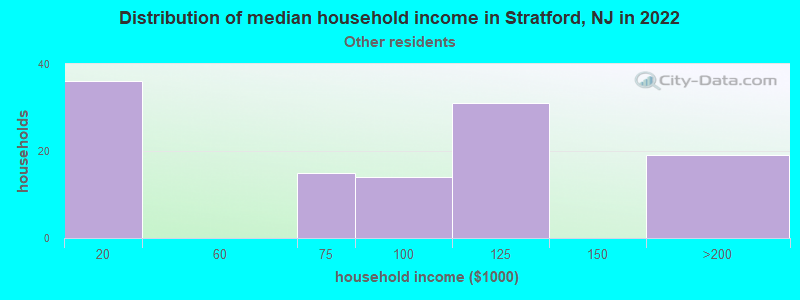
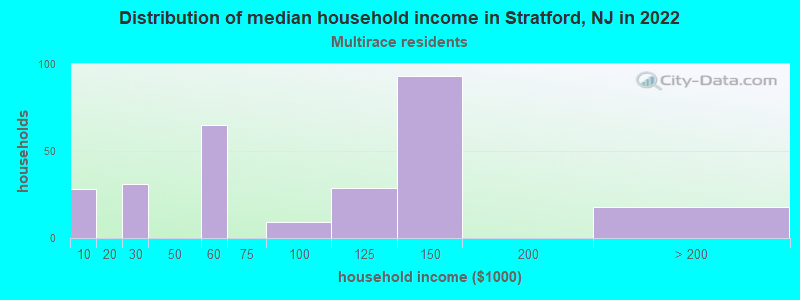
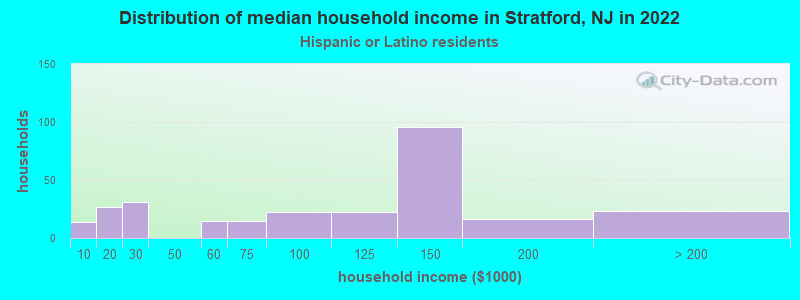
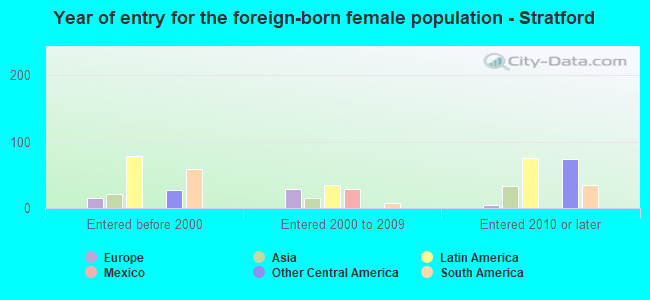
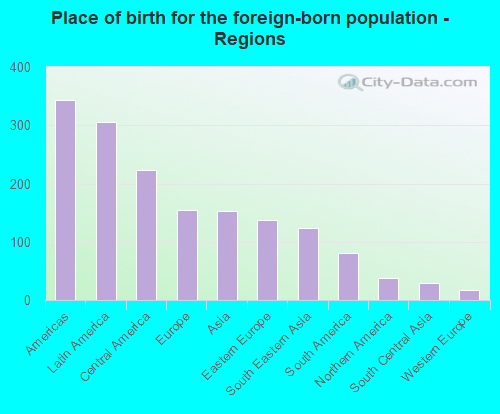
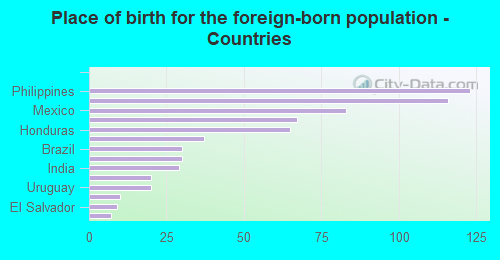
According to 2022 data, the most numerous races in Stratford, NJ are White alone (4,949 residents), Hispanic (986 residents), and Black alone (477 residents). 83.8% of Stratford residents speak English at home. 9.3% of Stratford, NJ residents are foreign-born (4.3% born in Latin America, 2.2% born in Europe, 2.1% born in Asia), which is 147.1% less than the foreign-born rate of 23.0% across the entire state of New Jersey.
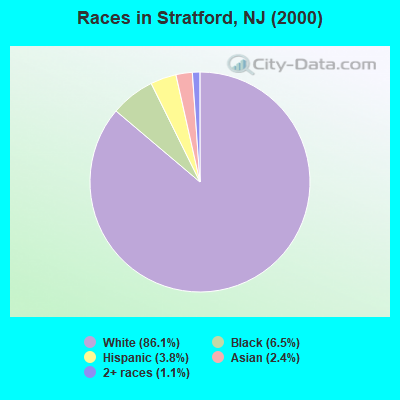
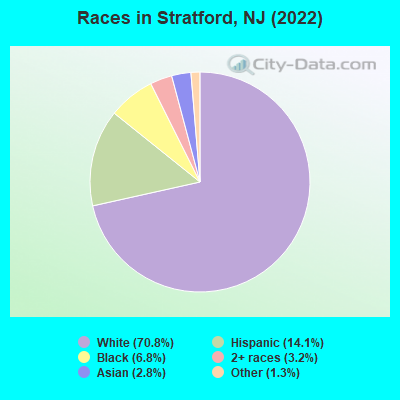
Race distribution in Stratford
2000 2022
5,557,209 66.0% White alone 1,117,191 13.3% Hispanic 1,096,171 13.0% Black alone 477,012 5.7% Asian alone 133,689 1.6% Two or more races 19,565 0.2% Other race alone 11,338 0.1% American Indian alone 2,175 0.03% Native Hawaiian and Other
4,766,476 51.5% White alone 2,028,470 21.9% Hispanic 1,111,632 12.0% Black alone 923,546 10.0% Asian alone 332,237 3.6% Two or more races 89,847 1.0% Other race alone 8,557 0.09% American Indian alone 934 0.01% Native Hawaiian and Other
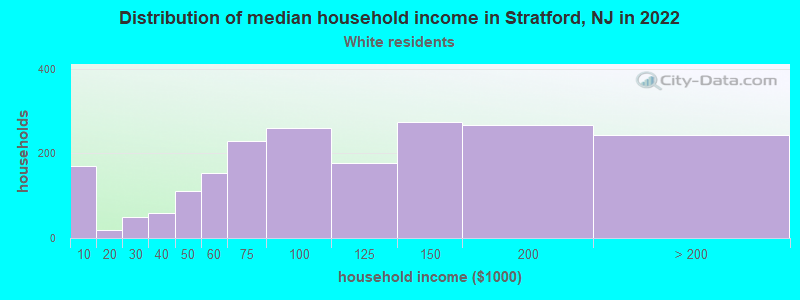
Income and house value in Stratford Median household income in 2022 $95,939 White non-Hispanic householders$43,988 Black householders$72,818 Some other race householders$92,962 Two or more races householders$86,369 Hispanic or Latino race householdersMedian 2022 house value $249,417 White Non-Hispanic householders$185,157 Black or African American householders $240,486 Asian householders$245,061 Two or more races householders$187,989 Hispanic or Latino householders
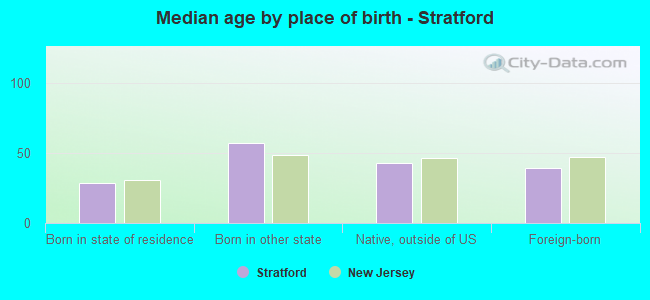
Median age by race in Stratford
42.2 Median age for White residents39.7 49.1 33.2 Median age for Black or African American residents30.5 40.9 -676,272,813.9 Median age for American Indian / Alaska Native residents-670,465,336.5 -688,298,917.7 43.4 Median age for Asian residents36.3 50.5 -701,509,871.5 Median age for Native Hawaiian / Pacific Islander residents-860,335,194.7 -668,881,505.4 26.5 Median age for Other race residents21.8 29.8 50.1 Median age for Two or more races residents50.2 47.6 42.5 Median age for White alone residents39.2 50.1 29.5 Median age for Hispanic or Latino residents33.0 28.6
Owner/renter occupied households by race in Stratford
House owners and renters - White residents 1,685 83.7% Owner occupied329 16.3% Renter occupiedHouse owners and renters - Black or African American residents 68 33.1% Owner occupied137 66.9% Renter occupiedHouse owners and renters - Asian residents 55 61.9% Owner occupied34 38.1% Renter occupiedHouse owners and renters - Other race residents 10 9.5% Owner occupied99 90.5% Renter occupiedHouse owners and renters - Two or more races residents 272 86.6% Owner occupied42 13.4% Renter occupiedHouse owners and renters - White alone residents 1,663 83.0% Owner occupied341 17.0% Renter occupiedHouse owners and renters - Hispanic or Latino residents 158 55.7% Owner occupied125 44.3% Renter occupied
Language usage in Stratford
English speakers - Total 83.8% of residents of Stratford speak English at home.
10.9% of residents speak Spanish at home 441 60.6% Speak English very well287 39.4% Speak English less than very well5.1% of residents speak other language at home 254 74.7% Speak English very well86 25.3% Speak English less than very well
English speakers - Born in the United States 96.6% of residents of Stratford speak English at home.
2.2% of residents speak Spanish at home 49 100.0% Speak English very well1.5% of residents speak other language at home 34 100.0% Speak English very well
English speakers - Native, born elsewhere 38.2% of residents of Stratford speak English at home.
59.7% of residents speak Spanish at home 33 38.4% Speak English very well53 61.6% Speak English less than very well
English speakers - Foreign-born 21.7% of residents of Stratford speak English at home.
46.0% of residents speak Spanish at home 75 24.4% Speak English very well232 75.6% Speak English less than very well32.4% of residents speak other language at home 138 63.9% Speak English very well78 36.1% Speak English less than very well
White (Caucasian) - Speak only English Native:
97.1% (4,435)Foreign-born:
47.8% (88)
White (Caucasian) - Speak another language Native:
3.1% (140)Foreign-born:
51.3% (95)
Asian - Speak only English Native:
92.0% (44)Foreign-born:
7.0% (10)
Asian - Speak another language Native:
18.4% (9)Foreign-born:
92.4% (137)
Other race - Speak another language Native:
56.2% (247)Foreign-born:
99.7% (182)
Two or more races - Speak only English Native:
61.1% (286)Foreign-born:
6.6% (8)
Two or more races - Speak another language Native:
37.0% (173)Foreign-born:
91.4% (109)
White alone - Speak only English Native:
96.1% (4,405)Foreign-born:
47.6% (86)
White alone - Speak another language Native:
4.0% (184)Foreign-born:
50.4% (91)
Hispanic or Latino - Speak only English Native:
44.7% (260)Foreign-born:
7.8% (26)
Hispanic or Latino - Speak another language Native:
55.1% (320)Foreign-born:
91.5% (303)
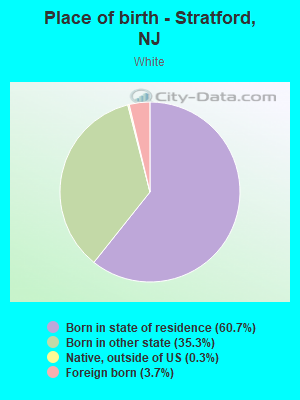
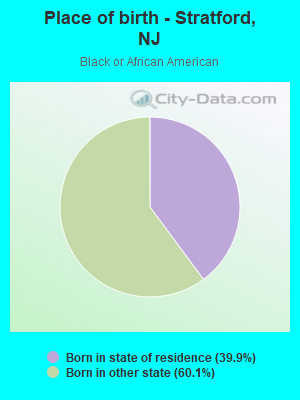
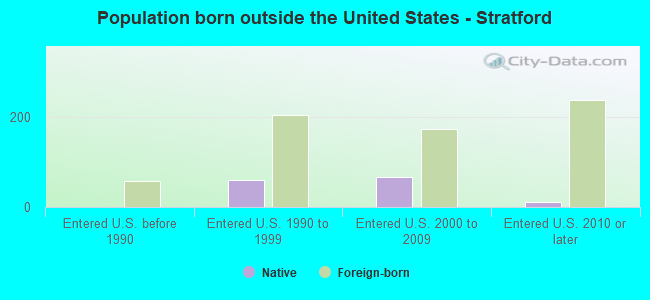
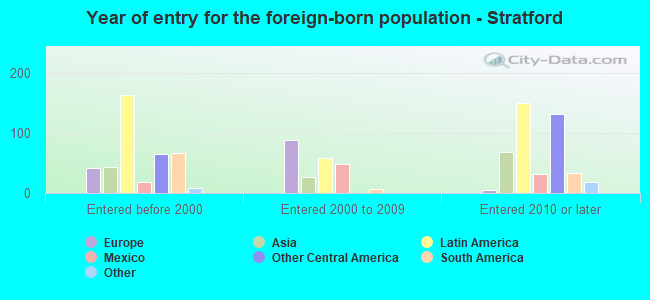
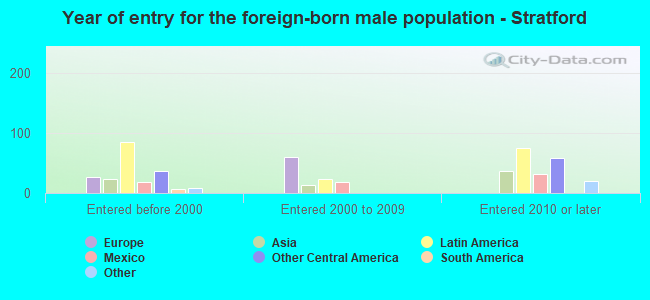
Foreign-born residents in Stratford 651 residents are foreign born (4.3% Latin America , 2.2% Europe , 2.1% Asia ).
This city:
9.3%New Jersey:
23.2%
Marital status for residents in Stratford Marital status - White (Caucasian) population 15 years and over
Males 42.3% Never married49.2% Now married0.5% Separated2.8% Widowed5.2% DivorcedFemales 26.4% Never married54.8% Now married0.4% Separated8.5% Widowed9.9% DivorcedWomen who gave birth in the past 12 months Now married:
100.0% (38)Unmarried:
0.0% (0)
Women who did not give birth in the past 12 months Now married:
39.5% (331)Unmarried:
60.5% (507)
Marital status - Black or African American population 15 years and over
Males 78.5% Never married16.7% Now married0.0% Separated0.0% Widowed4.7% DivorcedFemales 50.3% Never married23.2% Now married16.0% Separated0.0% Widowed10.5% DivorcedWomen who gave birth in the past 12 months Now married:
0.0% (0)Unmarried:
96.7% (1)
Women who did not give birth in the past 12 months Now married:
33.7% (34)Unmarried:
66.3% (67)
Marital status - Asian population 15 years and over
Males 23.0% Never married77.0% Now married0.0% Separated0.0% Widowed0.0% DivorcedFemales 20.0% Never married54.1% Now married11.8% Separated14.1% Widowed0.0% DivorcedWomen who did not give birth in the past 12 months Now married:
67.3% (36)Unmarried:
32.7% (17)
Marital status - Other race population 15 years and over
Males 47.3% Never married52.7% Now married0.0% Separated0.0% Widowed0.0% DivorcedFemales 35.1% Never married52.9% Now married12.1% Separated0.0% Widowed0.0% DivorcedWomen who gave birth in the past 12 months Now married:
0.0% (0)Unmarried:
100.0% (12)
Women who did not give birth in the past 12 months Now married:
67.8% (91)Unmarried:
32.2% (43)
Marital status - Two or more races population 15 years and over
Males 34.5% Never married59.1% Now married0.0% Separated0.0% Widowed6.4% DivorcedFemales 16.0% Never married49.2% Now married4.3% Separated0.0% Widowed30.5% DivorcedWomen who did not give birth in the past 12 months Now married:
47.4% (75)Unmarried:
52.6% (83)
Marital status - White alone, not Hispanic / Latino population 15 years and over
Males 42.3% Never married49.6% Now married0.5% Separated2.8% Widowed4.8% DivorcedFemales 27.3% Never married53.4% Now married0.4% Separated8.8% Widowed10.2% DivorcedWomen who gave birth in the past 12 months Now married:
100.0% (15)Unmarried:
0.0% (0)
Women who did not give birth in the past 12 months Now married:
38.8% (333)Unmarried:
61.2% (525)
Marital status - Hispanic or Latino population 15 years and over
Males 46.3% Never married47.0% Now married0.0% Separated0.0% Widowed6.7% DivorcedFemales 21.4% Never married52.3% Now married8.9% Separated0.0% Widowed17.4% DivorcedWomen who gave birth in the past 12 months Now married:
100.0% (26)Unmarried:
0.0% (0)
Women who did not give birth in the past 12 months Now married:
56.5% (120)Unmarried:
43.5% (93)
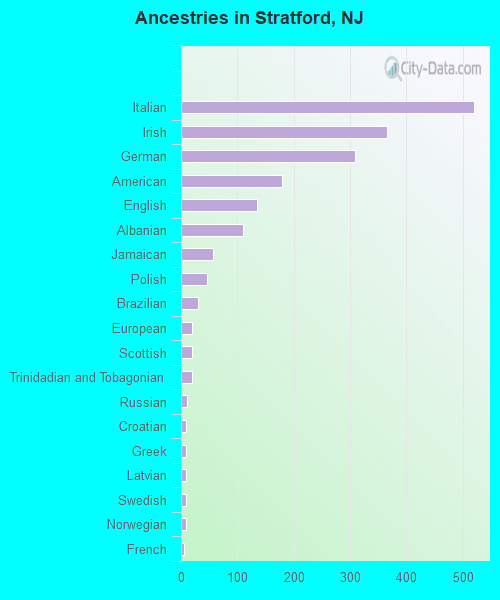
Ancestries in Stratford
521 16.6% Italian366 11.7% Irish309 9.8% German179 5.7% American135 4.3% English111 3.5% Albanian57 1.8% Jamaican47 1.5% Polish31 1.0% Brazilian19 0.6% European19 0.6% Scottish19 0.6% Trinidadian and Tobagonian10 0.3% Russian9 0.3% Croatian9 0.3% Greek9 0.3% Latvian9 0.3% Swedish8 0.3% Norwegian6 0.2% French1 0.03% Romanian
Children Nativity (place of birth) in Stratford
Children under 6 years - Living with two parents Both parents native 208 100.0% NativeBoth parents foreign-born 35 100.0% NativeOne native, one foreign-born parent 25 100.0% NativeChildren under 6 years - Living with one parent Native parent 65 100.0% NativeChildren 6 to 17 years - Living with two parents Both parents native 336 96.9% Native11 3.1% Foreign-bornBoth parents foreign-born 89 100.0% NativeOne native, one foreign-born parent 51 100.0% NativeChildren 6 to 17 years - Living with one parent Native parent 355 100.0% NativeForeign-born parent 114 60.9% Native73 39.1% Foreign-born
Grandparents responsible for own grandchildren in Stratford
Grandparents (30 to 59 years) White / Caucasian 6 55.0% Responsible for grandchildren5 45.0% Not responsible for grandchildrenWhite alone, not Hispanic / Latino 6 57.4% Responsible for grandchildren4 42.6% Not responsible for grandchildrenGrandparents (60 years and over) White / Caucasian 26 54.2% Responsible for grandchildren22 45.8% Not responsible for grandchildrenWhite alone, not Hispanic / Latino 27 51.8% Responsible for grandchildren25 48.2% Not responsible for grandchildren