Races in Sula-Edwards, Montana (MT) Detailed Stats
Ancestries, Foreign-born residents, place of birth
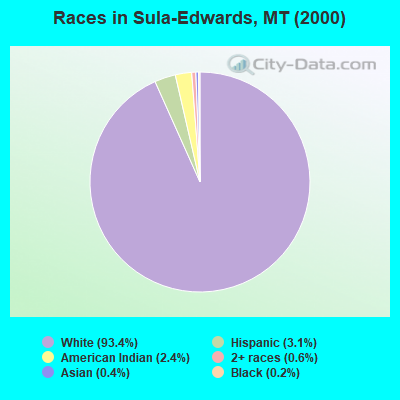
Race distribution in Sula-Edwards

- 1,31093.4%White alone
- 433.1%Hispanic
- 332.4%American Indian alone
- 90.6%Two or more races
- 50.4%Asian alone
- 30.2%Black alone
2000
2022
-
- 807,82389.5%White alone
- 54,4266.0%American Indian alone
- 18,0812.0%Hispanic
- 13,7681.5%Two or more races
- 4,5690.5%Asian alone
- 2,5340.3%Black alone
- 5690.06%Other race alone
- 4250.05%Native Hawaiian and Other
Pacific Islander alone

-
- 937,36583.5%White alone
- 58,7485.2%American Indian alone
- 55,1724.9%Two or more races
- 49,8304.4%Hispanic
- 9,0120.8%Other race alone
- 7,7000.7%Asian alone
- 3,4280.3%Black alone
- 1,6120.1%Native Hawaiian and Other
Pacific Islander alone

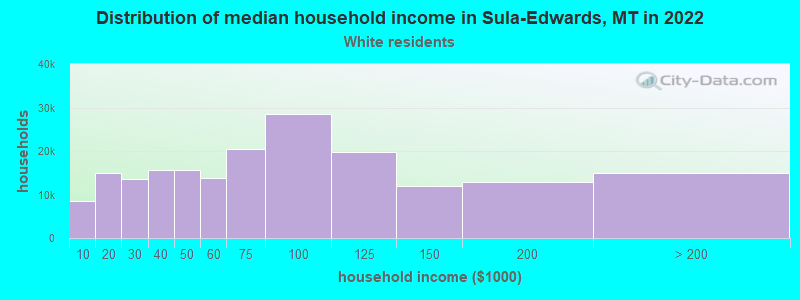
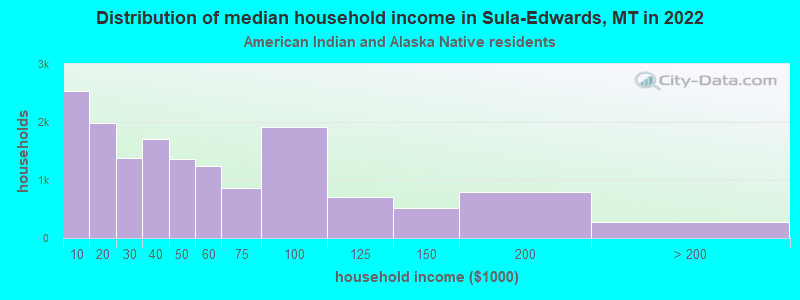
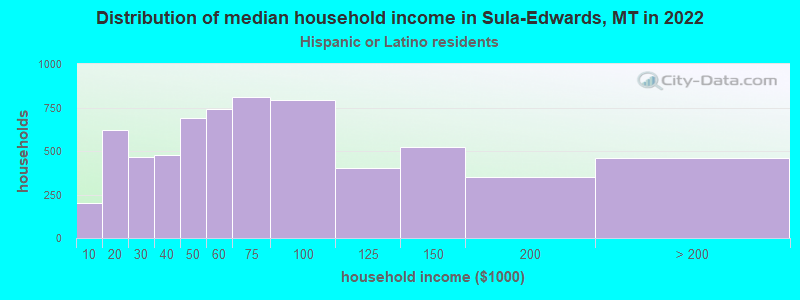
Income and house value in Sula-Edwards
- Median household income in 2022
- $64,189White non-Hispanic householders
- $60,644American Indian and Alaska Native householders
- $37,929Hispanic or Latino race householders
- Median 2022 house value
- $379,797White Non-Hispanic householders
- $378,787Hispanic or Latino householders
Household income for White non-Hispanic householders
Household income for American Indian and Alaska Native householders
Household income for Hispanic or Latino race householders
Zip code: 59829