Races in Sunderland, Vermont (VT) Detailed Stats
Ancestries, Foreign-born residents, place of birth

Recent posts about races in Sunderland, Vermont on our local forum with over 2,400,000 registered users:
 | Work in Bennington, Live in ??? (4 replies) |
| Relocation help??? (18 replies) |
Latest news about races in Sunderland, VT collected exclusively by city-data.com from local newspapers, TV, and radio stations
1.4% of Sunderland, VT residents are foreign-born , which is 183.3% less than the foreign-born rate of 4.0% across the entire state of Vermont.
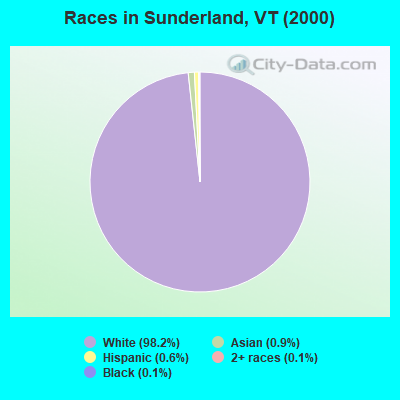
Race distribution in Sunderland

- 83598.2%White alone
- 80.9%Asian alone
- 50.6%Hispanic
- 10.1%Two or more races
- 10.1%Black alone
2000
2022
-
- 585,43196.2%White alone
- 6,8091.1%Two or more races
- 5,5040.9%Hispanic
- 5,1600.8%Asian alone
- 2,9210.5%Black alone
- 2,3250.4%American Indian alone
- 5570.09%Other race alone
- 1200.02%Native Hawaiian and Other
Pacific Islander alone

-
- 583,54690.2%White alone
- 27,3404.2%Two or more races
- 14,7702.3%Hispanic
- 11,5121.8%Asian alone
- 6,2641.0%Black alone
- 2,5210.4%Other race alone
- 1,0520.2%American Indian alone
- 590.01%Native Hawaiian and Other
Pacific Islander alone

Income and house value in Sunderland
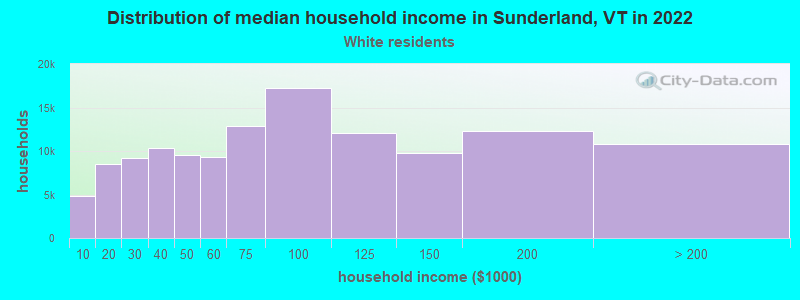
- Median household income in 2022
- $72,488White non-Hispanic householders
- Median 2022 house value
- $297,963White Non-Hispanic householders
Household income for White non-Hispanic householders
Foreign-born residents in Sunderland
12 residents are foreign born
| This city: | 1.4% |
| Vermont: | 3.8% |
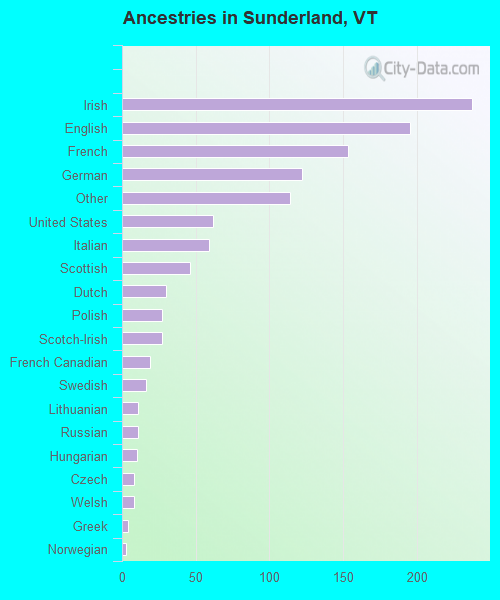
Ancestries in Sunderland

- 23720.3%Irish
- 19516.7%English
- 15313.1%French
- 12210.5%German
- 1149.8%Other
- 625.3%United States
- 595.1%Italian
- 463.9%Scottish
- 302.6%Dutch
- 272.3%Polish
- 272.3%Scotch-Irish
- 191.6%French Canadian
- 161.4%Swedish
- 110.9%Lithuanian
- 110.9%Russian
- 100.9%Hungarian
- 80.7%Czech
- 80.7%Welsh
- 40.3%Greek
- 30.3%Norwegian
- 20.2%Danish
- 20.2%Ukrainian
Zip codes: 05252.