Races in Sweet, Idaho (ID) Detailed Stats
Ancestries, Foreign-born residents, place of birth
Race distribution in Sweet

- 97893.9%White alone
- 413.9%Hispanic
- 121.2%Two or more races
- 80.8%American Indian alone
- 20.2%Other race alone
- 10.10%Asian alone
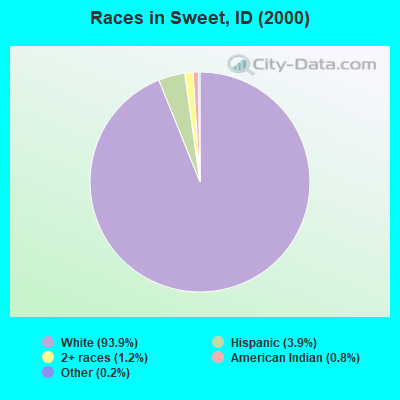
2000
2022
-
- 1,139,29188.0%White alone
- 101,6907.9%Hispanic
- 18,2611.4%Two or more races
- 15,7891.2%American Indian alone
- 11,6410.9%Asian alone
- 4,8890.4%Black alone
- 1,1920.09%Other race alone
- 1,2000.09%Native Hawaiian and Other
Pacific Islander alone

-
- 1,531,21979.0%White alone
- 261,92113.5%Hispanic
- 81,1124.2%Two or more races
- 25,1741.3%Asian alone
- 15,8250.8%American Indian alone
- 11,8680.6%Black alone
- 8,7520.5%Other race alone
- 3,1620.2%Native Hawaiian and Other
Pacific Islander alone

Income and house value in Sweet
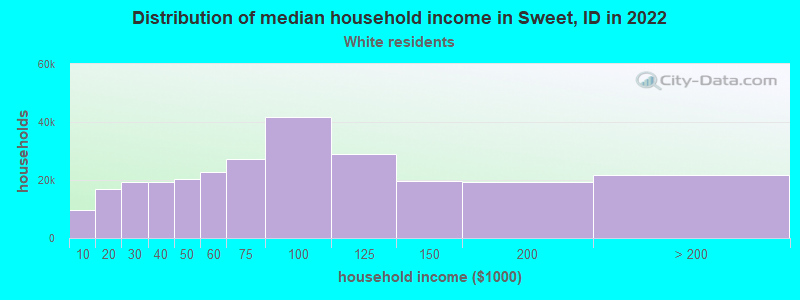
- Median household income in 2022
- $64,607White non-Hispanic householders
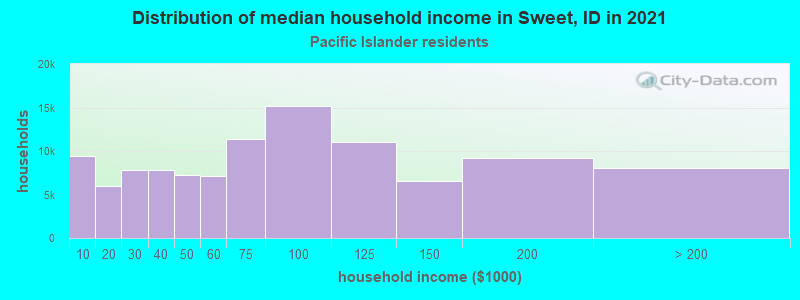
- $44,497Native Hawaiian and other Pacific Islander householders
- $57,251Some other race householders
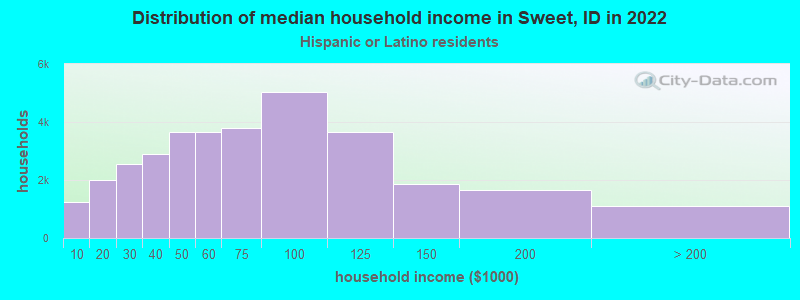
- $60,608Hispanic or Latino race householders
- Median 2022 house value
- $656,319White Non-Hispanic householders
Household income for White non-Hispanic householders
Household income for Native Hawaiian and other Pacific Islander householders
Household income for Hispanic or Latino race householders
Zip code: 83657