Races in Talpa, Texas (TX) Detailed Stats
Ancestries, Foreign-born residents, place of birth
Race distribution in Talpa

- 66590.7%White alone
- 618.3%Hispanic
- 40.5%Two or more races
- 20.3%American Indian alone
- 10.1%Black alone
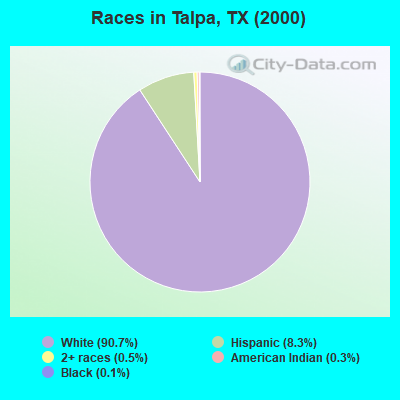
2000
2022
-
- 10,933,31352.4%White alone
- 6,669,66632.0%Hispanic
- 2,364,25511.3%Black alone
- 554,4452.7%Asian alone
- 230,5671.1%Two or more races
- 68,8590.3%American Indian alone
- 19,9580.10%Other race alone
- 10,7570.05%Native Hawaiian and Other
Pacific Islander alone

-
- 12,070,64240.2%Hispanic
- 11,683,43038.9%White alone
- 3,508,70611.7%Black alone
- 1,608,1735.4%Asian alone
- 956,5603.2%Two or more races
- 125,7630.4%Other race alone
- 47,0230.2%American Indian alone
- 29,2750.10%Native Hawaiian and Other
Pacific Islander alone

Income and house value in Talpa
- Median household income in 2022
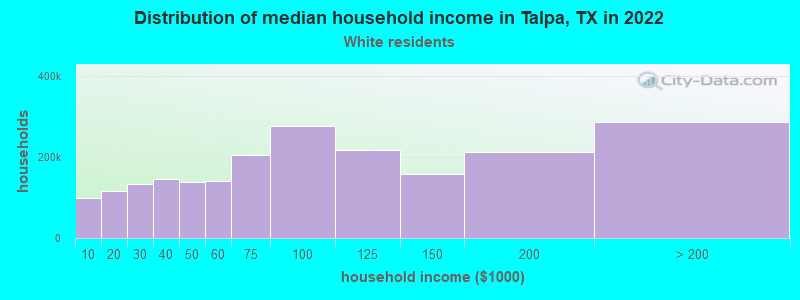
- $60,567White non-Hispanic householders
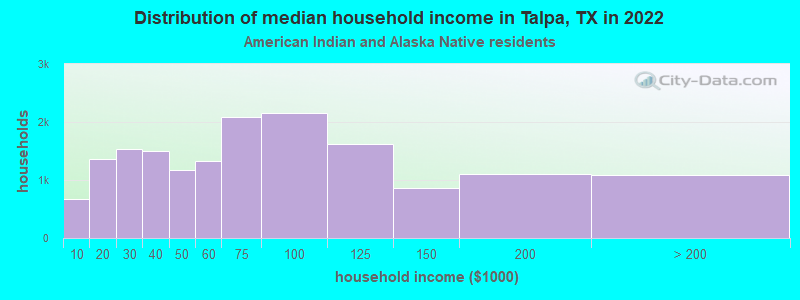
- $27,898American Indian and Alaska Native householders
- $73,997Some other race householders
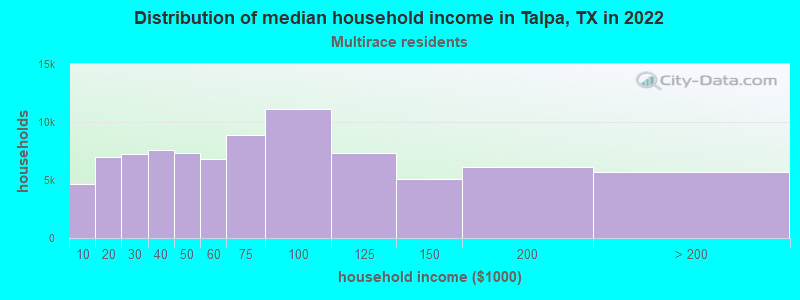
- $5,135Two or more races householders
- $36,144Hispanic or Latino race householders
- Median 2022 house value
- $82,018White Non-Hispanic householders
- $28,475Some other race householders
- $28,478Hispanic or Latino householders
Household income for White non-Hispanic householders
Household income for American Indian and Alaska Native householders
Household income for Two or more races householders
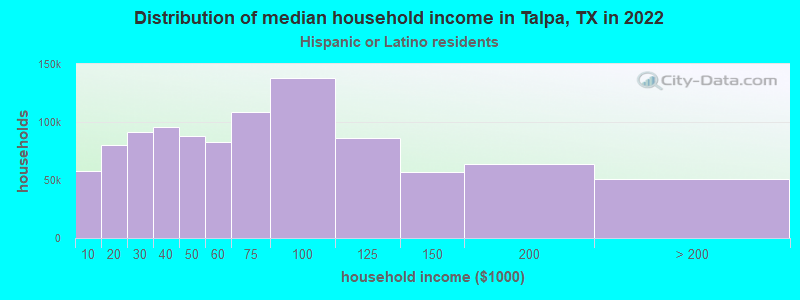
Household income for Hispanic or Latino race householders
Zip code: 76888