Races in Tamalpais-Homestead Valley, California (CA) Detailed Stats
Data:
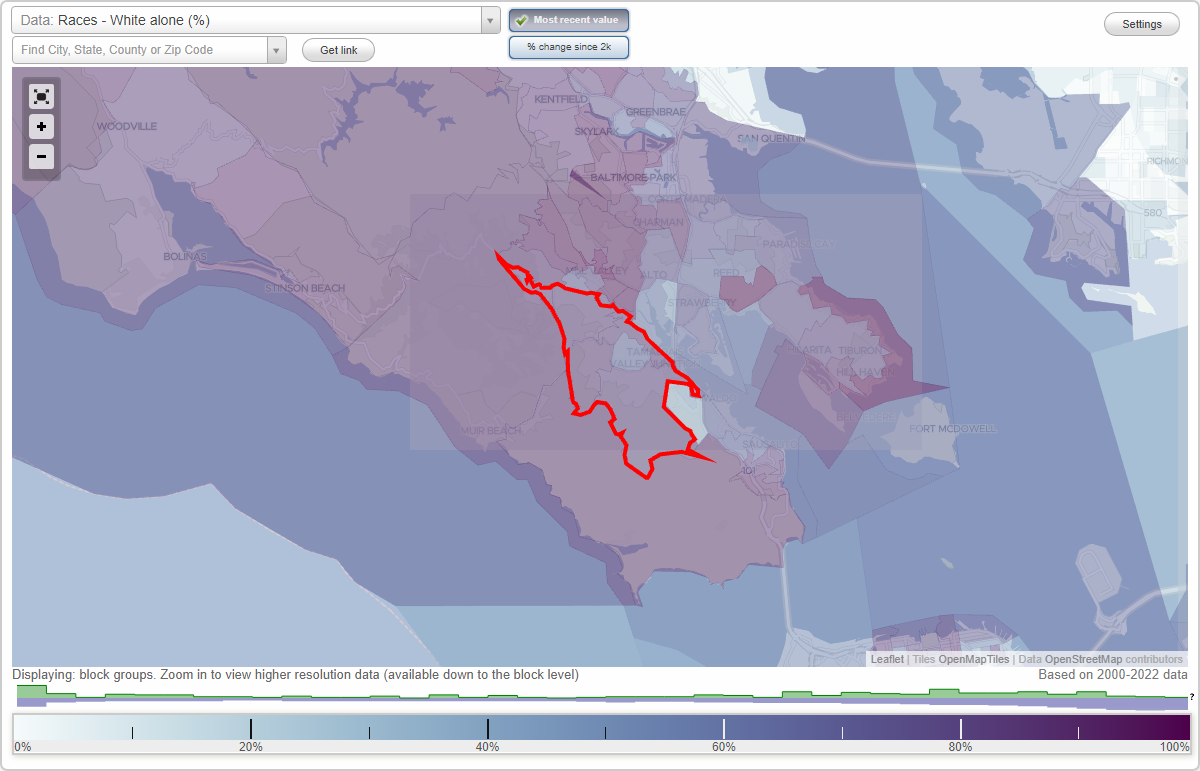
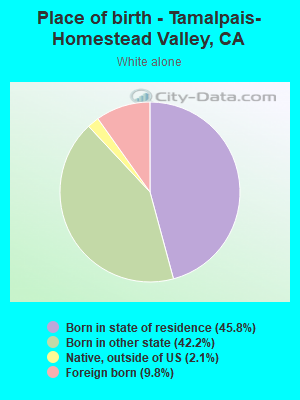
Races - White alone (%)
Races - White alone (% change since 2000)
Races - Black alone (%)
Races - Black alone (% change since 2000)
Races - American Indian alone (%)
Races - American Indian alone (% change since 2000)
Races - Asian alone (%)
Races - Asian alone (% change since 2000)
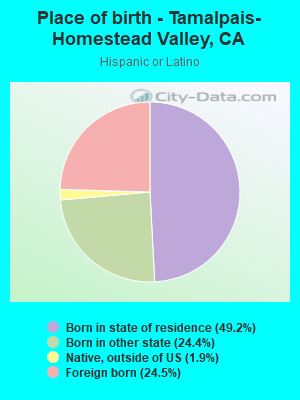
Races - Hispanic (%)
Races - Hispanic (% change since 2000)
Races - Native Hawaiian and Other Pacific Islander alone (%)
Races - Native Hawaiian and Other Pacific Islander alone (% change since 2000)
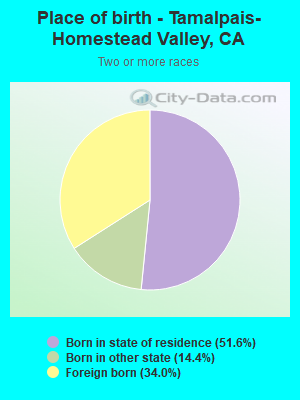
Races - Two or more races(%)
Races - Two or more races(% change since 2000)
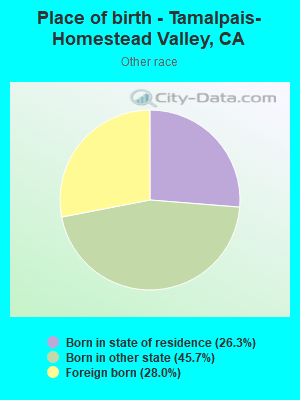
Races - Other race alone (%)
Races - Other race alone (% change since 2000)
Racial diversity
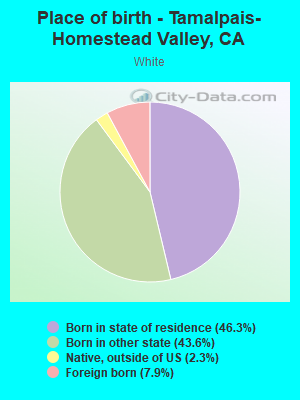
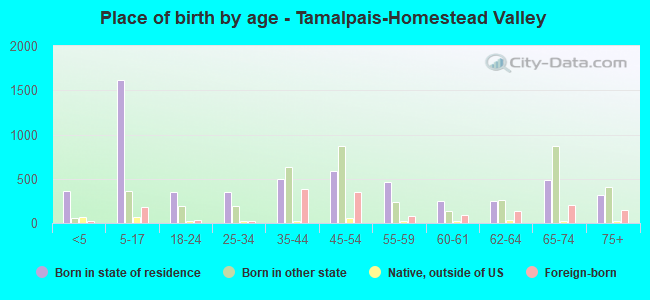
Place of birth - Born in state of residence (%)
Place of birth - Born in state of residence (%) - White
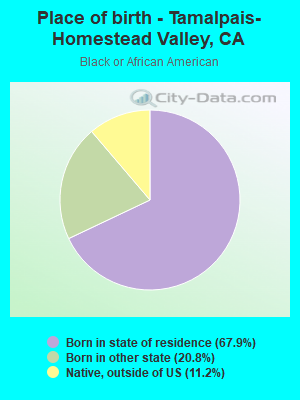
Place of birth - Born in state of residence (%) - Black or African American
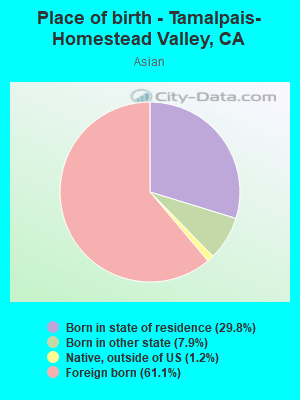
Place of birth - Born in state of residence (%) - Asian
Place of birth - Born in state of residence (%) - Hispanic or Latino
Place of birth - Born in state of residence (%) - American Indian and Alaska Native
Place of birth - Born in state of residence (%) - Multirace
Place of birth - Born in state of residence (%) - Other Race
Place of birth - Born in other state (%)
Place of birth - Born in other state (%) - White
Place of birth - Born in other state (%) - Black or African American
Place of birth - Born in other state (%) - Asian
Place of birth - Born in other state (%) - Hispanic or Latino
Place of birth - Born in other state (%) - American Indian and Alaska Native
Place of birth - Born in other state (%) - Multirace
Place of birth - Born in other state (%) - Other Race
Place of birth - Native, outside of US (%)
Place of birth - Native, outside of US (%) - White
Place of birth - Native, outside of US (%) - Black or African American
Place of birth - Native, outside of US (%) - Asian
Place of birth - Native, outside of US (%) - Hispanic or Latino
Place of birth - Native, outside of US (%) - American Indian and Alaska Native
Place of birth - Native, outside of US (%) - Multirace
Place of birth - Native, outside of US (%) - Other Race
Place of birth - Foreign born (%)
Place of birth - Foreign born (%) - White
Place of birth - Foreign born (%) - Black or African American
Place of birth - Foreign born (%) - Asian
Place of birth - Foreign born (%) - Hispanic or Latino
Place of birth - Foreign born (%) - American Indian and Alaska Native
Place of birth - Foreign born (%) - Multirace
Place of birth - Foreign born (%) - Other Race
Residents speaking English at home (%)
Residents speaking English at home - Born in the United States (%)
Residents speaking English at home - Native, born elsewhere (%)
Residents speaking English at home - Foreign born (%)
Residents speaking Spanish at home (%)
Residents speaking Spanish at home - Born in the United States (%)
Residents speaking Spanish at home - Native, born elsewhere (%)
Residents speaking Spanish at home - Foreign born (%)
Residents speaking other language at home (%)
Residents speaking other language at home - Born in the United States (%)
Residents speaking other language at home - Native, born elsewhere (%)
Residents speaking other language at home - Foreign born (%)
Marital status - Never married (%)
Marital status - Now married (%)
Marital status - Separated (%)
Marital status - Widowed (%)
Marital status - Divorced (%)
Ancestries Reported - Arab (%)
Ancestries Reported - Czech (%)
Ancestries Reported - Danish (%)
Ancestries Reported - Dutch (%)
Ancestries Reported - English (%)
Ancestries Reported - French (%)
Ancestries Reported - French Canadian (%)
Ancestries Reported - German (%)
Ancestries Reported - Greek (%)
Ancestries Reported - Hungarian (%)
Ancestries Reported - Irish (%)
Ancestries Reported - Italian (%)
Ancestries Reported - Lithuanian (%)
Ancestries Reported - Norwegian (%)
Ancestries Reported - Polish (%)
Ancestries Reported - Portuguese (%)
Ancestries Reported - Russian (%)
Ancestries Reported - Scotch-Irish (%)
Ancestries Reported - Scottish (%)
Ancestries Reported - Slovak (%)
Ancestries Reported - Subsaharan African (%)
Ancestries Reported - Swedish (%)
Ancestries Reported - Swiss (%)
Ancestries Reported - Ukrainian (%)
Ancestries Reported - United States (%)
Ancestries Reported - Welsh (%)
Ancestries Reported - West Indian (%)
Ancestries Reported - Other (%)
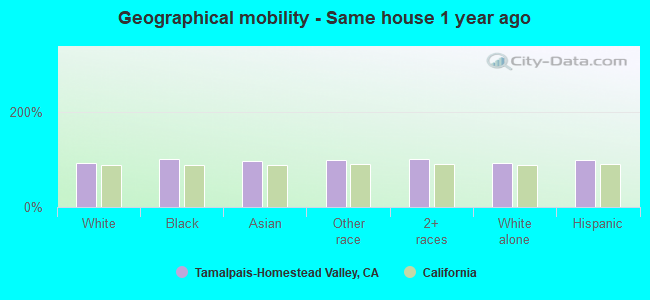
Geographical mobility - Same house 1 year ago (%)
Geographical mobility - Same house 1 year ago (%) - White
Geographical mobility - Same house 1 year ago (%) - Black or African American
Geographical mobility - Same house 1 year ago (%) - Asian
Geographical mobility - Same house 1 year ago (%) - Hispanic or Latino
Geographical mobility - Same house 1 year ago (%) - American Indian and Alaska Native
Geographical mobility - Same house 1 year ago (%) - Multirace
Geographical mobility - Same house 1 year ago (%) - Other Race
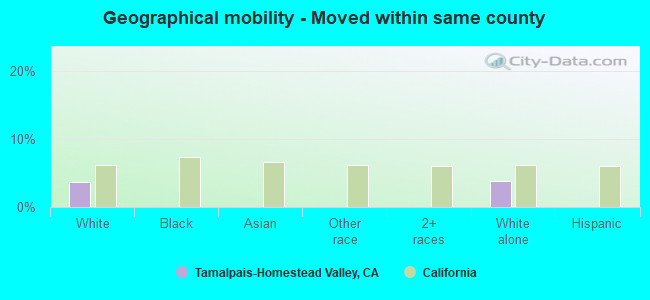
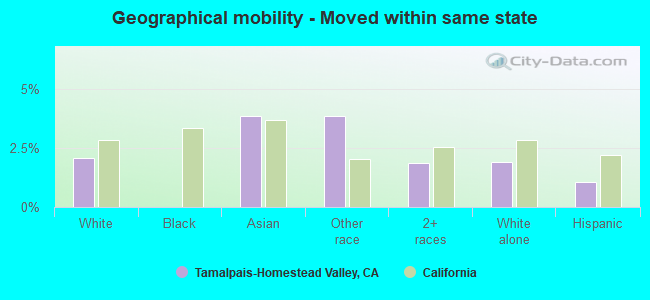
Geographical mobility - Moved within same county (%)
Geographical mobility - Moved within same county (%) - White
Geographical mobility - Moved within same county (%) - Black or African American
Geographical mobility - Moved within same county (%) - Asian
Geographical mobility - Moved within same county (%) - Hispanic or Latino
Geographical mobility - Moved within same county (%) - American Indian and Alaska Native
Geographical mobility - Moved within same county (%) - Multirace
Geographical mobility - Moved within same county (%) - Other Race
Geographical mobility - Moved from different county within same state (%)
Geographical mobility - Moved from different county within same state (%) - White
Geographical mobility - Moved from different county within same state (%) - Black or African American
Geographical mobility - Moved from different county within same state (%) - Asian
Geographical mobility - Moved from different county within same state (%) - Hispanic or Latino
Geographical mobility - Moved from different county within same state (%) - American Indian and Alaska Native
Geographical mobility - Moved from different county within same state (%) - Multirace
Geographical mobility - Moved from different county within same state (%) - Other Race
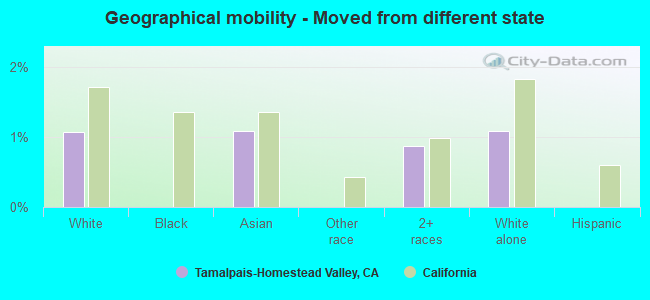
Geographical mobility - Moved from different state (%)
Geographical mobility - Moved from different state (%) - White
Geographical mobility - Moved from different state (%) - Black or African American
Geographical mobility - Moved from different state (%) - Asian
Geographical mobility - Moved from different state (%) - Hispanic or Latino
Geographical mobility - Moved from different state (%) - American Indian and Alaska Native
Geographical mobility - Moved from different state (%) - Multirace
Geographical mobility - Moved from different state (%) - Other Race
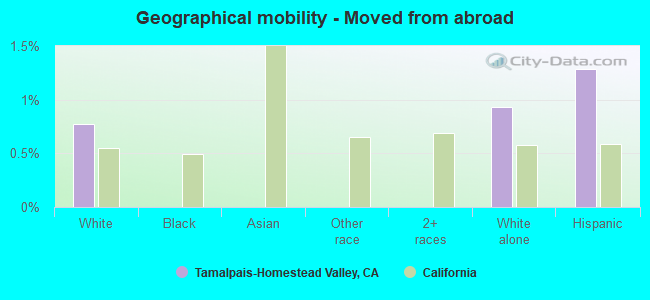
Geographical mobility - Moved from abroad (%)
Geographical mobility - Moved from abroad (%) - White
Geographical mobility - Moved from abroad (%) - Black or African American
Geographical mobility - Moved from abroad (%) - Asian
Geographical mobility - Moved from abroad (%) - Hispanic or Latino
Geographical mobility - Moved from abroad (%) - American Indian and Alaska Native
Geographical mobility - Moved from abroad (%) - Multirace
Geographical mobility - Moved from abroad (%) - Other Race
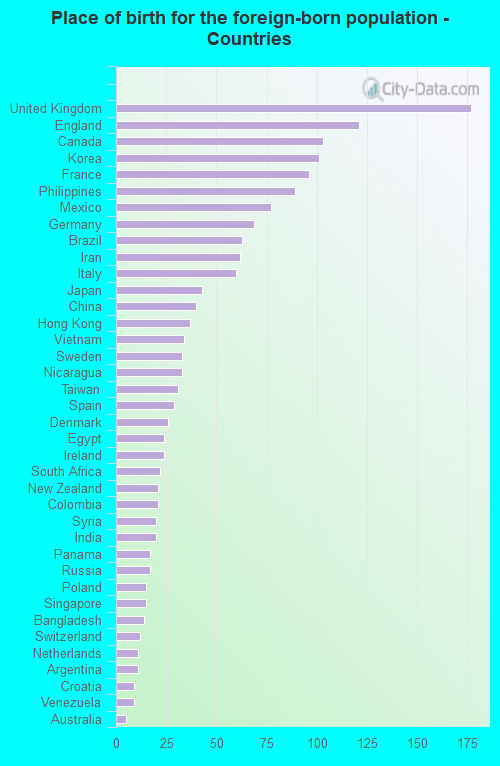
Place of birth for the foreign-born population - Ireland (%)
Place of birth for the foreign-born population - Denmark (%)
Place of birth for the foreign-born population - Norway (%)
Place of birth for the foreign-born population - Sweden (%)
Place of birth for the foreign-born population - United Kingdom (%)
Place of birth for the foreign-born population - England (%)
Place of birth for the foreign-born population - Scotland (%)
Place of birth for the foreign-born population - Other Northern Europe (%)
Place of birth for the foreign-born population - Austria (%)
Place of birth for the foreign-born population - Belgium (%)
Place of birth for the foreign-born population - France (%)
Place of birth for the foreign-born population - Germany (%)
Place of birth for the foreign-born population - Netherlands (%)
Place of birth for the foreign-born population - Switzerland (%)
Place of birth for the foreign-born population - Other Western Europe (%)
Place of birth for the foreign-born population - Greece (%)
Place of birth for the foreign-born population - Italy (%)
Place of birth for the foreign-born population - Portugal (%)
Place of birth for the foreign-born population - Spain (%)
Place of birth for the foreign-born population - Other Southern Europe (%)
Place of birth for the foreign-born population - Albania (%)
Place of birth for the foreign-born population - Belarus (%)
Place of birth for the foreign-born population - Bosnia and Herzegovina (%)
Place of birth for the foreign-born population - Bulgaria (%)
Place of birth for the foreign-born population - Croatia (%)
Place of birth for the foreign-born population - Czechoslovakia (%)
Place of birth for the foreign-born population - Hungary (%)
Place of birth for the foreign-born population - Latvia (%)
Place of birth for the foreign-born population - Lithuania (%)
Place of birth for the foreign-born population - North Macedonia (Macedonia) (%)
Place of birth for the foreign-born population - Moldova (%)
Place of birth for the foreign-born population - Poland (%)
Place of birth for the foreign-born population - Romania (%)
Place of birth for the foreign-born population - Russia (%)
Place of birth for the foreign-born population - Serbia (%)
Place of birth for the foreign-born population - Ukraine (%)
Place of birth for the foreign-born population - Other Eastern Europe (%)
Place of birth for the foreign-born population - China (%)
Place of birth for the foreign-born population - Hong Kong (%)
Place of birth for the foreign-born population - Taiwan (%)
Place of birth for the foreign-born population - Japan (%)
Place of birth for the foreign-born population - Korea (%)
Place of birth for the foreign-born population - Other Eastern Asia (%)
Place of birth for the foreign-born population - Afghanistan (%)
Place of birth for the foreign-born population - Bangladesh (%)
Place of birth for the foreign-born population - India (%)
Place of birth for the foreign-born population - Iran (%)
Place of birth for the foreign-born population - Kazakhstan (%)
Place of birth for the foreign-born population - Nepal (%)
Place of birth for the foreign-born population - Pakistan (%)
Place of birth for the foreign-born population - Sri Lanka (%)
Place of birth for the foreign-born population - Uzbekistan (%)
Place of birth for the foreign-born population - Other South Central Asia (%)
Place of birth for the foreign-born population - Burma (%)
Place of birth for the foreign-born population - Cambodia (%)
Place of birth for the foreign-born population - Indonesia (%)
Place of birth for the foreign-born population - Laos (%)
Place of birth for the foreign-born population - Malaysia (%)
Place of birth for the foreign-born population - Philippines (%)
Place of birth for the foreign-born population - Singapore (%)
Place of birth for the foreign-born population - Thailand (%)
Place of birth for the foreign-born population - Vietnam (%)
Place of birth for the foreign-born population - Other South Eastern Asia (%)
Place of birth for the foreign-born population - Armenia (%)
Place of birth for the foreign-born population - Iraq (%)
Place of birth for the foreign-born population - Israel (%)
Place of birth for the foreign-born population - Jordan (%)
Place of birth for the foreign-born population - Kuwait (%)
Place of birth for the foreign-born population - Lebanon (%)
Place of birth for the foreign-born population - Saudi Arabia (%)
Place of birth for the foreign-born population - Syria (%)
Place of birth for the foreign-born population - Turkey (%)
Place of birth for the foreign-born population - Yemen (%)
Place of birth for the foreign-born population - Other Western Asia (%)
Place of birth for the foreign-born population - Eritrea (%)
Place of birth for the foreign-born population - Ethiopia (%)
Place of birth for the foreign-born population - Kenya (%)
Place of birth for the foreign-born population - Somalia (%)
Place of birth for the foreign-born population - Uganda (%)
Place of birth for the foreign-born population - Zimbabwe (%)
Place of birth for the foreign-born population - Other Eastern Africa (%)
Place of birth for the foreign-born population - Cameroon (%)
Place of birth for the foreign-born population - Congo (%)
Place of birth for the foreign-born population - Democratic Republic of Congo (Zaire) (%)
Place of birth for the foreign-born population - Other Middle Africa (%)
Place of birth for the foreign-born population - Egypt (%)
Place of birth for the foreign-born population - Morocco (%)
Place of birth for the foreign-born population - Sudan (%)
Place of birth for the foreign-born population - Other Northern Africa (%)
Place of birth for the foreign-born population - South Africa (%)
Place of birth for the foreign-born population - Other Southern Africa (%)
Place of birth for the foreign-born population - Cabo Verde (%)
Place of birth for the foreign-born population - Ghana (%)
Place of birth for the foreign-born population - Liberia (%)
Place of birth for the foreign-born population - Nigeria (%)
Place of birth for the foreign-born population - Senegal (%)
Place of birth for the foreign-born population - Sierra Leone (%)
Place of birth for the foreign-born population - Other Western Africa (%)
Place of birth for the foreign-born population - Australia (%)
Place of birth for the foreign-born population - New Zealand (%)
Place of birth for the foreign-born population - Fiji (%)
Place of birth for the foreign-born population - Micronesia (%)
Place of birth for the foreign-born population - Bahamas (%)
Place of birth for the foreign-born population - Barbados (%)
Place of birth for the foreign-born population - Cuba (%)
Place of birth for the foreign-born population - Dominica (%)
Place of birth for the foreign-born population - Dominican Republic (%)
Place of birth for the foreign-born population - Grenada (%)
Place of birth for the foreign-born population - Haiti (%)
Place of birth for the foreign-born population - Jamaica (%)
Place of birth for the foreign-born population - St. Vincent and the Grenadines (%)
Place of birth for the foreign-born population - Trinidad and Tobago (%)
Place of birth for the foreign-born population - West Indies (%)
Place of birth for the foreign-born population - Other Caribbean (%)
Place of birth for the foreign-born population - Belize (%)
Place of birth for the foreign-born population - Costa Rica (%)
Place of birth for the foreign-born population - El Salvador (%)
Place of birth for the foreign-born population - Guatemala (%)
Place of birth for the foreign-born population - Honduras (%)
Place of birth for the foreign-born population - Mexico (%)
Place of birth for the foreign-born population - Nicaragua (%)
Place of birth for the foreign-born population - Panama (%)
Place of birth for the foreign-born population - Other Central America (%)
Place of birth for the foreign-born population - Argentina (%)
Place of birth for the foreign-born population - Bolivia (%)
Place of birth for the foreign-born population - Brazil (%)
Place of birth for the foreign-born population - Chile (%)
Place of birth for the foreign-born population - Colombia (%)
Place of birth for the foreign-born population - Ecuador (%)
Place of birth for the foreign-born population - Guyana (%)
Place of birth for the foreign-born population - Peru (%)
Place of birth for the foreign-born population - Uruguay (%)
Place of birth for the foreign-born population - Venezuela (%)
Place of birth for the foreign-born population - Other South America (%)
Place of birth for the foreign-born population - Canada (%)
Place of birth for the foreign-born population - Other Northern America (%)
Place of birth for the foreign-born population - Other (%)
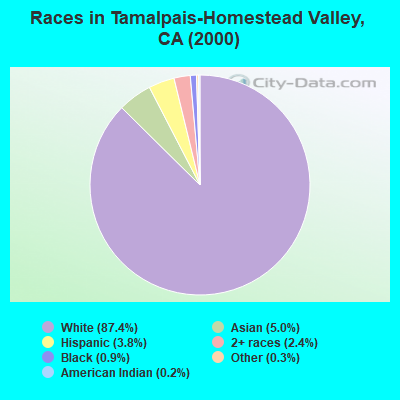
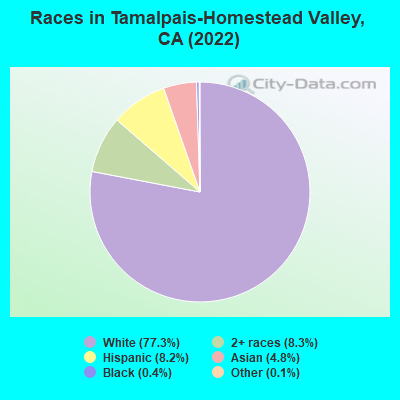
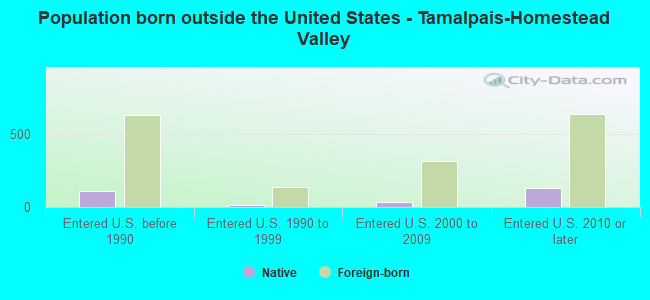
According to 2022 data, the most numerous races in Tamalpais-Homestead Valley, CA are Hispanic (676 residents), White alone (8,962 residents), and Asian alone (735 residents). 86.5% of Tamalpais-Homestead Valley residents speak English at home. 13.9% of Tamalpais-Homestead Valley, CA residents are foreign-born (5.9% born in Europe, 4.3% born in Asia, 2.0% born in Latin America), which is 86.7% less than the foreign-born rate of 26.0% across the entire state of California.
Race distribution in Tamalpais-Homestead Valley
2000 2022
15,816,790 46.7% White alone 10,966,556 32.4% Hispanic 3,648,860 10.8% Asian alone 2,181,926 6.4% Black alone 903,115 2.7% Two or more races 178,984 0.5% American Indian alone 103,736 0.3% Native Hawaiian and Other 71,681 0.2% Other race alone
15,732,184 40.3% Hispanic 13,160,426 33.7% White alone 5,957,867 15.3% Asian alone 2,025,218 5.2% Black alone 1,663,222 4.3% Two or more races 251,618 0.6% Other race alone 135,777 0.3% Native Hawaiian and Other 103,030 0.3% American Indian alone
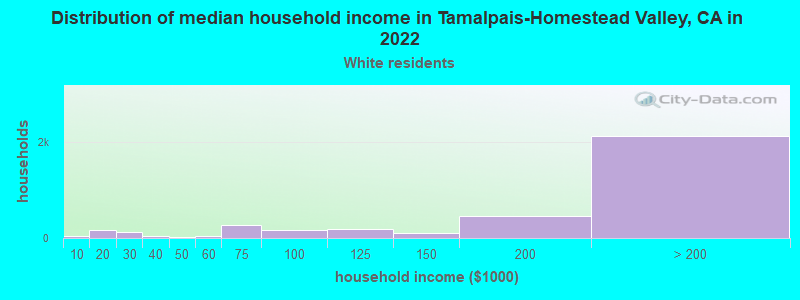
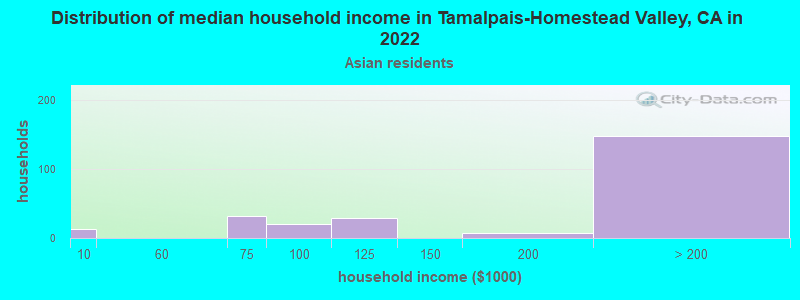
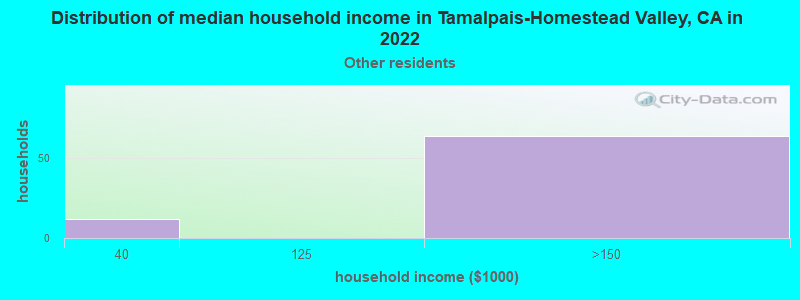
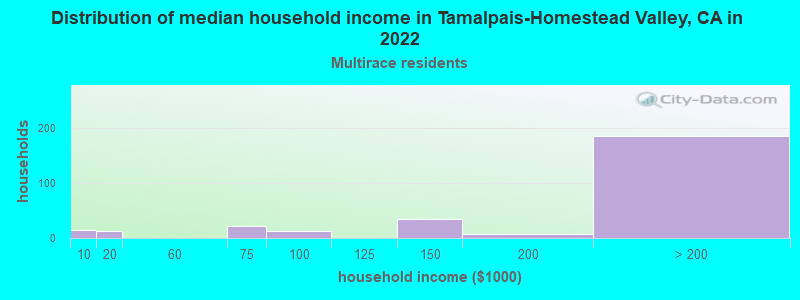
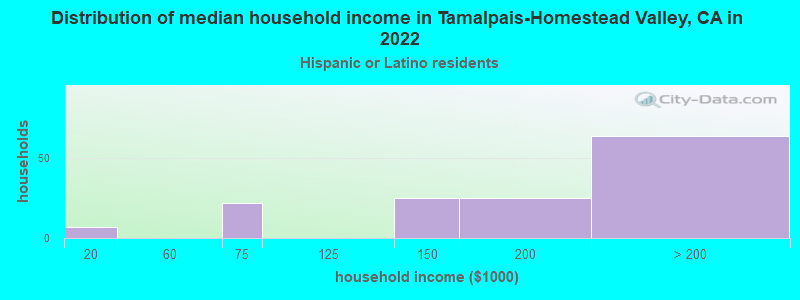
Income and house value in Tamalpais-Homestead Valley Median household income in 2022 $193,917 White non-Hispanic householdersover $200,000 Black householders$23,216 American Indian and Alaska Native householders$150,451 Asian householders$61,018 Native Hawaiian and other Pacific Islander householders$184,010 Some other race householdersover $200,000 Two or more races householders$167,672 Hispanic or Latino race householdersMedian 2022 house value over $1,000,000 White Non-Hispanic householdersover $1,000,000 Black or African American householders over $1,000,000 Asian householdersover $1,000,000 Some other race householdersover $1,000,000 Two or more races householdersover $1,000,000 Hispanic or Latino householders
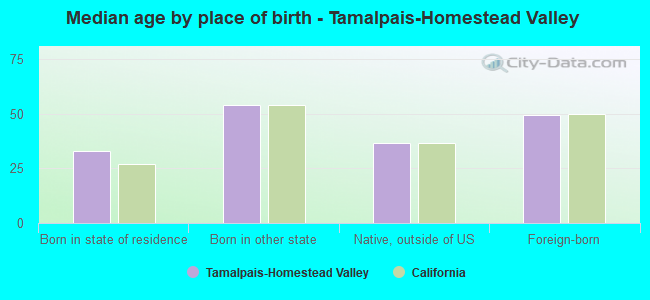
Median age by race in Tamalpais-Homestead Valley
49.5 Median age for White residents49.9 49.4 31.7 Median age for Black or African American residents32.4 12.4 56.7 Median age for Asian residents65.5 56.5 58.8 Median age for Other race residents28.0 Median age for Two or more races residents78.1 15.3 48.7 Median age for White alone residents48.1 48.9 40.3 Median age for Hispanic or Latino residents19.3 42.3
Owner/renter occupied households by race in Tamalpais-Homestead Valley
House owners and renters - White residents 2,727 76.6% Owner occupied833 23.4% Renter occupiedHouse owners and renters - Black or African American residents 23 67.0% Owner occupied11 33.0% Renter occupiedHouse owners and renters - Asian residents 271 78.3% Owner occupied75 21.7% Renter occupiedHouse owners and renters - Other race residents 59 100.0% Owner occupiedHouse owners and renters - Two or more races residents 368 84.9% Owner occupied65 15.1% Renter occupiedHouse owners and renters - White alone residents 2,861 74.7% Owner occupied971 25.3% Renter occupiedHouse owners and renters - Hispanic or Latino residents 125 86.0% Owner occupied20 14.0% Renter occupied
Language usage in Tamalpais-Homestead Valley
English speakers - Total 86.5% of residents of Tamalpais-Homestead Valley speak English at home.
3.7% of residents speak Spanish at home 371 88.1% Speak English very well50 11.9% Speak English less than very well10.4% of residents speak other language at home 934 79.6% Speak English very well240 20.4% Speak English less than very well
English speakers - Born in the United States 95.4% of residents of Tamalpais-Homestead Valley speak English at home.
3.3% of residents speak Spanish at home 128 89.5% Speak English very well15 10.5% Speak English less than very well1.0% of residents speak other language at home 44 100.0% Speak English very well
English speakers - Native, born elsewhere 74.5% of residents of Tamalpais-Homestead Valley speak English at home.
13.5% of residents speak Spanish at home 27 100.0% Speak English very well12.0% of residents speak other language at home 24 100.0% Speak English very well
English speakers - Foreign-born 52.1% of residents of Tamalpais-Homestead Valley speak English at home.
8.4% of residents speak Spanish at home 123 92.5% Speak English very well10 7.5% Speak English less than very well45.5% of residents speak other language at home 507 70.6% Speak English very well211 29.4% Speak English less than very well
White (Caucasian) - Speak only English Native:
100.0% (7,435)Foreign-born:
67.9% (452)
White (Caucasian) - Speak another language Native:
4.1% (302)Foreign-born:
47.4% (315)
Asian - Speak only English Native:
74.8% (234)Foreign-born:
35.5% (163)
Asian - Speak another language Native:
24.5% (77)Foreign-born:
66.4% (306)
Other race - Speak only English Native:
33.8% (47)Foreign-born:
48.2% (25)
Other race - Speak another language Native:
66.5% (93)Foreign-born:
65.5% (34)
Two or more races - Speak only English Native:
63.5% (709)Foreign-born:
49.6% (306)
Two or more races - Speak another language Native:
37.5% (419)Foreign-born:
15.4% (95)
White alone - Speak only English Native:
95.6% (7,536)Foreign-born:
59.0% (480)
White alone - Speak another language Native:
4.0% (319)Foreign-born:
41.2% (336)
Hispanic or Latino - Speak only English Native:
75.5% (365)Foreign-born:
36.1% (62)
Hispanic or Latino - Speak another language Native:
30.6% (148)Foreign-born:
77.8% (134)
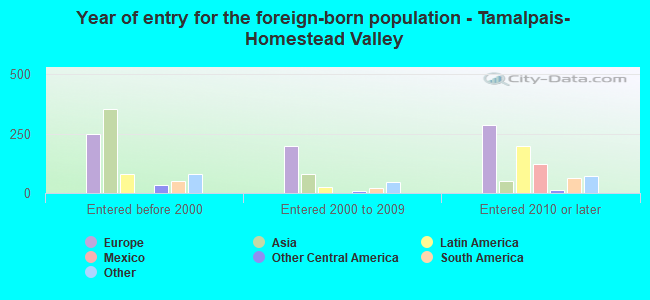
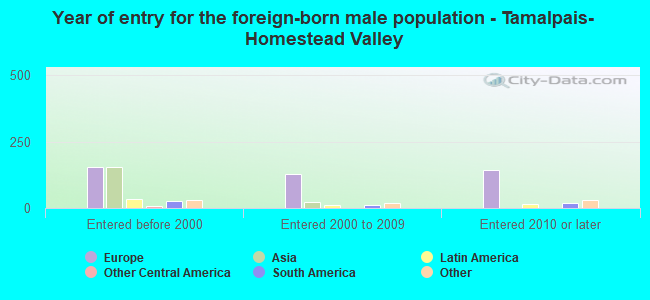
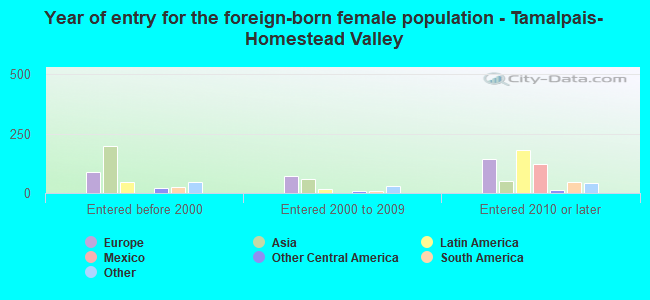
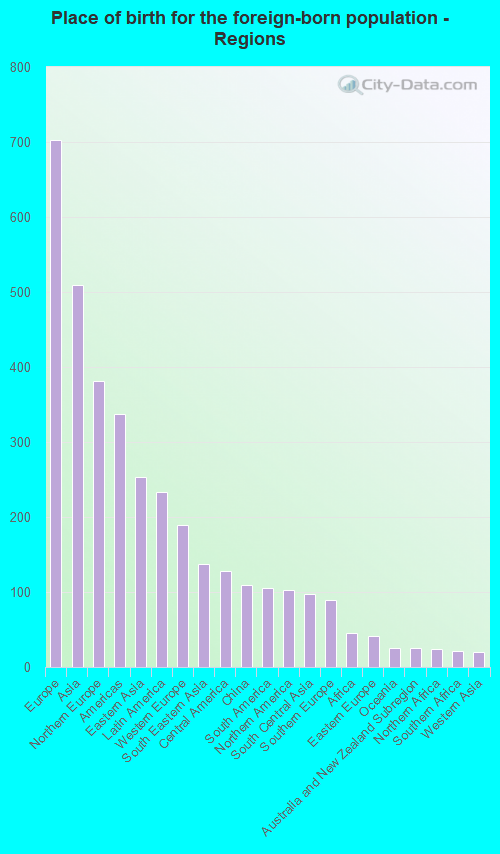
Foreign-born residents in Tamalpais-Homestead Valley 1,624 residents are foreign born (5.9% Europe , 4.3% Asia , 2.0% Latin America ).
This city:
13.9%California:
100.0%
Marital status for residents in Tamalpais-Homestead Valley Marital status - White (Caucasian) population 15 years and over
Males 26.0% Never married58.3% Now married0.8% Separated2.4% Widowed12.5% DivorcedFemales 25.9% Never married52.4% Now married1.3% Separated4.0% Widowed16.4% DivorcedWomen who gave birth in the past 12 months Now married:
100.0% (47)Unmarried:
0.0% (0)
Women who did not give birth in the past 12 months Now married:
48.6% (775)Unmarried:
51.4% (819)
Marital status - Black or African American population 15 years and over
Males 25.9% Never married74.1% Now married0.0% Separated0.0% Widowed0.0% DivorcedFemales 29.4% Never married23.5% Now married0.0% Separated0.0% Widowed47.1% DivorcedWomen who did not give birth in the past 12 months Now married:
0.0% (0)Unmarried:
100.0% (14)
Marital status - Asian population 15 years and over
Males 5.4% Never married75.1% Now married0.0% Separated10.4% Widowed9.1% DivorcedFemales 9.1% Never married56.7% Now married0.0% Separated11.8% Widowed22.4% DivorcedWomen who did not give birth in the past 12 months Now married:
72.9% (120)Unmarried:
27.1% (45)
Marital status - Other race population 15 years and over
Males 19.5% Never married80.5% Now married0.0% Separated0.0% Widowed0.0% DivorcedFemales 16.0% Never married69.1% Now married0.0% Separated14.9% Widowed0.0% DivorcedWomen who did not give birth in the past 12 months Now married:
80.5% (34)Unmarried:
19.5% (8)
Marital status - Two or more races population 15 years and over
Males 23.9% Never married76.1% Now married0.0% Separated0.0% Widowed0.0% DivorcedFemales 49.8% Never married32.4% Now married0.0% Separated7.2% Widowed10.6% DivorcedWomen who did not give birth in the past 12 months Now married:
13.4% (42)Unmarried:
86.6% (273)
Marital status - White alone, not Hispanic / Latino population 15 years and over
Males 25.2% Never married58.7% Now married0.8% Separated2.5% Widowed12.8% DivorcedFemales 24.1% Never married52.9% Now married1.4% Separated4.2% Widowed17.3% DivorcedWomen who gave birth in the past 12 months Now married:
100.0% (55)Unmarried:
0.0% (0)
Women who did not give birth in the past 12 months Now married:
49.6% (815)Unmarried:
50.4% (827)
Marital status - Hispanic or Latino population 15 years and over
Males 46.5% Never married53.5% Now married0.0% Separated0.0% Widowed0.0% DivorcedFemales 42.1% Never married51.2% Now married0.0% Separated3.6% Widowed3.1% DivorcedWomen who did not give birth in the past 12 months Now married:
46.6% (141)Unmarried:
53.4% (162)
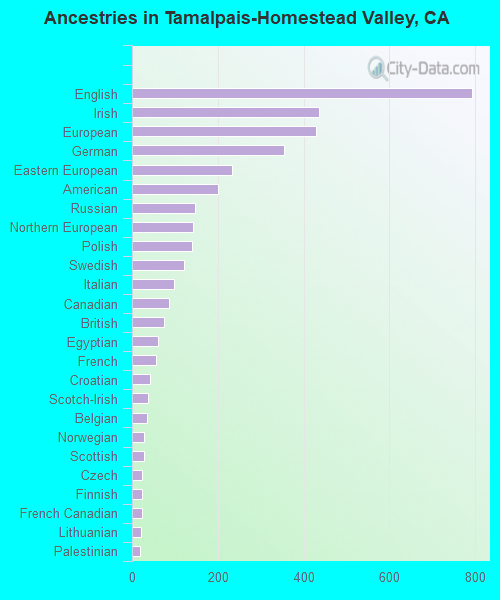
Ancestries in Tamalpais-Homestead Valley
1,018 20.4% European657 13.1% English353 7.1% Irish264 5.3% American255 5.1% Eastern European172 3.4% Italian141 2.8% German112 2.2% French107 2.1% Russian99 2.0% British99 2.0% Polish88 1.8% Northern European82 1.6% Iranian45 0.9% French Canadian42 0.8% Scotch-Irish41 0.8% Croatian40 0.8% Scottish36 0.7% Norwegian35 0.7% Canadian31 0.6% Swedish23 0.5% Syrian22 0.4% Dutch21 0.4% Egyptian21 0.4% Brazilian20 0.4% Celtic19 0.4% Danish17 0.3% Palestinian14 0.3% Portuguese13 0.3% Czech13 0.3% Welsh12 0.2% Swiss8 0.2% Austrian7 0.1% Romanian6 0.1% Finnish5 0.10% Slovak
Children Nativity (place of birth) in Tamalpais-Homestead Valley
Children under 6 years - Living with two parents Both parents native 344 100.0% NativeBoth parents foreign-born 8 38.3% Native13 61.7% Foreign-bornOne native, one foreign-born parent 130 100.0% NativeChildren under 6 years - Living with one parent Native parent 43 100.0% NativeForeign-born parent 19 100.0% NativeChildren 6 to 17 years - Living with two parents Both parents native 954 98.1% Native18 1.9% Foreign-bornBoth parents foreign-born 131 51.2% Native125 48.8% Foreign-bornOne native, one foreign-born parent 204 88.7% Native26 11.3% Foreign-bornChildren 6 to 17 years - Living with one parent Native parent 616 100.0% Native
Grandparents responsible for own grandchildren in Tamalpais-Homestead Valley
Grandparents (30 to 59 years) Other race 7 100.0% Not responsible for grandchildrenHispanic or Latino 6 100.0% Not responsible for grandchildren
Grandparents (60 years and over)