Races in Thompson, Utah (UT) Detailed Stats
Ancestries, Foreign-born residents, place of birth
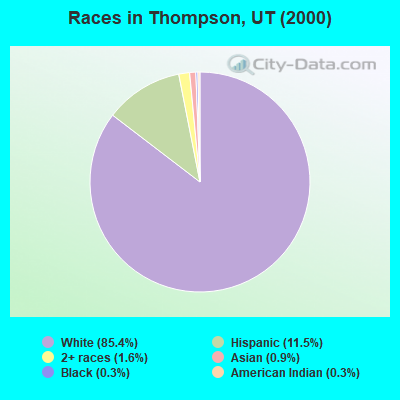
Race distribution in Thompson

- 27485.4%White alone
- 3711.5%Hispanic
- 51.6%Two or more races
- 30.9%Asian alone
- 10.3%Black alone
- 10.3%American Indian alone
2000
2022
-
- 1,904,26585.3%White alone
- 201,5599.0%Hispanic
- 36,4831.6%Asian alone
- 31,3081.4%Two or more races
- 26,6631.2%American Indian alone
- 14,8060.7%Native Hawaiian and Other
Pacific Islander alone - 16,1370.7%Black alone
- 1,9480.09%Other race alone

-
- 2,557,46675.6%White alone
- 512,08615.1%Hispanic
- 119,3083.5%Two or more races
- 82,3882.4%Asian alone
- 36,9781.1%Native Hawaiian and Other
Pacific Islander alone - 34,8731.0%Black alone
- 22,8030.7%American Indian alone
- 14,8980.4%Other race alone

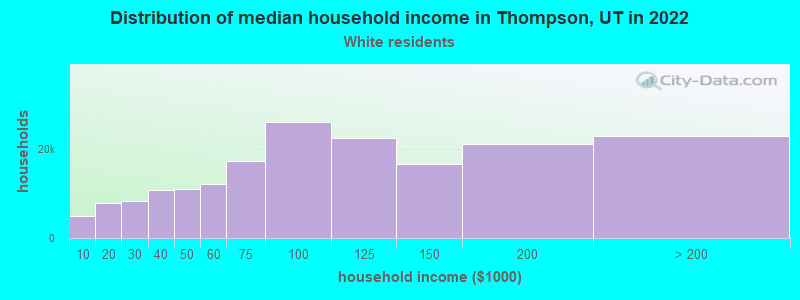
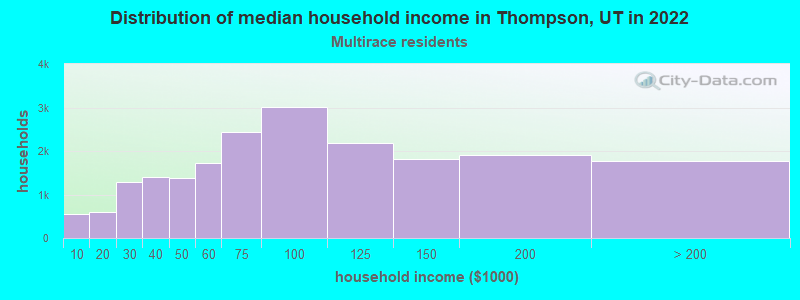
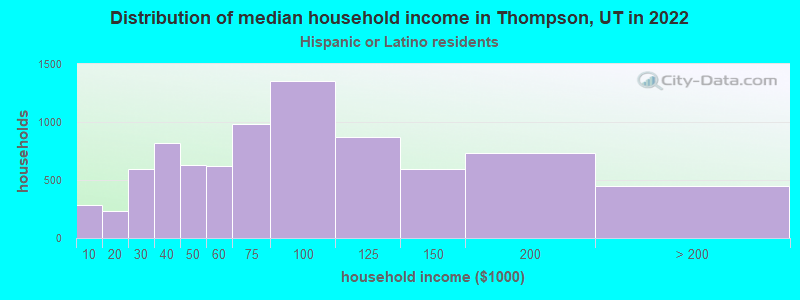
Income and house value in Thompson
- Median household income in 2022
- $40,034White non-Hispanic householders
- $46,193Some other race householders
- $60,689Two or more races householders
- $10,378Hispanic or Latino race householders
- Median 2022 house value
- $325,859White Non-Hispanic householders
- $563,987Some other race householders
- $325,859Two or more races householders
- $563,987Hispanic or Latino householders
Household income for White non-Hispanic householders
Household income for Two or more races householders
Household income for Hispanic or Latino race householders
Zip code: 84540