Races in Tinley Park, Illinois (IL) Detailed Stats
Data:
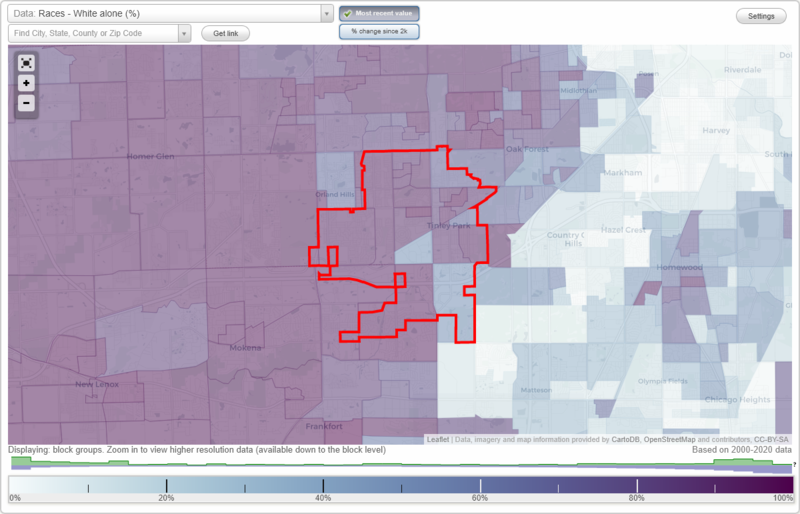
Races - White alone (%)
Races - White alone (% change since 2000)
Races - Black alone (%)
Races - Black alone (% change since 2000)
Races - American Indian alone (%)
Races - American Indian alone (% change since 2000)
Races - Asian alone (%)
Races - Asian alone (% change since 2000)
Races - Hispanic (%)
Races - Hispanic (% change since 2000)
Races - Native Hawaiian and Other Pacific Islander alone (%)
Races - Native Hawaiian and Other Pacific Islander alone (% change since 2000)
Races - Two or more races(%)
Races - Two or more races(% change since 2000)
Races - Other race alone (%)
Races - Other race alone (% change since 2000)
Racial diversity
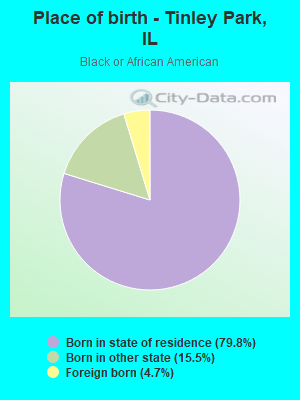
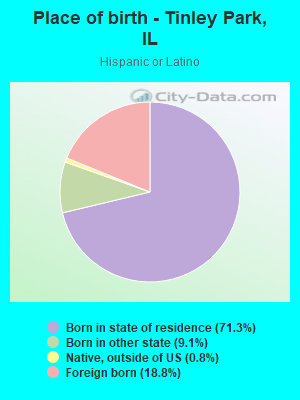
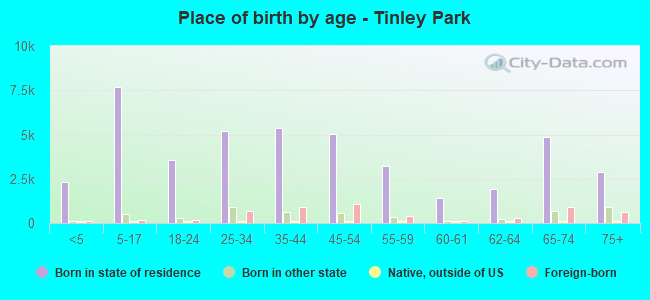
Place of birth - Born in state of residence (%)
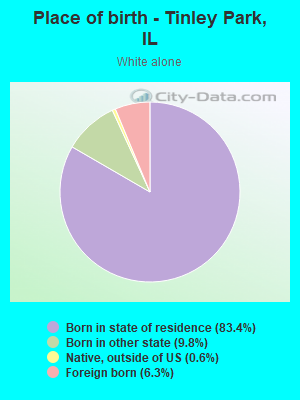
Place of birth - Born in state of residence (%) - White
Place of birth - Born in state of residence (%) - Black or African American
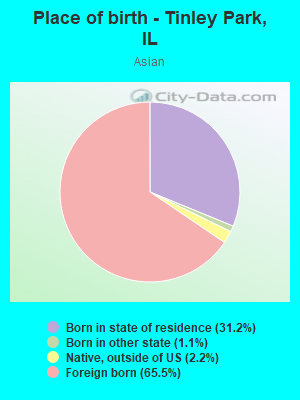
Place of birth - Born in state of residence (%) - Asian
Place of birth - Born in state of residence (%) - Hispanic or Latino
Place of birth - Born in state of residence (%) - American Indian and Alaska Native
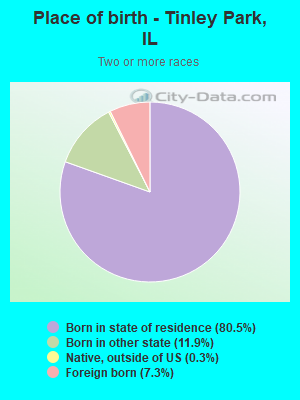
Place of birth - Born in state of residence (%) - Multirace
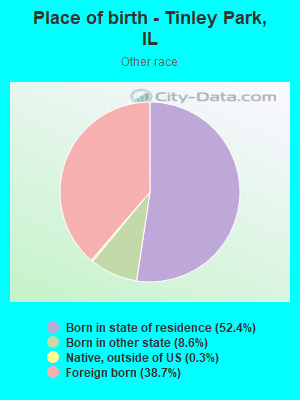
Place of birth - Born in state of residence (%) - Other Race
Place of birth - Born in other state (%)
Place of birth - Born in other state (%) - White
Place of birth - Born in other state (%) - Black or African American
Place of birth - Born in other state (%) - Asian
Place of birth - Born in other state (%) - Hispanic or Latino
Place of birth - Born in other state (%) - American Indian and Alaska Native
Place of birth - Born in other state (%) - Multirace
Place of birth - Born in other state (%) - Other Race
Place of birth - Native, outside of US (%)
Place of birth - Native, outside of US (%) - White
Place of birth - Native, outside of US (%) - Black or African American
Place of birth - Native, outside of US (%) - Asian
Place of birth - Native, outside of US (%) - Hispanic or Latino
Place of birth - Native, outside of US (%) - American Indian and Alaska Native
Place of birth - Native, outside of US (%) - Multirace
Place of birth - Native, outside of US (%) - Other Race
Place of birth - Foreign born (%)
Place of birth - Foreign born (%) - White
Place of birth - Foreign born (%) - Black or African American
Place of birth - Foreign born (%) - Asian
Place of birth - Foreign born (%) - Hispanic or Latino
Place of birth - Foreign born (%) - American Indian and Alaska Native
Place of birth - Foreign born (%) - Multirace
Place of birth - Foreign born (%) - Other Race
Residents speaking English at home (%)
Residents speaking English at home - Born in the United States (%)
Residents speaking English at home - Native, born elsewhere (%)
Residents speaking English at home - Foreign born (%)
Residents speaking Spanish at home (%)
Residents speaking Spanish at home - Born in the United States (%)
Residents speaking Spanish at home - Native, born elsewhere (%)
Residents speaking Spanish at home - Foreign born (%)
Residents speaking other language at home (%)
Residents speaking other language at home - Born in the United States (%)
Residents speaking other language at home - Native, born elsewhere (%)
Residents speaking other language at home - Foreign born (%)
Marital status - Never married (%)
Marital status - Now married (%)
Marital status - Separated (%)
Marital status - Widowed (%)
Marital status - Divorced (%)
Ancestries Reported - Arab (%)
Ancestries Reported - Czech (%)
Ancestries Reported - Danish (%)
Ancestries Reported - Dutch (%)
Ancestries Reported - English (%)
Ancestries Reported - French (%)
Ancestries Reported - French Canadian (%)
Ancestries Reported - German (%)
Ancestries Reported - Greek (%)
Ancestries Reported - Hungarian (%)
Ancestries Reported - Irish (%)
Ancestries Reported - Italian (%)
Ancestries Reported - Lithuanian (%)
Ancestries Reported - Norwegian (%)
Ancestries Reported - Polish (%)
Ancestries Reported - Portuguese (%)
Ancestries Reported - Russian (%)
Ancestries Reported - Scotch-Irish (%)
Ancestries Reported - Scottish (%)
Ancestries Reported - Slovak (%)
Ancestries Reported - Subsaharan African (%)
Ancestries Reported - Swedish (%)
Ancestries Reported - Swiss (%)
Ancestries Reported - Ukrainian (%)
Ancestries Reported - United States (%)
Ancestries Reported - Welsh (%)
Ancestries Reported - West Indian (%)
Ancestries Reported - Other (%)
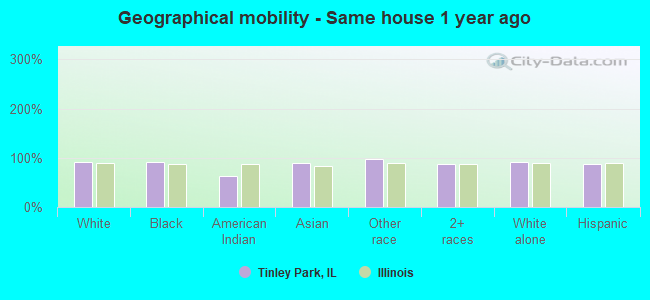
Geographical mobility - Same house 1 year ago (%)
Geographical mobility - Same house 1 year ago (%) - White
Geographical mobility - Same house 1 year ago (%) - Black or African American
Geographical mobility - Same house 1 year ago (%) - Asian
Geographical mobility - Same house 1 year ago (%) - Hispanic or Latino
Geographical mobility - Same house 1 year ago (%) - American Indian and Alaska Native
Geographical mobility - Same house 1 year ago (%) - Multirace
Geographical mobility - Same house 1 year ago (%) - Other Race
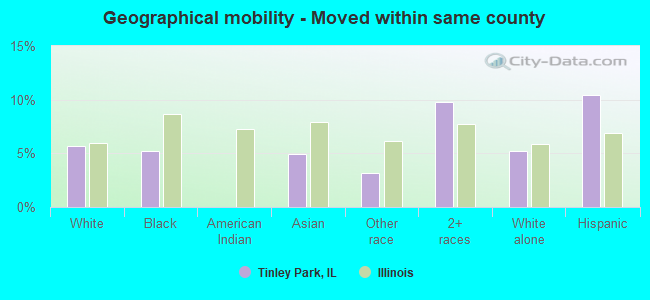
Geographical mobility - Moved within same county (%)
Geographical mobility - Moved within same county (%) - White
Geographical mobility - Moved within same county (%) - Black or African American
Geographical mobility - Moved within same county (%) - Asian
Geographical mobility - Moved within same county (%) - Hispanic or Latino
Geographical mobility - Moved within same county (%) - American Indian and Alaska Native
Geographical mobility - Moved within same county (%) - Multirace
Geographical mobility - Moved within same county (%) - Other Race
Geographical mobility - Moved from different county within same state (%)
Geographical mobility - Moved from different county within same state (%) - White
Geographical mobility - Moved from different county within same state (%) - Black or African American
Geographical mobility - Moved from different county within same state (%) - Asian
Geographical mobility - Moved from different county within same state (%) - Hispanic or Latino
Geographical mobility - Moved from different county within same state (%) - American Indian and Alaska Native
Geographical mobility - Moved from different county within same state (%) - Multirace
Geographical mobility - Moved from different county within same state (%) - Other Race
Geographical mobility - Moved from different state (%)
Geographical mobility - Moved from different state (%) - White
Geographical mobility - Moved from different state (%) - Black or African American
Geographical mobility - Moved from different state (%) - Asian
Geographical mobility - Moved from different state (%) - Hispanic or Latino
Geographical mobility - Moved from different state (%) - American Indian and Alaska Native
Geographical mobility - Moved from different state (%) - Multirace
Geographical mobility - Moved from different state (%) - Other Race
Geographical mobility - Moved from abroad (%)
Geographical mobility - Moved from abroad (%) - White
Geographical mobility - Moved from abroad (%) - Black or African American
Geographical mobility - Moved from abroad (%) - Asian
Geographical mobility - Moved from abroad (%) - Hispanic or Latino
Geographical mobility - Moved from abroad (%) - American Indian and Alaska Native
Geographical mobility - Moved from abroad (%) - Multirace
Geographical mobility - Moved from abroad (%) - Other Race
Place of birth for the foreign-born population - Ireland (%)
Place of birth for the foreign-born population - Denmark (%)
Place of birth for the foreign-born population - Norway (%)
Place of birth for the foreign-born population - Sweden (%)
Place of birth for the foreign-born population - United Kingdom (%)
Place of birth for the foreign-born population - England (%)
Place of birth for the foreign-born population - Scotland (%)
Place of birth for the foreign-born population - Other Northern Europe (%)
Place of birth for the foreign-born population - Austria (%)
Place of birth for the foreign-born population - Belgium (%)
Place of birth for the foreign-born population - France (%)
Place of birth for the foreign-born population - Germany (%)
Place of birth for the foreign-born population - Netherlands (%)
Place of birth for the foreign-born population - Switzerland (%)
Place of birth for the foreign-born population - Other Western Europe (%)
Place of birth for the foreign-born population - Greece (%)
Place of birth for the foreign-born population - Italy (%)
Place of birth for the foreign-born population - Portugal (%)
Place of birth for the foreign-born population - Spain (%)
Place of birth for the foreign-born population - Other Southern Europe (%)
Place of birth for the foreign-born population - Albania (%)
Place of birth for the foreign-born population - Belarus (%)
Place of birth for the foreign-born population - Bosnia and Herzegovina (%)
Place of birth for the foreign-born population - Bulgaria (%)
Place of birth for the foreign-born population - Croatia (%)
Place of birth for the foreign-born population - Czechoslovakia (%)
Place of birth for the foreign-born population - Hungary (%)
Place of birth for the foreign-born population - Latvia (%)
Place of birth for the foreign-born population - Lithuania (%)
Place of birth for the foreign-born population - North Macedonia (Macedonia) (%)
Place of birth for the foreign-born population - Moldova (%)
Place of birth for the foreign-born population - Poland (%)
Place of birth for the foreign-born population - Romania (%)
Place of birth for the foreign-born population - Russia (%)
Place of birth for the foreign-born population - Serbia (%)
Place of birth for the foreign-born population - Ukraine (%)
Place of birth for the foreign-born population - Other Eastern Europe (%)
Place of birth for the foreign-born population - China (%)
Place of birth for the foreign-born population - Hong Kong (%)
Place of birth for the foreign-born population - Taiwan (%)
Place of birth for the foreign-born population - Japan (%)
Place of birth for the foreign-born population - Korea (%)
Place of birth for the foreign-born population - Other Eastern Asia (%)
Place of birth for the foreign-born population - Afghanistan (%)
Place of birth for the foreign-born population - Bangladesh (%)
Place of birth for the foreign-born population - India (%)
Place of birth for the foreign-born population - Iran (%)
Place of birth for the foreign-born population - Kazakhstan (%)
Place of birth for the foreign-born population - Nepal (%)
Place of birth for the foreign-born population - Pakistan (%)
Place of birth for the foreign-born population - Sri Lanka (%)
Place of birth for the foreign-born population - Uzbekistan (%)
Place of birth for the foreign-born population - Other South Central Asia (%)
Place of birth for the foreign-born population - Burma (%)
Place of birth for the foreign-born population - Cambodia (%)
Place of birth for the foreign-born population - Indonesia (%)
Place of birth for the foreign-born population - Laos (%)
Place of birth for the foreign-born population - Malaysia (%)
Place of birth for the foreign-born population - Philippines (%)
Place of birth for the foreign-born population - Singapore (%)
Place of birth for the foreign-born population - Thailand (%)
Place of birth for the foreign-born population - Vietnam (%)
Place of birth for the foreign-born population - Other South Eastern Asia (%)
Place of birth for the foreign-born population - Armenia (%)
Place of birth for the foreign-born population - Iraq (%)
Place of birth for the foreign-born population - Israel (%)
Place of birth for the foreign-born population - Jordan (%)
Place of birth for the foreign-born population - Kuwait (%)
Place of birth for the foreign-born population - Lebanon (%)
Place of birth for the foreign-born population - Saudi Arabia (%)
Place of birth for the foreign-born population - Syria (%)
Place of birth for the foreign-born population - Turkey (%)
Place of birth for the foreign-born population - Yemen (%)
Place of birth for the foreign-born population - Other Western Asia (%)
Place of birth for the foreign-born population - Eritrea (%)
Place of birth for the foreign-born population - Ethiopia (%)
Place of birth for the foreign-born population - Kenya (%)
Place of birth for the foreign-born population - Somalia (%)
Place of birth for the foreign-born population - Uganda (%)
Place of birth for the foreign-born population - Zimbabwe (%)
Place of birth for the foreign-born population - Other Eastern Africa (%)
Place of birth for the foreign-born population - Cameroon (%)
Place of birth for the foreign-born population - Congo (%)
Place of birth for the foreign-born population - Democratic Republic of Congo (Zaire) (%)
Place of birth for the foreign-born population - Other Middle Africa (%)
Place of birth for the foreign-born population - Egypt (%)
Place of birth for the foreign-born population - Morocco (%)
Place of birth for the foreign-born population - Sudan (%)
Place of birth for the foreign-born population - Other Northern Africa (%)
Place of birth for the foreign-born population - South Africa (%)
Place of birth for the foreign-born population - Other Southern Africa (%)
Place of birth for the foreign-born population - Cabo Verde (%)
Place of birth for the foreign-born population - Ghana (%)
Place of birth for the foreign-born population - Liberia (%)
Place of birth for the foreign-born population - Nigeria (%)
Place of birth for the foreign-born population - Senegal (%)
Place of birth for the foreign-born population - Sierra Leone (%)
Place of birth for the foreign-born population - Other Western Africa (%)
Place of birth for the foreign-born population - Australia (%)
Place of birth for the foreign-born population - New Zealand (%)
Place of birth for the foreign-born population - Fiji (%)
Place of birth for the foreign-born population - Micronesia (%)
Place of birth for the foreign-born population - Bahamas (%)
Place of birth for the foreign-born population - Barbados (%)
Place of birth for the foreign-born population - Cuba (%)
Place of birth for the foreign-born population - Dominica (%)
Place of birth for the foreign-born population - Dominican Republic (%)
Place of birth for the foreign-born population - Grenada (%)
Place of birth for the foreign-born population - Haiti (%)
Place of birth for the foreign-born population - Jamaica (%)
Place of birth for the foreign-born population - St. Vincent and the Grenadines (%)
Place of birth for the foreign-born population - Trinidad and Tobago (%)
Place of birth for the foreign-born population - West Indies (%)
Place of birth for the foreign-born population - Other Caribbean (%)
Place of birth for the foreign-born population - Belize (%)
Place of birth for the foreign-born population - Costa Rica (%)
Place of birth for the foreign-born population - El Salvador (%)
Place of birth for the foreign-born population - Guatemala (%)
Place of birth for the foreign-born population - Honduras (%)
Place of birth for the foreign-born population - Mexico (%)
Place of birth for the foreign-born population - Nicaragua (%)
Place of birth for the foreign-born population - Panama (%)
Place of birth for the foreign-born population - Other Central America (%)
Place of birth for the foreign-born population - Argentina (%)
Place of birth for the foreign-born population - Bolivia (%)
Place of birth for the foreign-born population - Brazil (%)
Place of birth for the foreign-born population - Chile (%)
Place of birth for the foreign-born population - Colombia (%)
Place of birth for the foreign-born population - Ecuador (%)
Place of birth for the foreign-born population - Guyana (%)
Place of birth for the foreign-born population - Peru (%)
Place of birth for the foreign-born population - Uruguay (%)
Place of birth for the foreign-born population - Venezuela (%)
Place of birth for the foreign-born population - Other South America (%)
Place of birth for the foreign-born population - Canada (%)
Place of birth for the foreign-born population - Other Northern America (%)
Place of birth for the foreign-born population - Other (%)
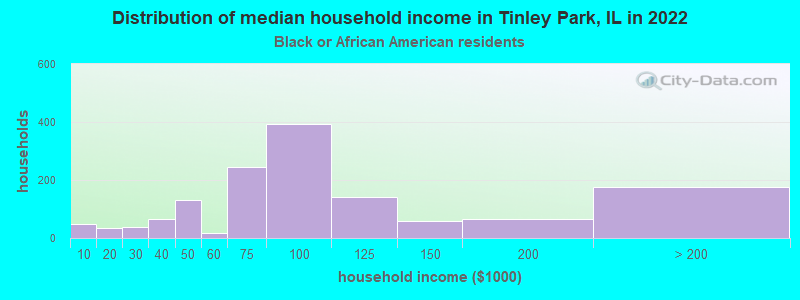
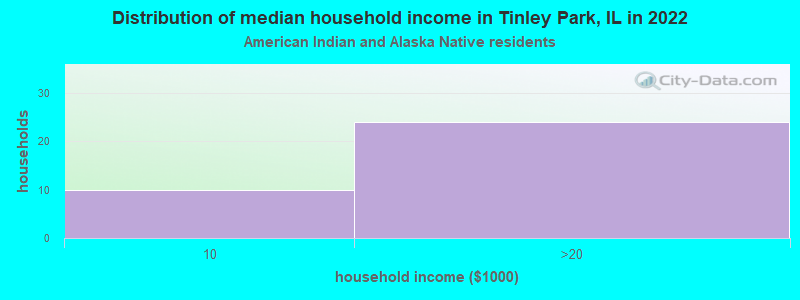
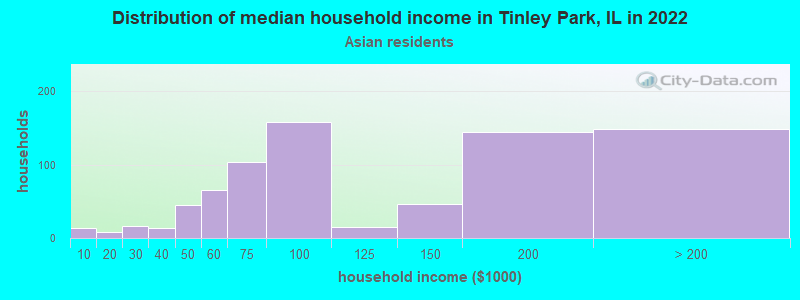
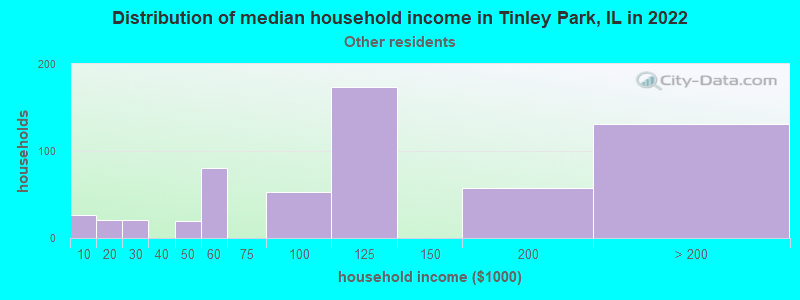
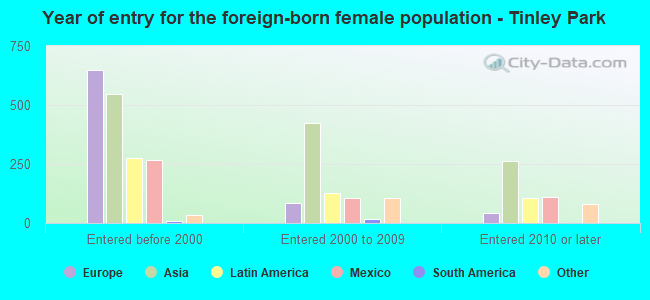
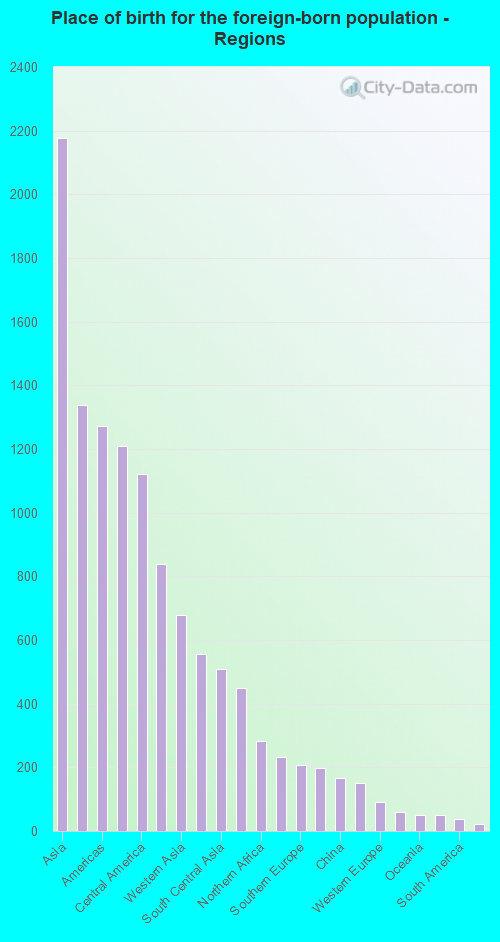
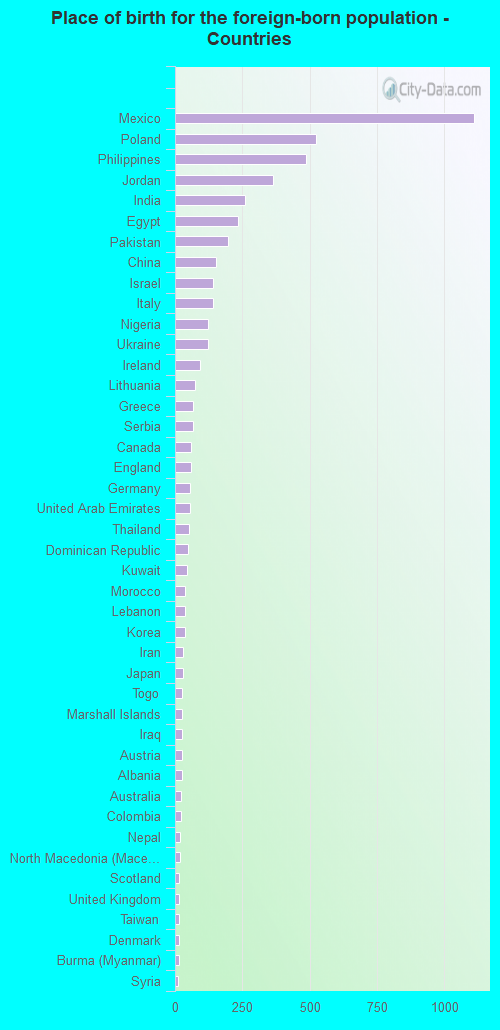
According to 2022 data, the most numerous races in Tinley Park, IL are White alone (40,923 residents), Hispanic (6,511 residents), and Black alone (3,162 residents). 83.3% of Tinley Park residents speak English at home. 9.7% of Tinley Park, IL residents are foreign-born (3.9% born in Asia, 2.4% born in Europe, 2.2% born in Latin America), which is 43.7% less than the foreign-born rate of 14.0% across the entire state of Illinois.
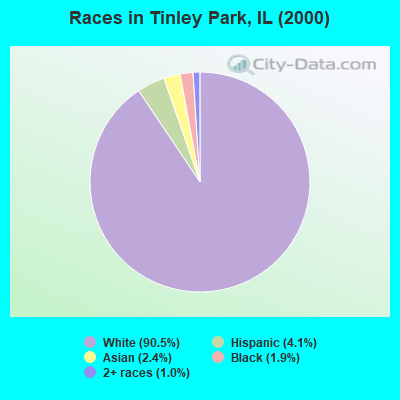
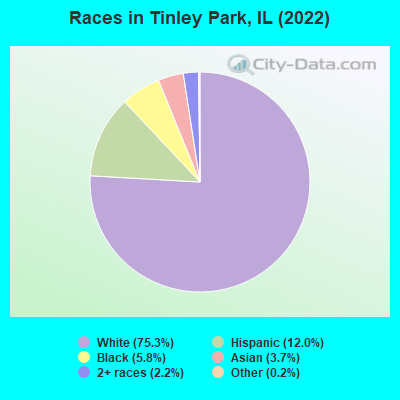
Race distribution in Tinley Park
2000 2022
8,424,140 67.8% White alone 1,856,152 14.9% Black alone 1,530,262 12.3% Hispanic 419,916 3.4% Asian alone 153,996 1.2% Two or more races 13,479 0.1% Other race alone 18,232 0.1% American Indian alone 3,116 0.03% Native Hawaiian and Other
7,356,301 58.5% White alone 2,299,726 18.3% Hispanic 1,660,423 13.2% Black alone 747,296 5.9% Asian alone 458,599 3.6% Two or more races 45,386 0.4% Other race alone 10,405 0.08% American Indian alone 3,896 0.03% Native Hawaiian and Other
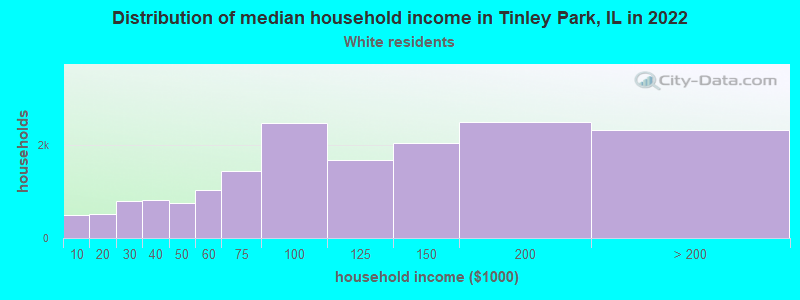
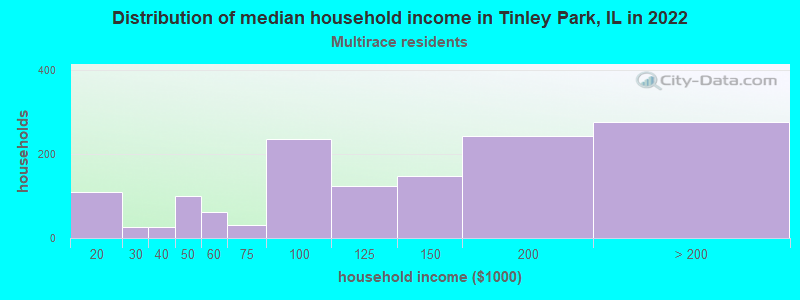
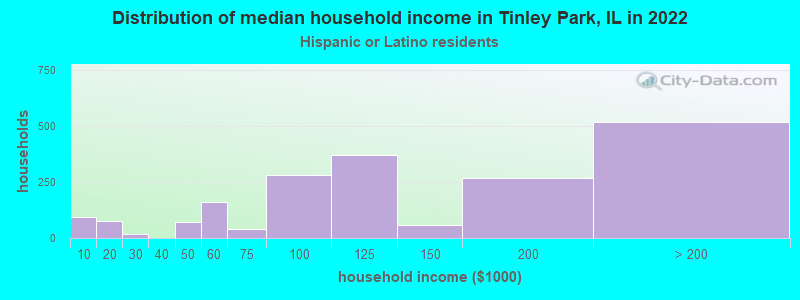
Income and house value in Tinley Park Median household income in 2022 $97,394 White non-Hispanic householders$79,049 Black householders$93,482 Asian householders$118,577 Some other race householders$125,719 Two or more races householders$118,024 Hispanic or Latino race householdersMedian 2022 house value $299,441 White Non-Hispanic householders$379,848 Black or African American householders $349,673 Asian householders$322,516 Some other race householders$314,528 Two or more races householders$261,811 Hispanic or Latino householders
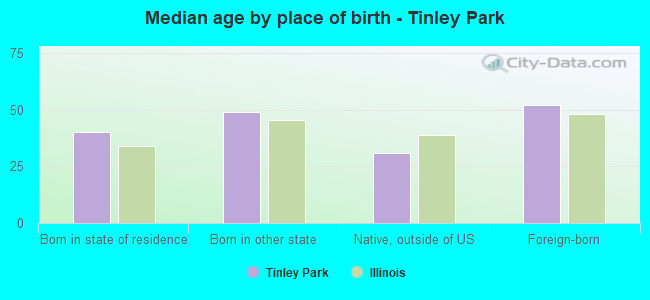
Median age by race in Tinley Park
45.5 Median age for White residents41.1 50.1 43.4 Median age for Black or African American residents32.2 49.1 -680,473,372.1 Median age for American Indian / Alaska Native residents-736,736,736.0 -641,399,416.3 45.0 Median age for Asian residents49.8 43.6 -687,999,999.3 Median age for Native Hawaiian / Pacific Islander residents-918,721,460.3 -610,229,276.3 34.6 Median age for Other race residents42.2 31.4 23.8 Median age for Two or more races residents26.7 19.8 45.3 Median age for White alone residents40.6 49.3 30.1 Median age for Hispanic or Latino residents32.0 29.0
Owner/renter occupied households by race in Tinley Park
House owners and renters - White residents 15,343 90.3% Owner occupied1,655 9.7% Renter occupiedHouse owners and renters - Black or African American residents 858 60.6% Owner occupied559 39.4% Renter occupiedHouse owners and renters - American Indian / Alaska Native residents 36 100.0% Renter occupiedHouse owners and renters - Asian residents 697 87.6% Owner occupied98 12.4% Renter occupiedHouse owners and renters - Other race residents 453 77.6% Owner occupied130 22.4% Renter occupiedHouse owners and renters - Two or more races residents 1,168 81.5% Owner occupied265 18.5% Renter occupiedHouse owners and renters - White alone residents 15,647 90.1% Owner occupied1,722 9.9% Renter occupiedHouse owners and renters - Hispanic or Latino residents 1,644 83.5% Owner occupied324 16.5% Renter occupied
Language usage in Tinley Park
English speakers - Total 83.3% of residents of Tinley Park speak English at home.
4.7% of residents speak Spanish at home 1,572 63.9% Speak English very well888 36.1% Speak English less than very well11.6% of residents speak other language at home 4,340 72.3% Speak English very well1,660 27.7% Speak English less than very well
English speakers - Born in the United States 87.5% of residents of Tinley Park speak English at home.
4.7% of residents speak Spanish at home 230 94.7% Speak English very well13 5.3% Speak English less than very well8.2% of residents speak other language at home 421 100.0% Speak English very well
English speakers - Native, born elsewhere 45.1% of residents of Tinley Park speak English at home.
12.1% of residents speak Spanish at home 38 100.0% Speak English very well43.5% of residents speak other language at home 97 70.8% Speak English very well40 29.2% Speak English less than very well
English speakers - Foreign-born 13.5% of residents of Tinley Park speak English at home.
20.8% of residents speak Spanish at home 405 37.2% Speak English very well684 62.8% Speak English less than very well65.2% of residents speak other language at home 2,018 59.1% Speak English very well1,394 40.9% Speak English less than very well
White (Caucasian) - Speak only English Native:
97.5% (34,605)Foreign-born:
18.8% (406)
White (Caucasian) - Speak another language Native:
5.1% (1,793)Foreign-born:
81.5% (1,761)
Black or African American - Speak only English Native:
98.4% (2,913)Foreign-born:
24.7% (37)
Black or African American - Speak another language Native:
1.6% (48)Foreign-born:
72.3% (110)
Asian - Speak only English Native:
40.0% (227)Foreign-born:
12.7% (167)
Asian - Speak another language Native:
59.9% (340)Foreign-born:
87.1% (1,152)
Other race - Speak only English Native:
62.7% (749)Foreign-born:
4.8% (38)
Other race - Speak another language Native:
40.5% (483)Foreign-born:
95.2% (745)
Two or more races - Speak another language Native:
13.7% (585)Foreign-born:
100.0% (369)
White alone - Speak only English Native:
93.3% (34,223)Foreign-born:
14.8% (371)
White alone - Speak another language Native:
6.5% (2,381)Foreign-born:
85.2% (2,134)
Hispanic or Latino - Speak only English Native:
77.2% (3,710)Foreign-born:
9.1% (111)
Hispanic or Latino - Speak another language Native:
25.7% (1,234)Foreign-born:
90.4% (1,101)
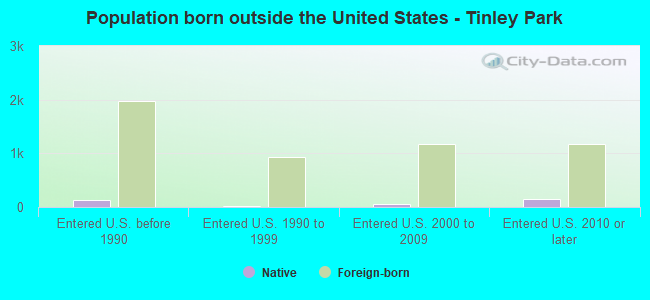
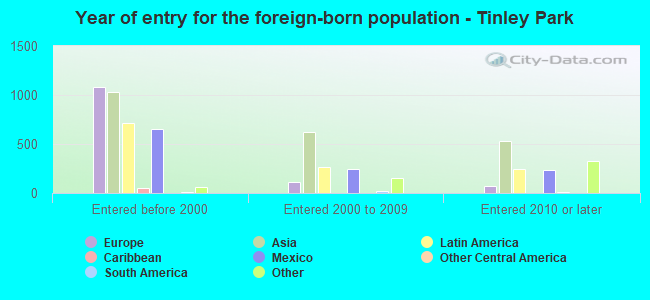
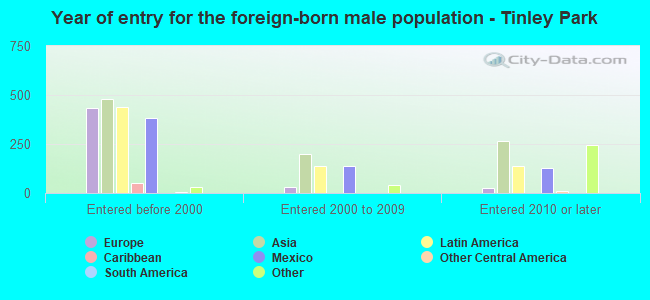
Foreign-born residents in Tinley Park 5,292 residents are foreign born (3.9% Asia , 2.4% Europe , 2.2% Latin America ).
This city:
9.7%Illinois:
14.1%
Marital status for residents in Tinley Park Marital status - White (Caucasian) population 15 years and over
Males 33.5% Never married56.0% Now married0.1% Separated3.6% Widowed6.8% DivorcedFemales 22.9% Never married54.1% Now married0.7% Separated10.3% Widowed11.8% DivorcedWomen who gave birth in the past 12 months Now married:
88.4% (432)Unmarried:
11.6% (57)
Women who did not give birth in the past 12 months Now married:
48.7% (3,254)Unmarried:
51.3% (3,424)
Marital status - Black or African American population 15 years and over
Males 40.4% Never married43.8% Now married2.6% Separated1.4% Widowed11.8% DivorcedFemales 43.5% Never married30.0% Now married3.6% Separated8.5% Widowed14.4% DivorcedWomen who gave birth in the past 12 months Now married:
0.0% (0)Unmarried:
100.0% (42)
Women who did not give birth in the past 12 months Now married:
34.0% (318)Unmarried:
66.0% (619)
Marital status - Asian population 15 years and over
Males 21.8% Never married73.7% Now married0.0% Separated0.0% Widowed4.5% DivorcedFemales 33.8% Never married54.0% Now married0.8% Separated5.5% Widowed5.9% DivorcedWomen who gave birth in the past 12 months Now married:
100.0% (48)Unmarried:
0.0% (0)
Women who did not give birth in the past 12 months Now married:
36.2% (207)Unmarried:
63.8% (366)
Marital status - Other race population 15 years and over
Males 31.7% Never married55.0% Now married4.3% Separated0.0% Widowed9.0% DivorcedFemales 33.7% Never married51.2% Now married0.0% Separated7.8% Widowed7.3% DivorcedWomen who did not give birth in the past 12 months Now married:
53.6% (349)Unmarried:
46.4% (302)
Marital status - Two or more races population 15 years and over
Males 45.5% Never married38.8% Now married0.0% Separated7.7% Widowed8.0% DivorcedFemales 45.1% Never married42.1% Now married0.0% Separated2.7% Widowed10.1% DivorcedWomen who gave birth in the past 12 months Now married:
100.0% (67)Unmarried:
0.0% (0)
Women who did not give birth in the past 12 months Now married:
34.8% (374)Unmarried:
65.2% (702)
Marital status - White alone, not Hispanic / Latino population 15 years and over
Males 33.7% Never married55.7% Now married0.2% Separated3.7% Widowed6.8% DivorcedFemales 22.6% Never married54.2% Now married0.8% Separated10.5% Widowed11.8% DivorcedWomen who gave birth in the past 12 months Now married:
87.3% (439)Unmarried:
12.7% (64)
Women who did not give birth in the past 12 months Now married:
49.1% (3,459)Unmarried:
50.9% (3,590)
Marital status - Hispanic or Latino population 15 years and over
Males 37.0% Never married51.1% Now married1.2% Separated4.5% Widowed6.2% DivorcedFemales 35.4% Never married49.3% Now married0.0% Separated5.2% Widowed10.1% DivorcedWomen who gave birth in the past 12 months Now married:
100.0% (97)Unmarried:
0.0% (0)
Women who did not give birth in the past 12 months Now married:
45.8% (700)Unmarried:
54.2% (829)
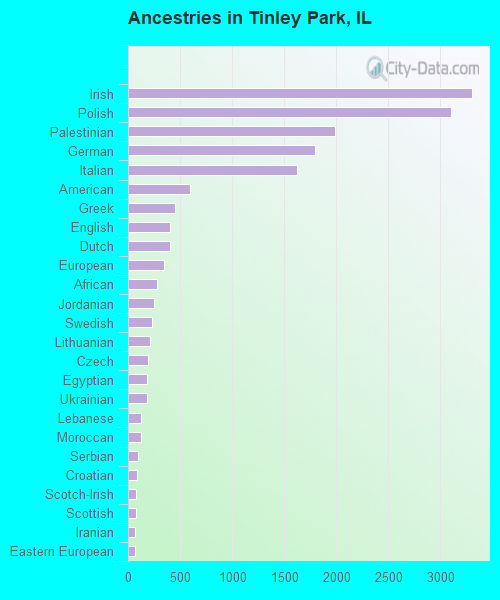
Ancestries in Tinley Park
3,301 13.8% Irish3,103 13.0% Polish1,988 8.3% Palestinian1,795 7.5% German1,627 6.8% Italian600 2.5% American448 1.9% Greek408 1.7% English401 1.7% Dutch346 1.4% European280 1.2% African250 1.0% Jordanian226 0.9% Swedish215 0.9% Lithuanian190 0.8% Czech186 0.8% Egyptian184 0.8% Ukrainian129 0.5% Lebanese126 0.5% Moroccan94 0.4% Serbian88 0.4% Croatian79 0.3% Scotch-Irish77 0.3% Scottish71 0.3% Iranian68 0.3% Eastern European61 0.3% Austrian51 0.2% Arab47 0.2% Czechoslovakian47 0.2% Norwegian44 0.2% French Canadian44 0.2% French41 0.2% Scandinavian37 0.2% Nigerian32 0.1% Slovak20 0.08% British20 0.08% Danish19 0.08% Hungarian15 0.06% Turkish14 0.06% Ethiopian13 0.05% Welsh12 0.05% Albanian11 0.05% Belgian5 0.02% Celtic
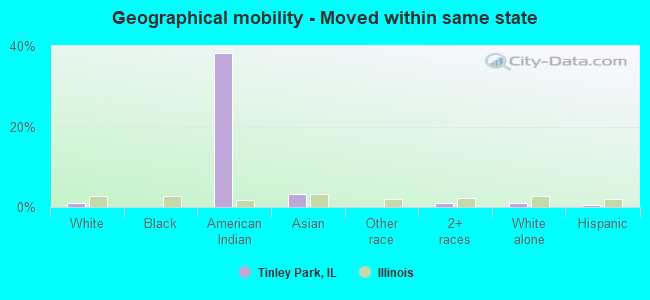
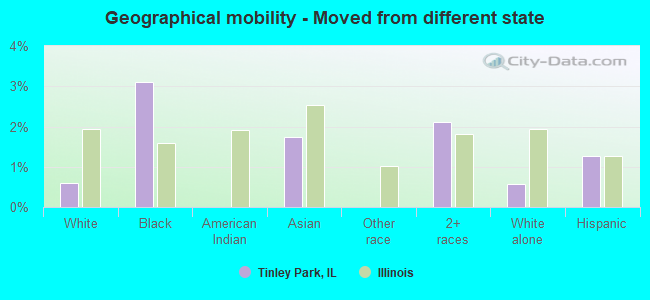
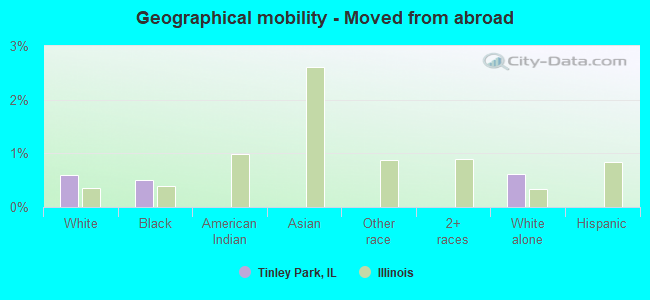
Geographical mobility in Tinley Park Same house 1 year ago 34,935 91.5% White (Caucasian)2,927 92.0% Black or African American19 62.3% American Indian / Alaska Native1,758 89.3% Asian1,997 97.2% Other race4,402 86.4% Two or more races37,403 92.2% White alone, not Hispanic / Latino5,571 87.3% Hispanic or LatinoMoved within same county 2,182 5.7% White / Caucasian166 5.2% Black or African American97 4.9% Asian65 3.2% Other race500 9.8% Two or more races2,116 5.2% White alone, not Hispanic / Latino669 10.5% Hispanic or LatinoMoved within same state 369 1.0% White / Caucasian12 38.2% American Indian / Alaska Native64 3.2% Asian49 1.0% Two or more races387 1.0% White alone, not Hispanic / Latino26 0.4% Hispanic or LatinoMoved from different state 224 0.6% White / Caucasian99 3.1% Black or African American34 1.7% Asian108 2.1% Two or more races230 0.6% White alone, not Hispanic / Latino81 1.3% Hispanic or LatinoMoved from abroad 226 0.6% White16 0.5% Black or African American246 0.6% White alone, not Hispanic / Latino
Children Nativity (place of birth) in Tinley Park
Children under 6 years - Living with two parents Both parents native 1,709 100.0% NativeBoth parents foreign-born 268 84.8% Native48 15.2% Foreign-bornOne native, one foreign-born parent 493 100.0% NativeChildren under 6 years - Living with one parent Native parent 458 100.0% NativeForeign-born parent 18 100.0% NativeChildren 6 to 17 years - Living with two parents Both parents native 4,469 99.6% Native20 0.4% Foreign-bornBoth parents foreign-born 599 84.7% Native108 15.3% Foreign-bornOne native, one foreign-born parent 702 100.0% NativeChildren 6 to 17 years - Living with one parent Native parent 1,398 100.0% NativeForeign-born parent 279 51.1% Native267 48.9% Foreign-born
Grandparents responsible for own grandchildren in Tinley Park
Grandparents (30 to 59 years) White / Caucasian 41 46.7% Responsible for grandchildren47 53.3% Not responsible for grandchildrenBlack or African American 87 100.0% Not responsible for grandchildrenTwo or more races 25 100.0% Not responsible for grandchildrenWhite alone, not Hispanic / Latino 55 60.5% Responsible for grandchildren36 39.5% Not responsible for grandchildrenHispanic or Latino 9 100.0% Not responsible for grandchildrenGrandparents (60 years and over) White / Caucasian 33 7.6% Responsible for grandchildren404 92.4% Not responsible for grandchildrenBlack or African American 34 100.0% Responsible for grandchildrenWhite alone, not Hispanic / Latino 40 7.2% Responsible for grandchildren519 92.8% Not responsible for grandchildrenHispanic or Latino 44 100.0% Not responsible for grandchildren