Races in Triangle, Virginia (VA) Detailed Stats
Data:
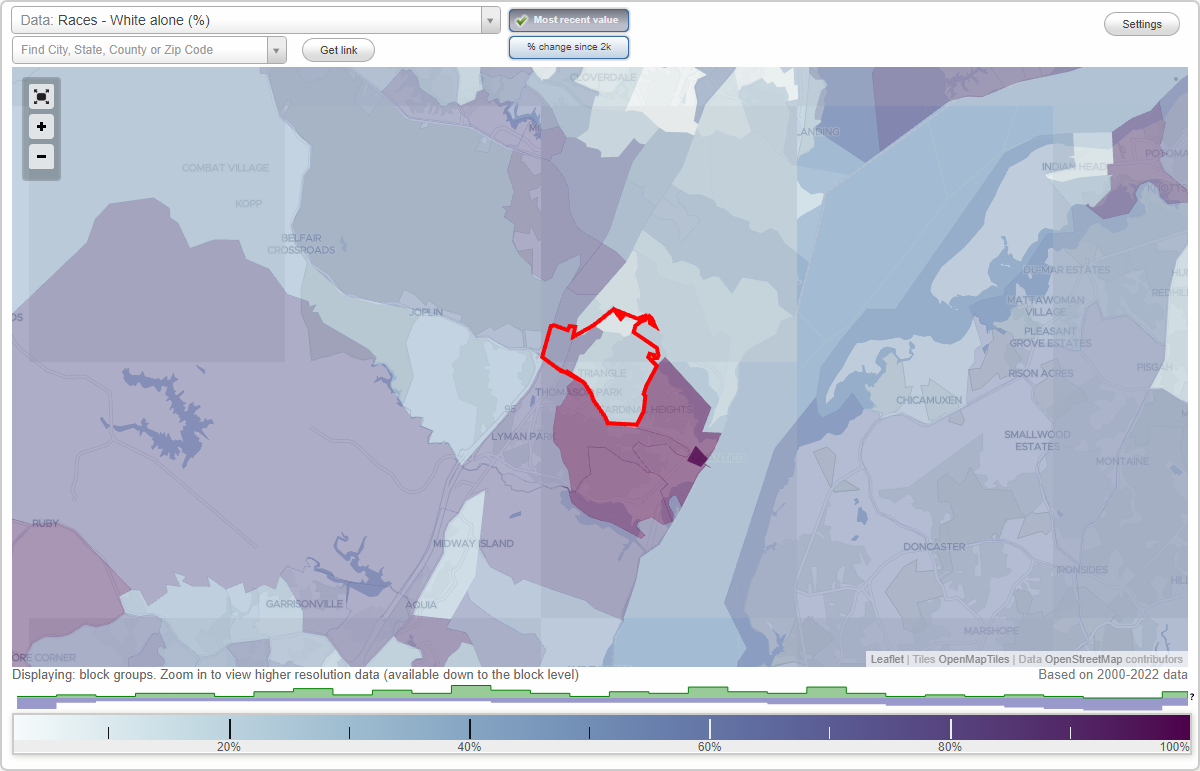
Races - White alone (%)
Races - White alone (% change since 2000)
Races - Black alone (%)
Races - Black alone (% change since 2000)
Races - American Indian alone (%)
Races - American Indian alone (% change since 2000)
Races - Asian alone (%)
Races - Asian alone (% change since 2000)
Races - Hispanic (%)
Races - Hispanic (% change since 2000)
Races - Native Hawaiian and Other Pacific Islander alone (%)
Races - Native Hawaiian and Other Pacific Islander alone (% change since 2000)
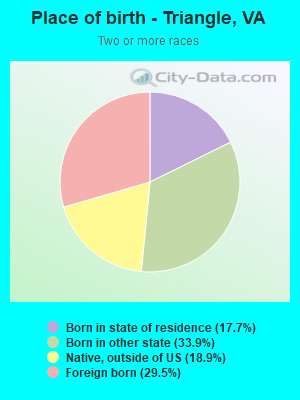
Races - Two or more races(%)
Races - Two or more races(% change since 2000)
Races - Other race alone (%)
Races - Other race alone (% change since 2000)
Racial diversity
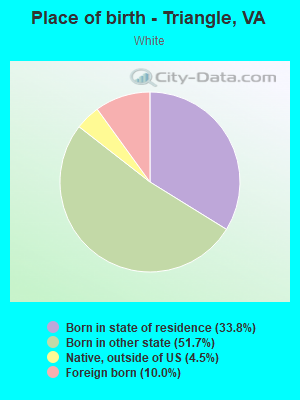
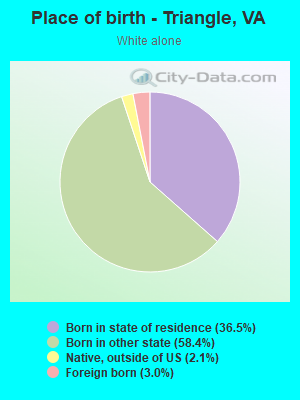
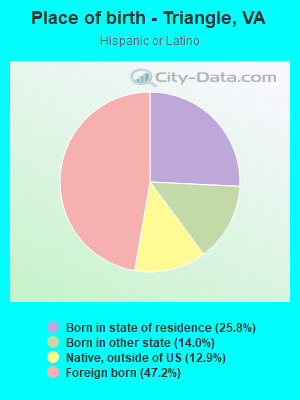
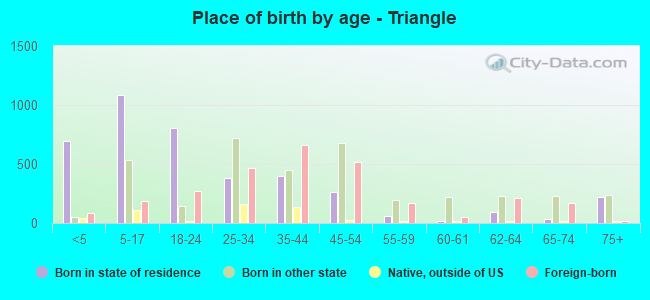
Place of birth - Born in state of residence (%)
Place of birth - Born in state of residence (%) - White
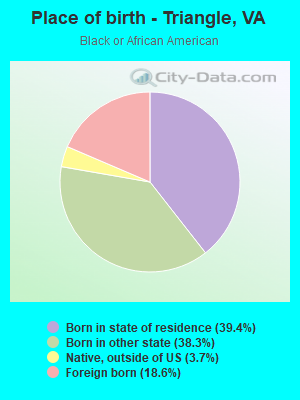
Place of birth - Born in state of residence (%) - Black or African American
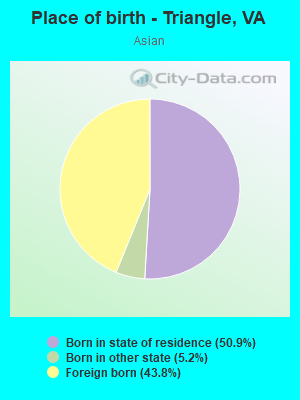
Place of birth - Born in state of residence (%) - Asian
Place of birth - Born in state of residence (%) - Hispanic or Latino
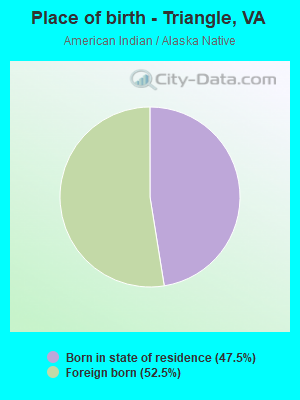
Place of birth - Born in state of residence (%) - American Indian and Alaska Native
Place of birth - Born in state of residence (%) - Multirace
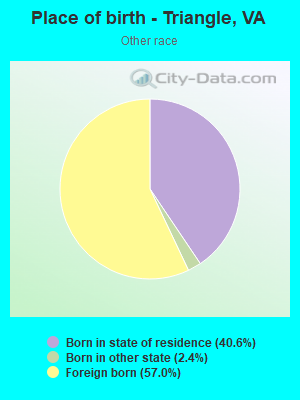
Place of birth - Born in state of residence (%) - Other Race
Place of birth - Born in other state (%)
Place of birth - Born in other state (%) - White
Place of birth - Born in other state (%) - Black or African American
Place of birth - Born in other state (%) - Asian
Place of birth - Born in other state (%) - Hispanic or Latino
Place of birth - Born in other state (%) - American Indian and Alaska Native
Place of birth - Born in other state (%) - Multirace
Place of birth - Born in other state (%) - Other Race
Place of birth - Native, outside of US (%)
Place of birth - Native, outside of US (%) - White
Place of birth - Native, outside of US (%) - Black or African American
Place of birth - Native, outside of US (%) - Asian
Place of birth - Native, outside of US (%) - Hispanic or Latino
Place of birth - Native, outside of US (%) - American Indian and Alaska Native
Place of birth - Native, outside of US (%) - Multirace
Place of birth - Native, outside of US (%) - Other Race
Place of birth - Foreign born (%)
Place of birth - Foreign born (%) - White
Place of birth - Foreign born (%) - Black or African American
Place of birth - Foreign born (%) - Asian
Place of birth - Foreign born (%) - Hispanic or Latino
Place of birth - Foreign born (%) - American Indian and Alaska Native
Place of birth - Foreign born (%) - Multirace
Place of birth - Foreign born (%) - Other Race
Residents speaking English at home (%)
Residents speaking English at home - Born in the United States (%)
Residents speaking English at home - Native, born elsewhere (%)
Residents speaking English at home - Foreign born (%)
Residents speaking Spanish at home (%)
Residents speaking Spanish at home - Born in the United States (%)
Residents speaking Spanish at home - Native, born elsewhere (%)
Residents speaking Spanish at home - Foreign born (%)
Residents speaking other language at home (%)
Residents speaking other language at home - Born in the United States (%)
Residents speaking other language at home - Native, born elsewhere (%)
Residents speaking other language at home - Foreign born (%)
Marital status - Never married (%)
Marital status - Now married (%)
Marital status - Separated (%)
Marital status - Widowed (%)
Marital status - Divorced (%)
Ancestries Reported - Arab (%)
Ancestries Reported - Czech (%)
Ancestries Reported - Danish (%)
Ancestries Reported - Dutch (%)
Ancestries Reported - English (%)
Ancestries Reported - French (%)
Ancestries Reported - French Canadian (%)
Ancestries Reported - German (%)
Ancestries Reported - Greek (%)
Ancestries Reported - Hungarian (%)
Ancestries Reported - Irish (%)
Ancestries Reported - Italian (%)
Ancestries Reported - Lithuanian (%)
Ancestries Reported - Norwegian (%)
Ancestries Reported - Polish (%)
Ancestries Reported - Portuguese (%)
Ancestries Reported - Russian (%)
Ancestries Reported - Scotch-Irish (%)
Ancestries Reported - Scottish (%)
Ancestries Reported - Slovak (%)
Ancestries Reported - Subsaharan African (%)
Ancestries Reported - Swedish (%)
Ancestries Reported - Swiss (%)
Ancestries Reported - Ukrainian (%)
Ancestries Reported - United States (%)
Ancestries Reported - Welsh (%)
Ancestries Reported - West Indian (%)
Ancestries Reported - Other (%)
Geographical mobility - Same house 1 year ago (%)
Geographical mobility - Same house 1 year ago (%) - White
Geographical mobility - Same house 1 year ago (%) - Black or African American
Geographical mobility - Same house 1 year ago (%) - Asian
Geographical mobility - Same house 1 year ago (%) - Hispanic or Latino
Geographical mobility - Same house 1 year ago (%) - American Indian and Alaska Native
Geographical mobility - Same house 1 year ago (%) - Multirace
Geographical mobility - Same house 1 year ago (%) - Other Race
Geographical mobility - Moved within same county (%)
Geographical mobility - Moved within same county (%) - White
Geographical mobility - Moved within same county (%) - Black or African American
Geographical mobility - Moved within same county (%) - Asian
Geographical mobility - Moved within same county (%) - Hispanic or Latino
Geographical mobility - Moved within same county (%) - American Indian and Alaska Native
Geographical mobility - Moved within same county (%) - Multirace
Geographical mobility - Moved within same county (%) - Other Race
Geographical mobility - Moved from different county within same state (%)
Geographical mobility - Moved from different county within same state (%) - White
Geographical mobility - Moved from different county within same state (%) - Black or African American
Geographical mobility - Moved from different county within same state (%) - Asian
Geographical mobility - Moved from different county within same state (%) - Hispanic or Latino
Geographical mobility - Moved from different county within same state (%) - American Indian and Alaska Native
Geographical mobility - Moved from different county within same state (%) - Multirace
Geographical mobility - Moved from different county within same state (%) - Other Race
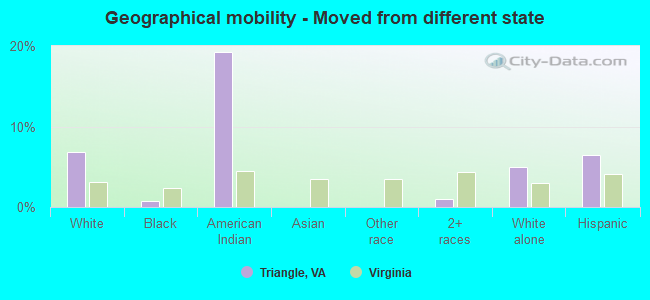
Geographical mobility - Moved from different state (%)
Geographical mobility - Moved from different state (%) - White
Geographical mobility - Moved from different state (%) - Black or African American
Geographical mobility - Moved from different state (%) - Asian
Geographical mobility - Moved from different state (%) - Hispanic or Latino
Geographical mobility - Moved from different state (%) - American Indian and Alaska Native
Geographical mobility - Moved from different state (%) - Multirace
Geographical mobility - Moved from different state (%) - Other Race
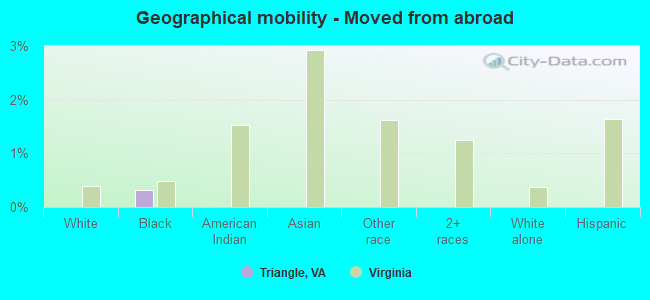
Geographical mobility - Moved from abroad (%)
Geographical mobility - Moved from abroad (%) - White
Geographical mobility - Moved from abroad (%) - Black or African American
Geographical mobility - Moved from abroad (%) - Asian
Geographical mobility - Moved from abroad (%) - Hispanic or Latino
Geographical mobility - Moved from abroad (%) - American Indian and Alaska Native
Geographical mobility - Moved from abroad (%) - Multirace
Geographical mobility - Moved from abroad (%) - Other Race
Place of birth for the foreign-born population - Ireland (%)
Place of birth for the foreign-born population - Denmark (%)
Place of birth for the foreign-born population - Norway (%)
Place of birth for the foreign-born population - Sweden (%)
Place of birth for the foreign-born population - United Kingdom (%)
Place of birth for the foreign-born population - England (%)
Place of birth for the foreign-born population - Scotland (%)
Place of birth for the foreign-born population - Other Northern Europe (%)
Place of birth for the foreign-born population - Austria (%)
Place of birth for the foreign-born population - Belgium (%)
Place of birth for the foreign-born population - France (%)
Place of birth for the foreign-born population - Germany (%)
Place of birth for the foreign-born population - Netherlands (%)
Place of birth for the foreign-born population - Switzerland (%)
Place of birth for the foreign-born population - Other Western Europe (%)
Place of birth for the foreign-born population - Greece (%)
Place of birth for the foreign-born population - Italy (%)
Place of birth for the foreign-born population - Portugal (%)
Place of birth for the foreign-born population - Spain (%)
Place of birth for the foreign-born population - Other Southern Europe (%)
Place of birth for the foreign-born population - Albania (%)
Place of birth for the foreign-born population - Belarus (%)
Place of birth for the foreign-born population - Bosnia and Herzegovina (%)
Place of birth for the foreign-born population - Bulgaria (%)
Place of birth for the foreign-born population - Croatia (%)
Place of birth for the foreign-born population - Czechoslovakia (%)
Place of birth for the foreign-born population - Hungary (%)
Place of birth for the foreign-born population - Latvia (%)
Place of birth for the foreign-born population - Lithuania (%)
Place of birth for the foreign-born population - North Macedonia (Macedonia) (%)
Place of birth for the foreign-born population - Moldova (%)
Place of birth for the foreign-born population - Poland (%)
Place of birth for the foreign-born population - Romania (%)
Place of birth for the foreign-born population - Russia (%)
Place of birth for the foreign-born population - Serbia (%)
Place of birth for the foreign-born population - Ukraine (%)
Place of birth for the foreign-born population - Other Eastern Europe (%)
Place of birth for the foreign-born population - China (%)
Place of birth for the foreign-born population - Hong Kong (%)
Place of birth for the foreign-born population - Taiwan (%)
Place of birth for the foreign-born population - Japan (%)
Place of birth for the foreign-born population - Korea (%)
Place of birth for the foreign-born population - Other Eastern Asia (%)
Place of birth for the foreign-born population - Afghanistan (%)
Place of birth for the foreign-born population - Bangladesh (%)
Place of birth for the foreign-born population - India (%)
Place of birth for the foreign-born population - Iran (%)
Place of birth for the foreign-born population - Kazakhstan (%)
Place of birth for the foreign-born population - Nepal (%)
Place of birth for the foreign-born population - Pakistan (%)
Place of birth for the foreign-born population - Sri Lanka (%)
Place of birth for the foreign-born population - Uzbekistan (%)
Place of birth for the foreign-born population - Other South Central Asia (%)
Place of birth for the foreign-born population - Burma (%)
Place of birth for the foreign-born population - Cambodia (%)
Place of birth for the foreign-born population - Indonesia (%)
Place of birth for the foreign-born population - Laos (%)
Place of birth for the foreign-born population - Malaysia (%)
Place of birth for the foreign-born population - Philippines (%)
Place of birth for the foreign-born population - Singapore (%)
Place of birth for the foreign-born population - Thailand (%)
Place of birth for the foreign-born population - Vietnam (%)
Place of birth for the foreign-born population - Other South Eastern Asia (%)
Place of birth for the foreign-born population - Armenia (%)
Place of birth for the foreign-born population - Iraq (%)
Place of birth for the foreign-born population - Israel (%)
Place of birth for the foreign-born population - Jordan (%)
Place of birth for the foreign-born population - Kuwait (%)
Place of birth for the foreign-born population - Lebanon (%)
Place of birth for the foreign-born population - Saudi Arabia (%)
Place of birth for the foreign-born population - Syria (%)
Place of birth for the foreign-born population - Turkey (%)
Place of birth for the foreign-born population - Yemen (%)
Place of birth for the foreign-born population - Other Western Asia (%)
Place of birth for the foreign-born population - Eritrea (%)
Place of birth for the foreign-born population - Ethiopia (%)
Place of birth for the foreign-born population - Kenya (%)
Place of birth for the foreign-born population - Somalia (%)
Place of birth for the foreign-born population - Uganda (%)
Place of birth for the foreign-born population - Zimbabwe (%)
Place of birth for the foreign-born population - Other Eastern Africa (%)
Place of birth for the foreign-born population - Cameroon (%)
Place of birth for the foreign-born population - Congo (%)
Place of birth for the foreign-born population - Democratic Republic of Congo (Zaire) (%)
Place of birth for the foreign-born population - Other Middle Africa (%)
Place of birth for the foreign-born population - Egypt (%)
Place of birth for the foreign-born population - Morocco (%)
Place of birth for the foreign-born population - Sudan (%)
Place of birth for the foreign-born population - Other Northern Africa (%)
Place of birth for the foreign-born population - South Africa (%)
Place of birth for the foreign-born population - Other Southern Africa (%)
Place of birth for the foreign-born population - Cabo Verde (%)
Place of birth for the foreign-born population - Ghana (%)
Place of birth for the foreign-born population - Liberia (%)
Place of birth for the foreign-born population - Nigeria (%)
Place of birth for the foreign-born population - Senegal (%)
Place of birth for the foreign-born population - Sierra Leone (%)
Place of birth for the foreign-born population - Other Western Africa (%)
Place of birth for the foreign-born population - Australia (%)
Place of birth for the foreign-born population - New Zealand (%)
Place of birth for the foreign-born population - Fiji (%)
Place of birth for the foreign-born population - Micronesia (%)
Place of birth for the foreign-born population - Bahamas (%)
Place of birth for the foreign-born population - Barbados (%)
Place of birth for the foreign-born population - Cuba (%)
Place of birth for the foreign-born population - Dominica (%)
Place of birth for the foreign-born population - Dominican Republic (%)
Place of birth for the foreign-born population - Grenada (%)
Place of birth for the foreign-born population - Haiti (%)
Place of birth for the foreign-born population - Jamaica (%)
Place of birth for the foreign-born population - St. Vincent and the Grenadines (%)
Place of birth for the foreign-born population - Trinidad and Tobago (%)
Place of birth for the foreign-born population - West Indies (%)
Place of birth for the foreign-born population - Other Caribbean (%)
Place of birth for the foreign-born population - Belize (%)
Place of birth for the foreign-born population - Costa Rica (%)
Place of birth for the foreign-born population - El Salvador (%)
Place of birth for the foreign-born population - Guatemala (%)
Place of birth for the foreign-born population - Honduras (%)
Place of birth for the foreign-born population - Mexico (%)
Place of birth for the foreign-born population - Nicaragua (%)
Place of birth for the foreign-born population - Panama (%)
Place of birth for the foreign-born population - Other Central America (%)
Place of birth for the foreign-born population - Argentina (%)
Place of birth for the foreign-born population - Bolivia (%)
Place of birth for the foreign-born population - Brazil (%)
Place of birth for the foreign-born population - Chile (%)
Place of birth for the foreign-born population - Colombia (%)
Place of birth for the foreign-born population - Ecuador (%)
Place of birth for the foreign-born population - Guyana (%)
Place of birth for the foreign-born population - Peru (%)
Place of birth for the foreign-born population - Uruguay (%)
Place of birth for the foreign-born population - Venezuela (%)
Place of birth for the foreign-born population - Other South America (%)
Place of birth for the foreign-born population - Canada (%)
Place of birth for the foreign-born population - Other Northern America (%)
Place of birth for the foreign-born population - Other (%)
Latest news about races in Triangle, VA collected exclusively by city-data.com from local newspapers, TV, and radio stations
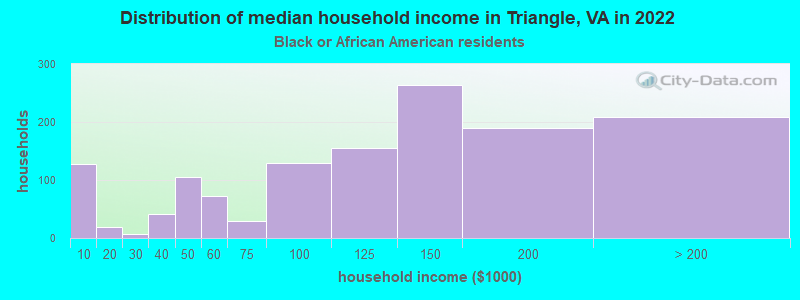
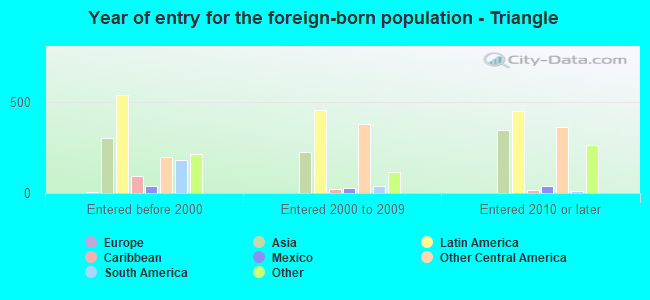
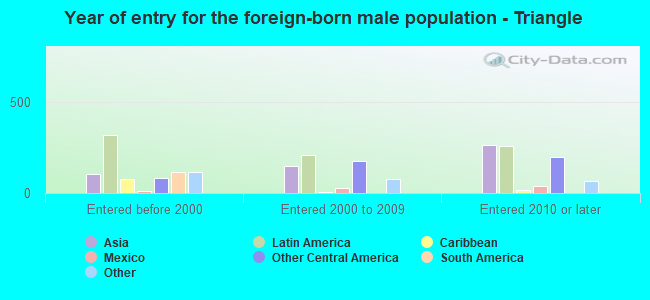
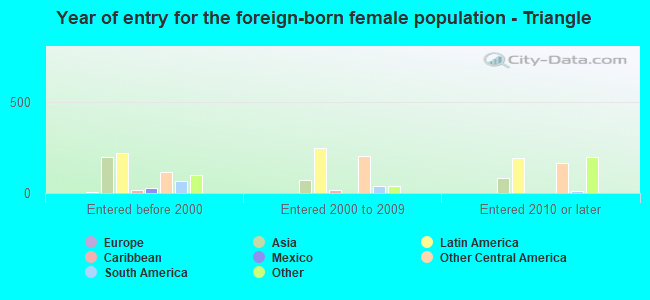
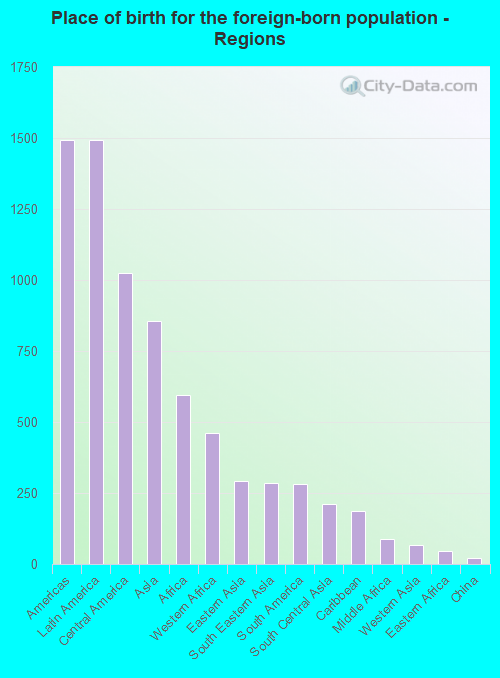
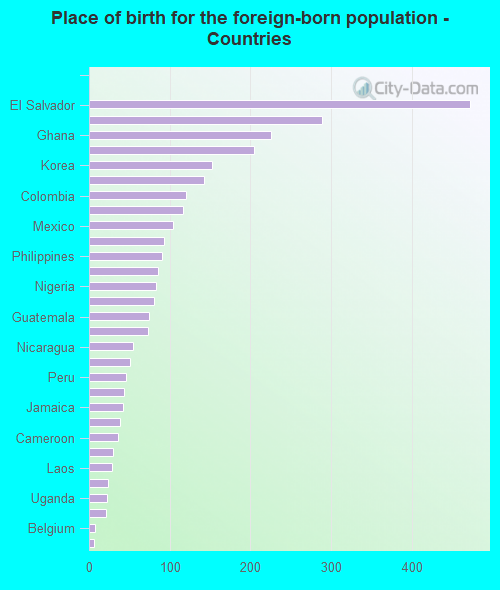
According to 2022 data, the most numerous races in Triangle, VA are White alone (2,476 residents), Black alone (3,956 residents), and Hispanic (2,497 residents). 59.8% of Triangle residents speak English at home. 26.8% of Triangle, VA residents are foreign-born (13.5% born in Latin America, 7.8% born in Asia, 5.4% born in Africa), which is 55.3% greater than the foreign-born rate of 12.0% across the entire state of Virginia.
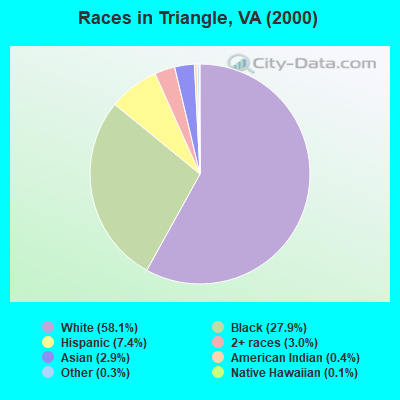
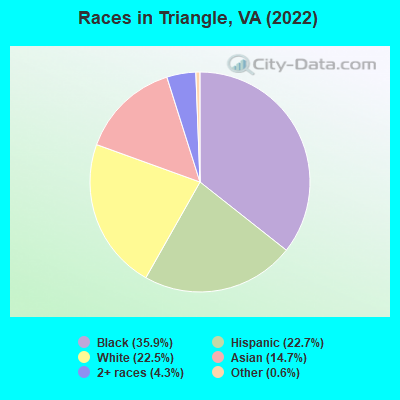
Race distribution in Triangle
2000 2022
4,965,637 70.2% White alone 1,376,378 19.4% Black alone 329,540 4.7% Hispanic 259,277 3.7% Asian alone 114,022 1.6% Two or more races 18,596 0.3% American Indian alone 11,685 0.2% Other race alone 3,380 0.05% Native Hawaiian and Other
5,095,130 58.7% White alone 1,594,785 18.4% Black alone 905,750 10.4% Hispanic 602,881 6.9% Asian alone 406,047 4.7% Two or more races 60,419 0.7% Other race alone 11,738 0.1% American Indian alone 6,869 0.08% Native Hawaiian and Other
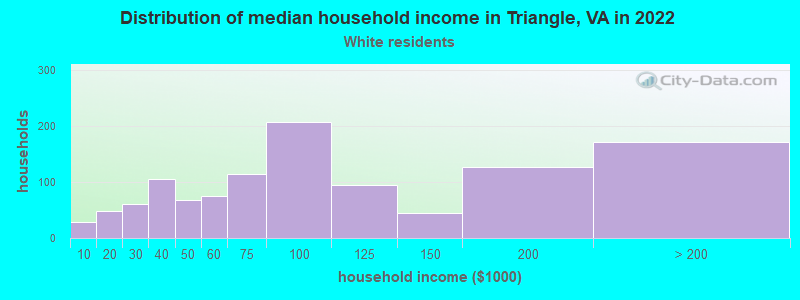
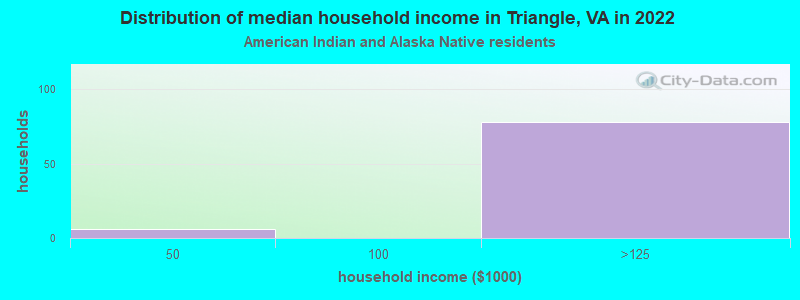
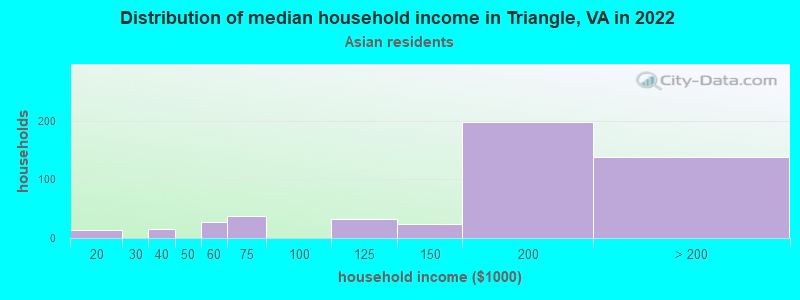
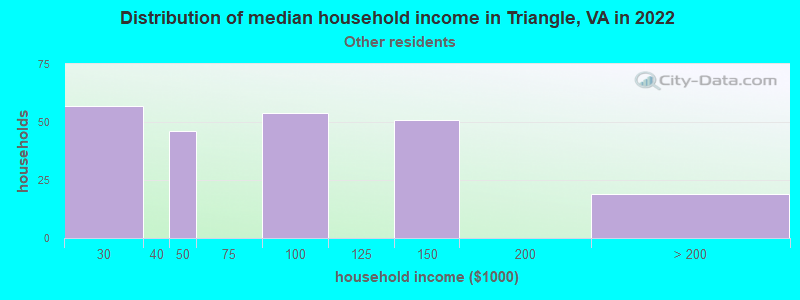
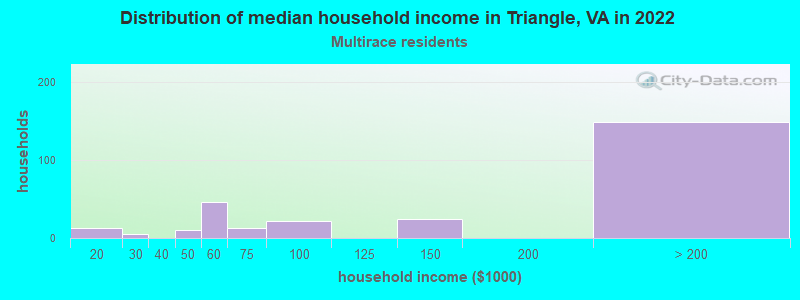
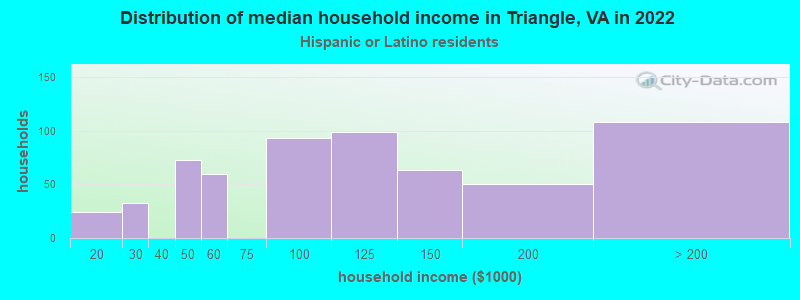
Income and house value in Triangle Median household income in 2022 $88,347 White non-Hispanic householders$122,782 Black householders$106,391 American Indian and Alaska Native householdersover $200,000 Asian householders$82,381 Some other race householders$97,071 Hispanic or Latino race householdersMedian 2022 house value $559,371 White Non-Hispanic householders$631,642 Black or African American householders $678,848 Asian householders$492,531 Two or more races householders
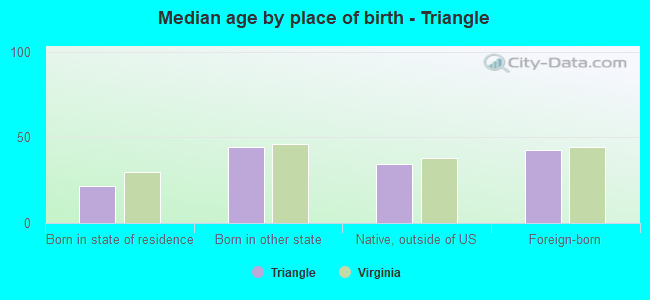
Median age by race in Triangle
34.7 Median age for White residents36.2 33.8 42.1 Median age for Black or African American residents37.9 43.1 29.7 Median age for American Indian / Alaska Native residents30.4 -670,886,075.3 34.6 Median age for Asian residents21.9 41.8 -611,955,419.9 Median age for Native Hawaiian / Pacific Islander residents-541,531,822.5 -714,150,046.8 29.2 Median age for Other race residents19.4 32.1 25.9 Median age for Two or more races residents26.1 25.4 35.8 Median age for White alone residents36.8 34.3 29.3 Median age for Hispanic or Latino residents29.2 29.1
Owner/renter occupied households by race in Triangle
House owners and renters - White residents 540 49.2% Owner occupied557 50.8% Renter occupiedHouse owners and renters - Black or African American residents 939 71.1% Owner occupied381 28.9% Renter occupiedHouse owners and renters - American Indian / Alaska Native residents 43 46.1% Owner occupied50 53.9% Renter occupiedHouse owners and renters - Asian residents 391 88.8% Owner occupied49 11.2% Renter occupiedHouse owners and renters - Other race residents 163 65.7% Owner occupied85 34.3% Renter occupiedHouse owners and renters - Two or more races residents 259 87.4% Owner occupied37 12.6% Renter occupiedHouse owners and renters - White alone residents 487 46.0% Owner occupied572 54.0% Renter occupiedHouse owners and renters - Hispanic or Latino residents 429 68.0% Owner occupied202 32.0% Renter occupied
Language usage in Triangle
English speakers - Total 59.8% of residents of Triangle speak English at home.
19.6% of residents speak Spanish at home 1,240 62.4% Speak English very well746 37.6% Speak English less than very well20.6% of residents speak other language at home 1,588 76.0% Speak English very well501 24.0% Speak English less than very well
English speakers - Born in the United States 90.2% of residents of Triangle speak English at home.
6.7% of residents speak Spanish at home 241 100.0% Speak English very well2.9% of residents speak other language at home 55 52.4% Speak English very well50 47.6% Speak English less than very well
English speakers - Native, born elsewhere 53.6% of residents of Triangle speak English at home.
32.6% of residents speak Spanish at home 94 59.9% Speak English very well63 40.1% Speak English less than very well10.0% of residents speak other language at home 48 100.0% Speak English very well
English speakers - Foreign-born 12.7% of residents of Triangle speak English at home.
40.4% of residents speak Spanish at home 507 45.9% Speak English very well597 54.1% Speak English less than very well46.0% of residents speak other language at home 906 72.0% Speak English very well353 28.0% Speak English less than very well
White (Caucasian) - Speak another language Native:
6.1% (137)Foreign-born:
98.6% (261)
Black or African American - Speak only English Native:
91.7% (2,835)Foreign-born:
19.8% (147)
Black or African American - Speak another language Native:
8.5% (264)Foreign-born:
75.6% (561)
American Indian / Alaska Native - Speak only English Native:
25.7% (40)Foreign-born:
11.0% (17)
American Indian / Alaska Native - Speak another language Native:
70.2% (108)Foreign-born:
75.1% (119)
Asian - Speak only English Native:
25.9% (208)Foreign-born:
5.9% (40)
Asian - Speak another language Native:
78.4% (629)Foreign-born:
94.2% (632)
Other race - Speak only English Native:
14.1% (35)Foreign-born:
3.2% (16)
Other race - Speak another language Native:
86.1% (211)Foreign-born:
94.9% (470)
Two or more races - Speak only English Native:
49.5% (521)Foreign-born:
19.1% (90)
Two or more races - Speak another language Native:
57.2% (603)Foreign-born:
81.8% (385)
White alone - Speak another language Native:
1.5% (32)Foreign-born:
100.0% (75)
Hispanic or Latino - Speak only English Native:
26.9% (296)Foreign-born:
8.5% (100)
Hispanic or Latino - Speak another language Native:
72.3% (794)Foreign-born:
91.5% (1,073)
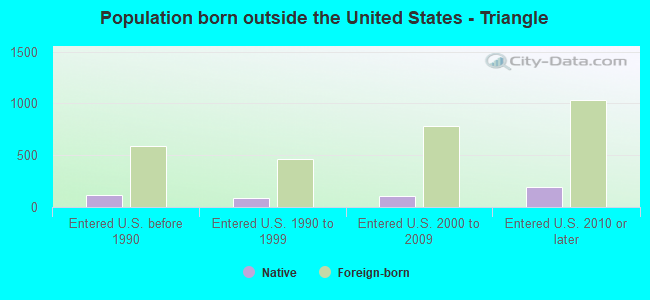
Foreign-born residents in Triangle 2,955 residents are foreign born (13.5% Latin America , 7.8% Asia , 5.4% Africa ).
This city:
26.8%Virginia:
12.6%
Marital status for residents in Triangle Marital status - White (Caucasian) population 15 years and over
Males 29.5% Never married51.9% Now married2.7% Separated0.0% Widowed15.9% DivorcedFemales 27.8% Never married59.9% Now married0.6% Separated3.4% Widowed8.3% DivorcedWomen who gave birth in the past 12 months Now married:
100.0% (39)Unmarried:
0.0% (0)
Women who did not give birth in the past 12 months Now married:
55.0% (368)Unmarried:
45.0% (301)
Marital status - Black or African American population 15 years and over
Males 41.8% Never married50.2% Now married1.0% Separated1.4% Widowed5.6% DivorcedFemales 31.6% Never married51.3% Now married3.4% Separated4.9% Widowed8.9% DivorcedWomen who gave birth in the past 12 months Now married:
100.0% (28)Unmarried:
0.0% (0)
Women who did not give birth in the past 12 months Now married:
35.8% (270)Unmarried:
64.2% (483)
Marital status - American Indian / Alaska Native population 15 years and over
Males 79.9% Never married0.0% Now married20.1% Separated0.0% Widowed0.0% DivorcedFemales 48.8% Never married0.0% Now married51.2% Separated0.0% Widowed0.0% DivorcedWomen who did not give birth in the past 12 months Now married:
0.0% (0)Unmarried:
100.0% (43)
Marital status - Asian population 15 years and over
Males 37.9% Never married62.1% Now married0.0% Separated0.0% Widowed0.0% DivorcedFemales 16.7% Never married58.8% Now married5.9% Separated0.0% Widowed18.6% DivorcedWomen who did not give birth in the past 12 months Now married:
61.9% (406)Unmarried:
38.1% (250)
Marital status - Other race population 15 years and over
Males 47.9% Never married38.2% Now married0.0% Separated0.0% Widowed13.9% DivorcedFemales 41.2% Never married58.8% Now married0.0% Separated0.0% Widowed0.0% DivorcedWomen who did not give birth in the past 12 months Now married:
50.6% (112)Unmarried:
49.4% (109)
Marital status - Two or more races population 15 years and over
Males 35.5% Never married64.5% Now married0.0% Separated0.0% Widowed0.0% DivorcedFemales 47.8% Never married48.3% Now married0.0% Separated0.0% Widowed3.9% DivorcedWomen who gave birth in the past 12 months Now married:
0.0% (0)Unmarried:
100.0% (71)
Women who did not give birth in the past 12 months Now married:
38.8% (133)Unmarried:
61.2% (210)
Marital status - White alone, not Hispanic / Latino population 15 years and over
Males 28.8% Never married49.2% Now married3.2% Separated0.0% Widowed18.8% DivorcedFemales 19.1% Never married65.5% Now married0.8% Separated4.6% Widowed9.9% DivorcedWomen who gave birth in the past 12 months Now married:
100.0% (10)Unmarried:
0.0% (0)
Women who did not give birth in the past 12 months Now married:
66.4% (345)Unmarried:
33.6% (174)
Marital status - Hispanic or Latino population 15 years and over
Males 42.4% Never married50.2% Now married3.6% Separated0.0% Widowed3.8% DivorcedFemales 48.6% Never married44.9% Now married5.0% Separated0.0% Widowed1.5% DivorcedWomen who gave birth in the past 12 months Now married:
44.0% (38)Unmarried:
56.0% (49)
Women who did not give birth in the past 12 months Now married:
32.9% (192)Unmarried:
67.1% (392)
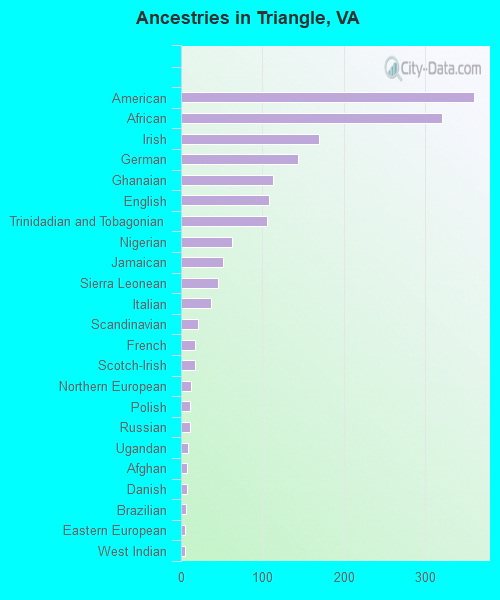
Ancestries in Triangle
360 7.1% American320 6.3% African169 3.3% Irish143 2.8% German113 2.2% Ghanaian108 2.1% English106 2.1% Trinidadian and Tobagonian62 1.2% Nigerian51 1.0% Jamaican45 0.9% Sierra Leonean37 0.7% Italian21 0.4% Scandinavian17 0.3% French17 0.3% Scotch-Irish12 0.2% Northern European11 0.2% Polish11 0.2% Russian9 0.2% Ugandan7 0.1% Afghan7 0.1% Danish6 0.1% Brazilian5 0.10% Eastern European5 0.10% West Indian2 0.04% Norwegian
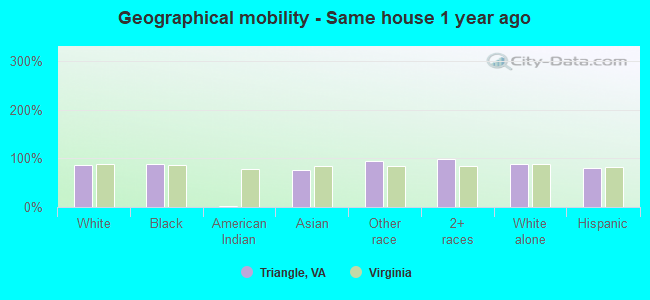
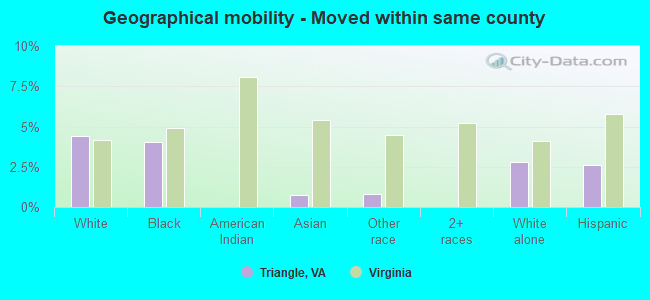
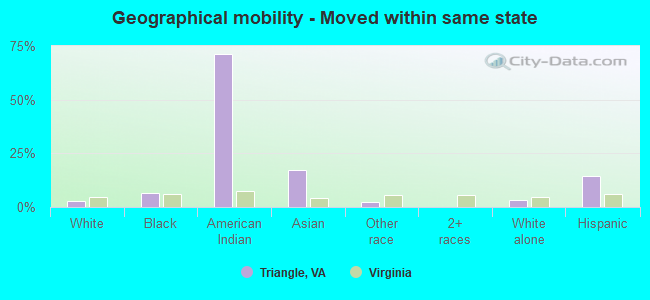
Geographical mobility in Triangle Same house 1 year ago 2,399 86.3% White (Caucasian)3,556 89.0% Black or African American8 2.9% American Indian / Alaska Native1,242 75.9% Asian868 95.4% Other race1,519 98.5% Two or more races2,181 89.1% White alone, not Hispanic / Latino1,984 80.7% Hispanic or LatinoMoved within same county 122 4.4% White / Caucasian162 4.1% Black or African American12 0.7% Asian7 0.8% Other race68 2.8% White alone, not Hispanic / Latino64 2.6% Hispanic or LatinoMoved within same state 77 2.8% White / Caucasian263 6.6% Black or African American207 71.3% American Indian / Alaska Native283 17.3% Asian23 2.5% Other race77 3.1% White alone, not Hispanic / Latino360 14.6% Hispanic or LatinoMoved from different state 191 6.9% White / Caucasian28 0.7% Black or African American56 19.3% American Indian / Alaska Native16 1.0% Two or more races121 4.9% White alone, not Hispanic / Latino160 6.5% Hispanic or LatinoMoved from abroad 12 0.3% Black or African American
Children Nativity (place of birth) in Triangle
Children under 6 years - Living with two parents Both parents native 415 99.5% Native2 0.5% Foreign-bornBoth parents foreign-born 119 51.7% Native111 48.3% Foreign-bornOne native, one foreign-born parent 209 100.0% NativeChildren under 6 years - Living with one parent Native parent 62 100.0% NativeForeign-born parent 35 48.0% Native38 52.0% Foreign-bornChildren 6 to 17 years - Living with two parents Both parents native 590 100.0% NativeBoth parents foreign-born 293 77.7% Native84 22.3% Foreign-bornOne native, one foreign-born parent 205 100.0% NativeChildren 6 to 17 years - Living with one parent Native parent 220 100.0% NativeForeign-born parent 314 53.3% Native275 46.7% Foreign-born
Grandparents responsible for own grandchildren in Triangle
Grandparents (30 to 59 years) Black or African American 60 100.0% Responsible for grandchildrenGrandparents (60 years and over) Black or African American 156 89.3% Responsible for grandchildren19 10.7% Not responsible for grandchildren