Estimated zip code population in 2022: 11,904 Zip code population in 2010: 8,699 Zip code population in 2000: 5,967
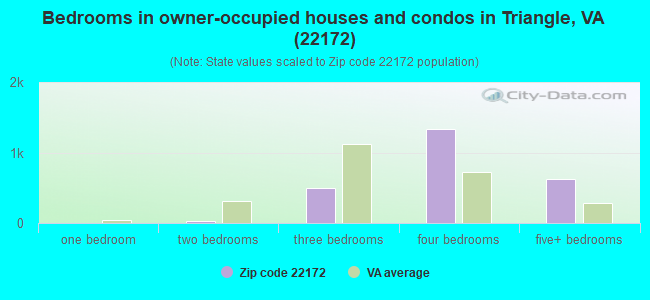
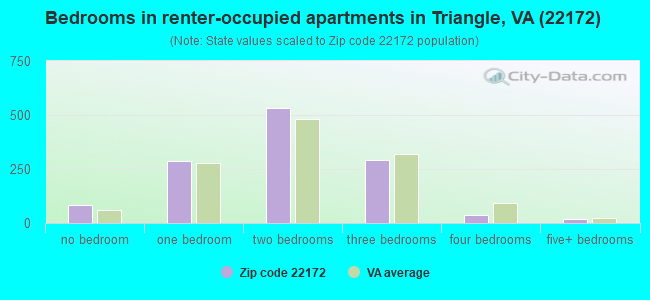
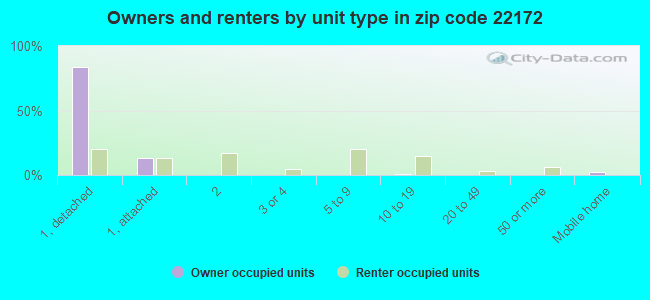
Houses and condos: 3,952 Renter-occupied apartments: 1,246
% of renters here:
34%
State:
33%
March 2022 cost of living index in zip code 22172: 162.1 (very high, U.S. average is 100)
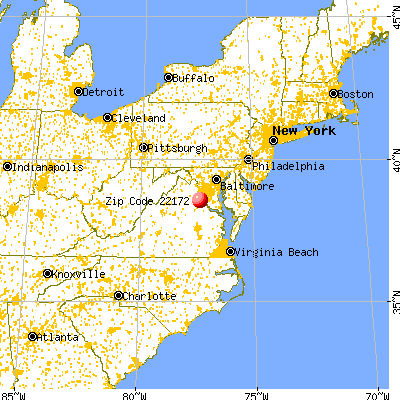
Land area: 12.6 sq. mi. Water area: 0.2 sq. mi.
Population density: 943 people per square mile
(low).
OSM Map
General Map
Google Map
MSN Map
OSM Map
General Map
Google Map
MSN Map
OSM Map
General Map
Google Map
MSN Map
OSM Map
General Map
Google Map
MSN Map
Please wait while loading the map...
Real estate property taxes paid for housing units in 2022:
This zip code:
0.9% ($4,591)
Virginia:
0.7% ($2,617)
Median real estate property taxes paid for housing units with mortgages in 2022: $4,744 (0.9%) Median real estate property taxes paid for housing units with no mortgage in 2022: $3,421 (0.9%)
Business Search- 14 Million verified businesses
Males: 6,432
(54.0%)
Females: 5,471
(46.0%)
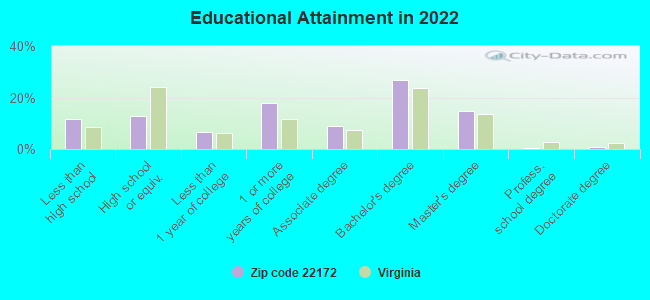
For population 25 years and over in 22172:
High school or higher: 88.4%
Bachelor's degree or higher: 42.7%
Graduate or professional degree: 16.0%
Unemployed: 7.6%
Mean travel time to work (commute): 36.7 minutes
For population 15 years and over in 22172:
Never married: 35.9%
Now married: 51.2%
Separated: 2.3%
Widowed: 1.6%
Divorced: 9.0%
Zip code 22172 compared to state average:
Unemployed percentage above state average.
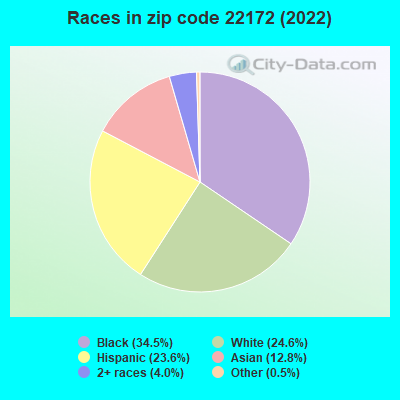
Black race population percentage above state average.
Hispanic race population percentage above state average.
Median age below state average.
Foreign-born population percentage above state average.
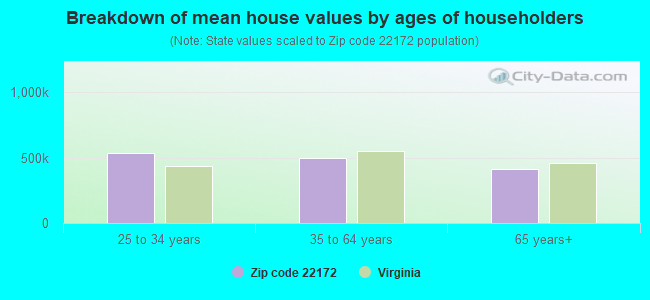
Estimated median house/condo value in 2022: $515,510
22172:
$515,510
Virginia:
$365,700
According to our research of Virginia and other state lists, there were 28 registered sex offenders living in 22172 zip code as of April 26, 2024. The ratio of all residents to sex offenders in zip code 22172 is 352 to 1. The ratio of registered sex offenders to all residents in this zip code is near the state average.
Median resident age:
This zip code:
34.2 years
Virginia median age:
39.0 years
Average household size:
This zip code:
3.2 people
Virginia:
2.5 people
Averages for the 2020 tax year for zip code 22172, filed in 2021:
Average Adjusted Gross Income (AGI) in 2020: $62,750 (Individual Income Tax Returns)
Here:
$62,750
State:
$86,446
Salary/wage: $59,568 (reported on 85.7% of returns)
Here:
$59,568
State:
$71,185
(% of AGI for various income ranges: 1188.3% for AGIs below $25k, 3699.3% for AGIs $25k-50k, 6949.0% for AGIs $50k-75k, 10769.6% for AGIs $75k-100k, 18924.2% for AGIs $100k-200k, 71978.6% for AGIs over 200k)
Taxable interest for individuals: $701 (reported on 18.3% of returns)
This zip code:
$701
Virginia:
$1,805
(% of AGI for various income ranges: 3.1% for AGIs below $25k, 6.0% for AGIs $25k-50k, 11.3% for AGIs $50k-75k, 17.9% for AGIs $75k-100k, 59.6% for AGIs $100k-200k, 224.3% for AGIs over 200k)
Ordinary dividends: $1,958 (reported on 10.1% of returns)
Here:
$1,958
State:
$8,327
(% of AGI for various income ranges: 2.8% for AGIs below $25k, 4.4% for AGIs $25k-50k, 20.8% for AGIs $50k-75k, 38.2% for AGIs $75k-100k, 97.4% for AGIs $100k-200k, 357.1% for AGIs over 200k)
Net capital gain/loss in AGI: +$7,876 (reported on 9.5% of returns)
Here:
+$7,876
State:
+$24,644
(% of AGI for various income ranges: 3.4% for AGIs below $25k, 14.0% for AGIs $25k-50k, 25.8% for AGIs $50k-75k, 104.3% for AGIs $75k-100k, 304.0% for AGIs $100k-200k, 2555.7% for AGIs over 200k)
Profit/loss from business: +$3,993 (reported on 23.2% of returns)
Here:
+$3,993
State:
+$12,836
(% of AGI for various income ranges: 191.9% for AGIs below $25k, 78.6% for AGIs $25k-50k, 92.7% for AGIs $50k-75k, 14.2% for AGIs $100k-200k, 1367.1% for AGIs over 200k)
Taxable individual retirement arrangement distribution: $16,427 (reported on 2.9% of returns)
22172:
$16,427
Virginia:
$21,535
(% of AGI for various income ranges: 9.0% for AGIs below $25k, 16.8% for AGIs $25k-50k, 61.3% for AGIs $50k-75k, 367.2% for AGIs $100k-200k)
Total itemized deductions: $31,139 (reported on 18.1% of returns)
Here:
$31,139
State:
$33,287
(% of AGI for various income ranges: 35.5% for AGIs below $25k, 209.6% for AGIs $25k-50k, 721.0% for AGIs $50k-75k, 1235.7% for AGIs $75k-100k, 2529.2% for AGIs $100k-200k, 9862.9% for AGIs over 200k)
Charity contributions: $10,058 (reported on 14.6% of returns)
Here:
$10,058
State:
$10,381
(% of AGI for various income ranges: 38.5% for AGIs $25k-50k, 163.5% for AGIs $50k-75k, 265.0% for AGIs $75k-100k, 627.6% for AGIs $100k-200k, 3691.4% for AGIs over 200k)
Taxes paid: $8,129 (reported on 18.1% of returns)
22172:
$8,129
State:
$8,284
(% of AGI for various income ranges: 6.3% for AGIs below $25k, 44.6% for AGIs $25k-50k, 167.9% for AGIs $50k-75k, 344.3% for AGIs $75k-100k, 756.2% for AGIs $100k-200k, 2172.9% for AGIs over 200k)
Earned income credit: $2,447 (reported on 19.0% of returns)
Here:
$2,447
State:
$2,214
(% of AGI for various income ranges: 117.8% for AGIs below $25k, 77.6% for AGIs $25k-50k)
Percentage of individuals using paid preparers for their 2020 taxes: 90.3%
Here:
90%
State:
92%
(% for various income ranges: 88.8% for AGIs below $25k, 91.0% for AGIs $25k-50k, 91.0% for AGIs $50k-75k, 90.0% for AGIs $75k-100k, 91.6% for AGIs $100k-200k, 91.7% for AGIs over 200k)
Averages for the 2012 tax year for zip code 22172, filed in 2013:
Average Adjusted Gross Income (AGI) in 2012: $59,474 (Individual Income Tax Returns)
Here:
$59,474
State:
$71,192
Salary/wage: $55,418 (reported on 91.4% of returns)
Here:
$55,418
State:
$59,229
(% of AGI for various income ranges: 84.1% for AGIs below $25k, 90.8% for AGIs $25k-50k, 89.2% for AGIs $50k-75k, 88.4% for AGIs $75k-100k, 85.7% for AGIs $100k-200k, 74.5% for AGIs over 200k)
Taxable interest for individuals: $576 (reported on 23.6% of returns)
This zip code:
$576
Virginia:
$1,600
(% of AGI for various income ranges: 0.2% for AGIs below $25k, 0.1% for AGIs $25k-50k, 0.2% for AGIs $50k-75k, 0.1% for AGIs $75k-100k, 0.3% for AGIs $100k-200k, 0.2% for AGIs over 200k)
Ordinary dividends: $2,062 (reported on 11.6% of returns)
Here:
$2,062
State:
$6,959
(% of AGI for various income ranges: 0.2% for AGIs below $25k, 0.3% for AGIs $50k-75k, 0.2% for AGIs $75k-100k, 0.4% for AGIs $100k-200k, 0.9% for AGIs over 200k)
Net capital gain/loss in AGI: +$1,452 (reported on 7.6% of returns)
Here:
+$1,452
State:
+$16,672
(% of AGI for various income ranges: 0.2% for AGIs $50k-75k, 0.3% for AGIs $100k-200k, 0.5% for AGIs over 200k)
Profit/loss from business: +$5,554 (reported on 15.0% of returns)
Here:
+$5,554
State:
+$14,116
(% of AGI for various income ranges: 9.4% for AGIs below $25k, 1.3% for AGIs $25k-50k, 0.3% for AGIs $50k-75k, 1.0% for AGIs $75k-100k, 0.4% for AGIs $100k-200k, 1.1% for AGIs over 200k)
Taxable individual retirement arrangement distribution: $14,872 (reported on 4.2% of returns)
22172:
$14,872
Virginia:
$16,667
(% of AGI for various income ranges: 0.7% for AGIs $25k-50k, 0.9% for AGIs $50k-75k, 1.4% for AGIs $75k-100k, 1.7% for AGIs $100k-200k)
Total itemized deductions: $27,428 (25% of AGI, reported on 38.7% of returns)
Here:
$27,428
State:
$26,596
Here:
25.2% of AGI
State:
20.1% of AGI
(% of AGI for various income ranges: 5.2% for AGIs below $25k, 11.0% for AGIs $25k-50k, 18.5% for AGIs $50k-75k, 21.7% for AGIs $75k-100k, 21.2% for AGIs $100k-200k, 18.8% for AGIs over 200k)
Charity contributions: $4,287 (reported on 31.0% of returns)
Here:
$4,287
State:
$4,443
(% of AGI for various income ranges: 0.4% for AGIs below $25k, 1.2% for AGIs $25k-50k, 2.4% for AGIs $50k-75k, 2.5% for AGIs $75k-100k, 2.8% for AGIs $100k-200k, 2.3% for AGIs over 200k)
Taxes paid: $8,684 (reported on 38.4% of returns)
22172:
$8,684
State:
$9,951
(% of AGI for various income ranges: 0.9% for AGIs below $25k, 2.1% for AGIs $25k-50k, 4.4% for AGIs $50k-75k, 6.5% for AGIs $75k-100k, 7.4% for AGIs $100k-200k, 7.0% for AGIs over 200k)
Earned income credit: $2,294 (reported on 20.6% of returns)
Here:
$2,294
State:
$2,211
(% of AGI for various income ranges: 7.7% for AGIs below $25k, 1.3% for AGIs $25k-50k)
Percentage of individuals using paid preparers for their 2012 taxes: 45.8%
Here:
46%
State:
46%
(% for various income ranges: 44.4% for AGIs below $25k, 44.4% for AGIs $25k-50k, 47.2% for AGIs $50k-75k, 51.5% for AGIs $75k-100k, 47.2% for AGIs $100k-200k, 46.7% for AGIs over 200k)
Averages for the 2004 tax year for zip code 22172, filed in 2005:
Average Adjusted Gross Income (AGI) in 2004: $40,209 (Individual Income Tax Returns)
Here:
$40,209
State:
$56,704
Salary/wage: $37,113 (reported on 91.0% of returns)
Here:
$37,113
State:
$48,441
(% of AGI for various income ranges: 105.4% for AGIs below $10k, 88.3% for AGIs $10k-25k, 88.7% for AGIs $25k-50k, 84.8% for AGIs $50k-75k, 85.5% for AGIs $75k-100k, 75.5% for AGIs over 100k)
Taxable interest for individuals: $851 (reported on 28.5% of returns)
This zip code:
$851
Virginia:
$1,688
(% of AGI for various income ranges: 1.2% for AGIs below $10k, 0.3% for AGIs $10k-25k, 0.5% for AGIs $25k-50k, 0.7% for AGIs $50k-75k, 0.6% for AGIs $75k-100k, 0.8% for AGIs over 100k)
Taxable dividends: $1,746 (reported on 11.6% of returns)
Here:
$1,746
State:
$4,028
(% of AGI for various income ranges: 0.4% for AGIs below $10k, 0.1% for AGIs $10k-25k, 0.2% for AGIs $25k-50k, 0.2% for AGIs $50k-75k, 0.2% for AGIs $75k-100k, 1.2% for AGIs over 100k)
Net capital gain/loss: +$11,847 (reported on 7.8% of returns)
Here:
+$11,847
State:
+$14,375
(% of AGI for various income ranges: 0.1% for AGIs $10k-25k, 0.6% for AGIs $25k-50k, 0.2% for AGIs $50k-75k, -0.0% for AGIs $75k-100k, 7.2% for AGIs over 100k)
Profit/loss from business: +$5,607 (reported on 10.9% of returns)
Here:
+$5,607
State:
+$13,342
(% of AGI for various income ranges: 2.7% for AGIs below $10k, 3.5% for AGIs $10k-25k, 1.1% for AGIs $25k-50k, 1.6% for AGIs $50k-75k, 0.4% for AGIs $75k-100k, 1.5% for AGIs over 100k)
IRA payment deduction: $2,278 (reported on 1.8% of returns)
22172:
$2,278
Virginia:
$2,943
Total itemized deductions: $19,823 (27% of AGI, reported on 33.2% of returns)
Here:
$19,823
State:
$21,492
Here:
26.9% of AGI
State:
21.0% of AGI
(% of AGI for various income ranges: 11.5% for AGIs below $10k, 7.1% for AGIs $10k-25k, 13.3% for AGIs $25k-50k, 19.6% for AGIs $50k-75k, 20.8% for AGIs $75k-100k, 19.1% for AGIs over 100k)
Charity contributions deductions: $3,072 (4% of AGI, reported on 27.2% of returns)
Here:
$3,072
State:
$3,794
Here:
4.0% of AGI
State:
3.5% of AGI
(% of AGI for various income ranges: 0.4% for AGIs below $10k, 0.7% for AGIs $10k-25k, 1.7% for AGIs $25k-50k, 1.9% for AGIs $50k-75k, 3.1% for AGIs $75k-100k, 2.7% for AGIs over 100k)
Total tax: $5,155 (reported on 70.3% of returns)
22172:
$5,155
State:
$9,537
(% of AGI for various income ranges: 2.0% for AGIs below $10k, 3.7% for AGIs $10k-25k, 6.4% for AGIs $25k-50k, 8.4% for AGIs $50k-75k, 9.2% for AGIs $75k-100k, 14.2% for AGIs over 100k)
Earned income credit: $1,865 (reported on 21.9% of returns)
Here:
$1,865
State:
$1,734
Percentage of individuals using paid preparers for their 2004 taxes: 54.6%
Here:
55%
State:
52%
(% for various income ranges: 47.2% for AGIs below $10k, 61.4% for AGIs $10k-25k, 54.4% for AGIs $25k-50k, 57.0% for AGIs $50k-75k, 50.3% for AGIs $75k-100k, 48.2% for AGIs over 100k)
Likely homosexual households (counted as self-reported same-sex unmarried-partner households)
Lesbian couples: 0.2% of all households
Gay men: 0.6% of all households
Household received Food Stamps/SNAP in the past 12 months: 127 Household did not receive Food Stamps/SNAP in the past 12 months: 3,555
Women who had a birth in the past 12 months: 130 (83 now married, 45 unmarried) Women who did not have a birth in the past 12 months: 2,982 (1,333 now married, 1,646 unmarried)
Housing units in zip code 22172 with a mortgage: 2,009 (122 second mortgage, 6 home equity loan, 99 both second mortgage and home equity loan) Houses without a mortgage: 32
Median monthly owner costs for units with a mortgage: $2,599 Median monthly owner costs for units without a mortgage: $655
Residents with income below the poverty level in 2022:
This zip code:
10.1%
Whole state:
10.6%
Residents with income below 50% of the poverty level in 2022:
This zip code:
4.5%
Whole state:
5.2%
Median number of rooms in houses and condos:
Here:
10.0
State:
7.0
Median number of rooms in apartments:
Here:
4.4
State:
4.3
Notable locations in this zip code not listed on our city pages
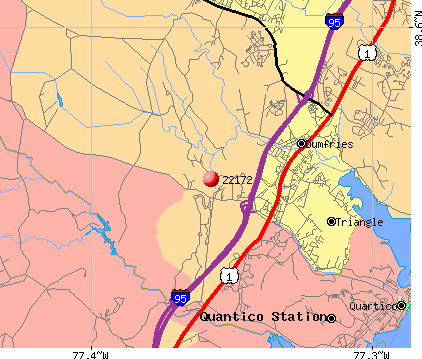
Notable locations in zip code 22172: Mawavi Camp Number 2 (A), Happyland Camp Number 5 (B), Goodwill Camp Number 3 (C), Turkey Run Ridge Campground (D), Forest Greens Golf Club (E), Dumfries-Triangle Rescue Squad (F), Dumfries - Triangle Volunteer Fire Department Station 503 (G). Display/hide their locations on the map
Churches in zip code 22172 include: Concordia Lutheran Church (A), Triangle Baptist Church (B), Saint Francis of Assisi Church (C), Star of Bethlehem Church (D), The Church of Saint Martin (E), Mount Zion Baptist Church (F). Display/hide their locations on the map
Parks in zip code 22172 include: Prince William Forest Park (1), Goodwill Historic District (2), Mawavi Historic District (3). Display/hide their locations on the map
2,087 married couples with children.
510 single-parent households (172 men, 338 women).
59.6% of residents of 22172 zip code speak English at home.
21.5% of residents speak Spanish at home (64% very well, 23% well, 14% not well).
8.5% of residents speak other Indo-European language at home (79% very well, 11% well, 10% not well, 1% not at all).
5.3% of residents speak Asian or Pacific Island language at home (63% very well, 33% well, 3% not well).
4.9% of residents speak other language at home (89% very well, 7% well, 4% not well).
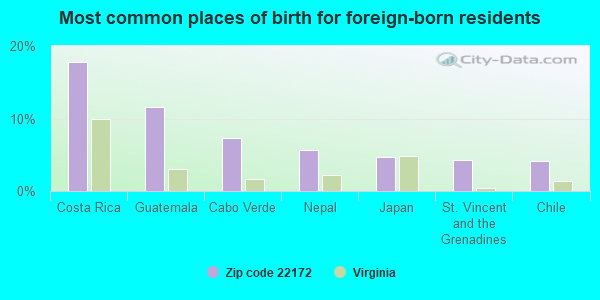
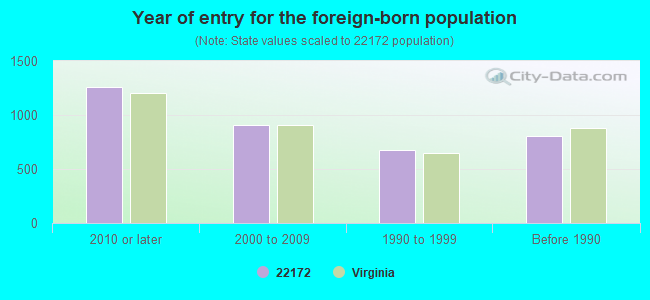
Foreign born population: 3,182 (26.7%) (63.2% of them are naturalized citizens)
This zip code:
26.7%
Whole state:
12.7%
18%Costa Rica
12%Guatemala
7%Cabo Verde
6%Nepal
5%Japan
4%St. Vincent and the Grenadines
4%Chile
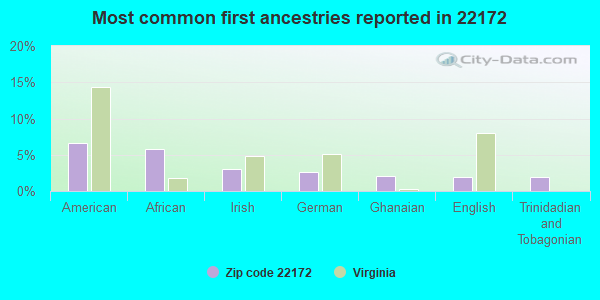
7%American
6%African
3%Irish
3%German
2%Ghanaian
2%English
2%Trinidadian and Tobagonian
Year of entry for the foreign-born population
1,2582010 or later
9092000 to 2009
6751990 to 1999
803Before 1990
Facilities with environmental interests located in this zip code:
7 ELEVEN 10757 (18750 FULLER HEIGHTS RD in TRIANGLE, VA)
Small Quantity Generators, between 100 kg and 1000 kg of hazardous waste/month (Resource Conservation and Recovery Act (tracking hazardous waste)) - notification Organizations: OPERNAME (CONTACT/OPERATOR)
, 7 ELEVEN INC (CONTACT/OWNER)
AIR KING, INC. (19122D FULLER HEIGHTS ROAD in TRIANGLE, VA)
AIR MINOR (AIRS/AFS) Business SIC classification: REFRIGERATION AND AIR-CONDITIONING SERVICE AND REPAIR SHOPS
AMOCO #1974-TANKS (18515 JEFFERSON DAIVS HWY in TRIANGLE, VA)
Small Quantity Generators, between 100 kg and 1000 kg of hazardous waste/month (Resource Conservation and Recovery Act (tracking hazardous waste)) - notification Organizations: OPERNAME (CONTACT/OPERATOR)
, AMOCO OIL COMPANY (CONTACT/OWNER)
BLACK WOLF INC TA QUANTICO SVC STA (18434 JEFF DAVIS HWY in TRIANGLE, VA)
Conditionally Exempt Small Quantity Generators, less than 100 kg/month of hazardous waste (Resource Conservation and Recovery Act (tracking hazardous waste)) - notification Organizations: BERRY CHRIS (CONTACT/OWNER)
, WATSON HARVEY (CONTACT/OWNER)
Housing units lacking complete plumbing facilities: 0.7% Housing units lacking complete kitchen facilities: 1.3%
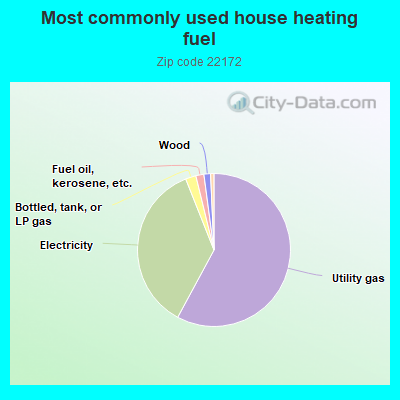
57.7%Utility gas
36.0%Electricity
2.2%Bottled, tank, or LP gas
1.7%Fuel oil, kerosene, etc.
1.4%Wood
0.7%No fuel used
Population in 1990: 5,181. Population change in the 1990s: +786 (+15.2%).
Place of birth for U.S.-born residents:
This state: 4,428
Northeast: 848
Midwest: 366
South: 1,932
West: 736
43% of the 22172 zip code residents lived in the same house 5 years ago. Out of people who lived in different houses, 43% lived in this county. Out of people who lived in different counties, 50% lived in Virginia.
87% of the 22172 zip code residents lived in the same house 1 year ago. Out of people who lived in different houses, 25% moved from this county. Out of people who lived in different houses, 56% moved from different county within same state. Out of people who lived in different houses, 17% moved from different state. Out of people who lived in different houses, 2% moved from abroad.
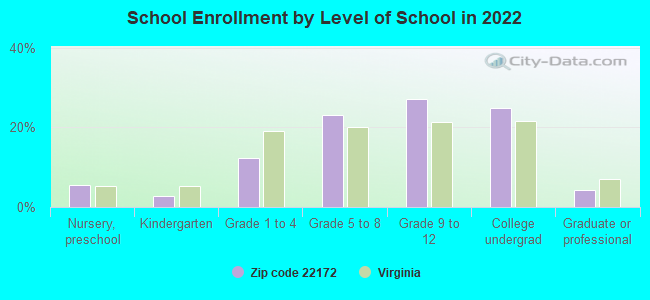
Private vs. public school enrollment:
Students in private schools in grades 1 to 8 (elementary and middle school): 173
Here:
15.2%
Virginia:
13.2%
Students in private schools in grades 9 to 12 (high school): 104
Here:
11.9%
Virginia:
10.2%
Students in private undergraduate colleges: 188
Here:
23.6%
Virginia:
18.7%
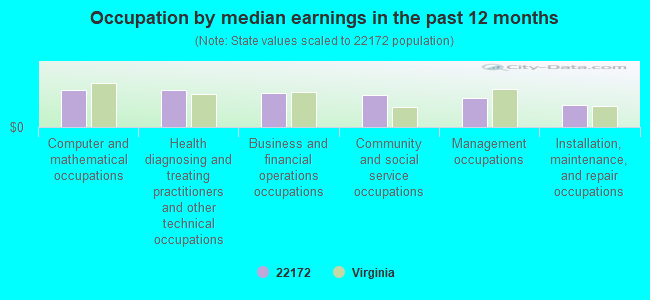
Occupation by median earnings in the past 12 months ($)
100,946Computer and mathematical occupations
100,560Health diagnosing and treating practitioners and other technical occupations
91,667Business and financial operations occupations
86,055Community and social service occupations
78,916Management occupations
59,801Installation, maintenance, and repair occupations
Companies with federal contracts located in this zip code (TRIANGLE, VA):
GT CONTRACTING CORPORATION (3106 HEMLOCK POINT COURT; small business) : $11,652,153 in 270 contractsfrom 1999 to 2006
Contracts for Maintenance, Repair or Alteration of Real Property -- Highways, Roads, Streets, Bridges, and Railways (includes resurfacing), Maintenance, Repair or Alteration of Real Property -- Other Utilities, Construction of Structures and Facilities -- Highways, Roads, Streets, Bridges, and Railways (includes resurfacing), Maintenance, Repair or Alteration of Real Property -- Other Administrative Facilities and Service Buildings, and moreby Army, Federal Highway Administration Signed by year:2000: $3,151,634; 2001: $3,066,545; 2002: $1,445,372; 2003: $1,582,574; 2004: $1,169,997; 2005: $867,822; 2006: $330,359.
Biggest contracts:
$82,917,710 with Army for Maintenance, Repair or Alteration of Real Property -- Highways, Roads, Streets, Bridges, and Railways (includes resurfacing). Signed on 2002-03-07. Completion date: 2002-07-22.
$2,628,737, same as above.Signed on 2005-03-31. Completion date: 2006-04-14.
$1,670,000 with Army for Maintenance, Repair or Alteration of Real Property -- Other Utilities. Signed on 2000-09-18. Completion date: 2001-09-17.
$996,000 with Federal Highway Administration for Construction of Structures and Facilities -- Highways, Roads, Streets, Bridges, and Railways (includes resurfacing). Signed on 2001-07-15. Completion date: 2001-11-15.
GROUP SEVEN ASSOCIATES LLC (3718 KATIE PL; small business) : $2,610,099 in 7 contractsfrom 2005 to 2006
Contracts for Other Professional Services, Contract, Procurement, and Acquisition Support Services, Other Administrative Support Services by Air Force, Washington Headquarters Services, Army, Office of Assistant Secretary for Health except national centers (disused code), and others Signed by year:2000: $0; 2001: $0; 2002: $0; 2003: $0; 2004: $0; 2005: $977,282; 2006: $1,632,817.
Biggest contracts:
$1,000,000 with Air Force for Other Professional Services. Taking place in DC. Signed on 2006-03-06. Completion date: 2007-04-05.
$620,100 with Washington Headquarters Services for Contract, Procurement, and Acquisition Support Services. Signed on 2005-12-22. Completion date: 2007-01-02.
$460,763 with Army for Other Administrative Support Services. Signed on 2006-02-03. Completion date: 2006-02-06.
$357,182, same as above.Signed on 2005-01-20. Completion date: 2006-02-06.
CAPITOL CONTRACTORS, INC. (18805 FULLER HEIGHTS ROAD; small business) : $925,260 in 23 contractsfrom 2000 to 2002
Contracts for Maintenance, Repair or Alteration of Real Property -- Other Non-Building Facilities, Maintenance, Repair or Alteration of Real Property -- Other Administrative Facilities and Service Buildings, Maintenance, Repair and Rebuilding of Equipment -- Miscellaneous, Maintenance, Repair or Alteration of Real Property -- Other Utilities by Navy Signed by year:2000: $559,898; 2001: $345,650; 2002: $19,712; 2003: $0; 2004: $0; 2005: $0; 2006: $0.
Biggest contracts:
$443,110 with Navy for Maintenance, Repair or Alteration of Real Property -- Other Non-Building Facilities. Signed on 2000-09-05. Completion date: 2001-06-07.
$186,716, same as above.Signed on 2001-05-18. Completion date: 2001-02-15.
$52,000 with Navy for Maintenance, Repair or Alteration of Real Property -- Other Administrative Facilities and Service Buildings. Signed on 2001-04-24. Completion date: 1999-02-08.
$49,000 with Navy for Maintenance, Repair or Alteration of Real Property -- Other Non-Building Facilities. Signed on 2001-01-03. Completion date: 2001-02-15.
TRAINING 911 INCORPORATED (3144 LOOKOUT POINT; small business)
$9,750 with Army for Other Professional Services. Signed on 2003-09-04. Completion date: 2003-10-09.
Top industries in this zip code by the number of employees in 2005:
Educational Services: Elementary and Secondary Schools (50-99 employees: 2 establishments)
Construction: Highway, Street, and Bridge Construction (50-99: 1)
Accommodation and Food Services: Limited-Service Restaurants (20-49: 2)
2008 - 2018 National Fire Incident Reporting System (NFIRS) incidents
According to the data from the years 2008 - 2018 the average number of fires per year is 14. The highest number of fires - 26 took place in 2010, and the least - 4 in 2015. The data has a rising trend.
When looking into fire subcategories, the most reports belonged to: Outside Fires (47.1%), and Structure Fires (36.9%).
Fire incident types reported to NFIRS in Zip Code 22172


 Nearest zip codes: 22025, 22134, 22026, 22193, 20112, 22191.


 According to the data from the years 2008 - 2018 the average number of fires per year is 14. The highest number of fires - 26 took place in 2010, and the least - 4 in 2015. The data has a rising trend.
 When looking into fire subcategories, the most reports belonged to: Outside Fires (47.1%), and Structure Fires (36.9%).