Races in Troy, Alabama (AL) Detailed Stats
Ancestries, Foreign-born residents, place of birth
Settings
X


Recent posts about races in Troy, Alabama on our local forum with over 2,400,000 registered users:
 | Best place to live near Troy (1 reply) |
| Birmingham suburbs vs mobile area suburbs? (17 replies) |
| Dome Stadium...... (402 replies) |
| Looking for suggestions in the HUntsville area (20 replies) |
| Troy, Alabama (20 replies) |
| Questions about Dothan (1 reply) |
Latest news about races in Troy, AL collected exclusively by city-data.com from local newspapers, TV, and radio stations
According to 2022 data, the most numerous races in Troy, AL are White alone (10,589 residents), Black alone (7,568 residents), and Hispanic (325 residents). 92.1% of Troy residents speak English at home. 5.6% of Troy, AL residents are foreign-born (4.7% born in Asia, 0.6% born in Europe), which is 46.2% greater than the foreign-born rate of 3.0% across the entire state of Alabama.
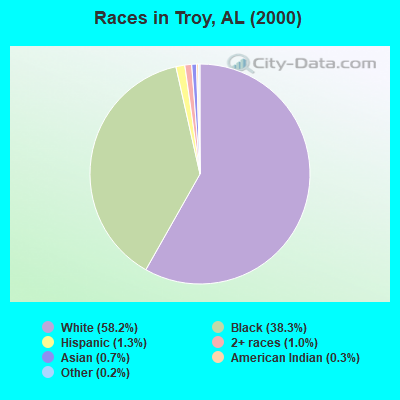
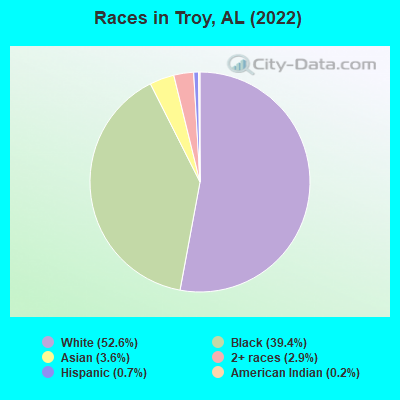
Race distribution in Troy
2000
2022

- 8,11058.2%White alone
- 5,34238.3%Black alone
- 1811.3%Hispanic
- 1451.0%Two or more races
- 960.7%Asian alone
- 360.3%American Indian alone
- 230.2%Other race alone
- 20.01%Native Hawaiian and Other
Pacific Islander alone
-
- 10,58953.4%White alone
- 7,56838.2%Black alone
- 7263.7%Asian alone
- 5953.0%Two or more races
- 3251.6%Hispanic
- 390.2%Other race alone
- 110.06%American Indian alone
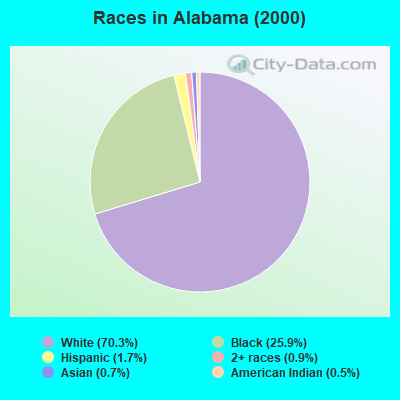
2000
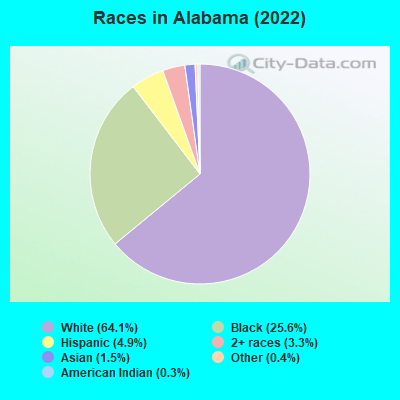
2022
-
- 3,125,81970.3%White alone
- 1,150,07625.9%Black alone
- 75,8301.7%Hispanic
- 39,0860.9%Two or more races
- 30,9890.7%Asian alone
- 21,6180.5%American Indian alone
- 2,6230.06%Other race alone
- 1,0590.02%Native Hawaiian and Other
Pacific Islander alone
-
- 3,250,18264.1%White alone
- 1,296,50025.6%Black alone
- 246,4774.9%Hispanic
- 169,8803.3%Two or more races
- 76,6821.5%Asian alone
- 19,9270.4%Other race alone
- 12,6940.3%American Indian alone
- 1,9540.04%Native Hawaiian and Other
Pacific Islander alone
Income and house value in Troy
- Median household income in 2022
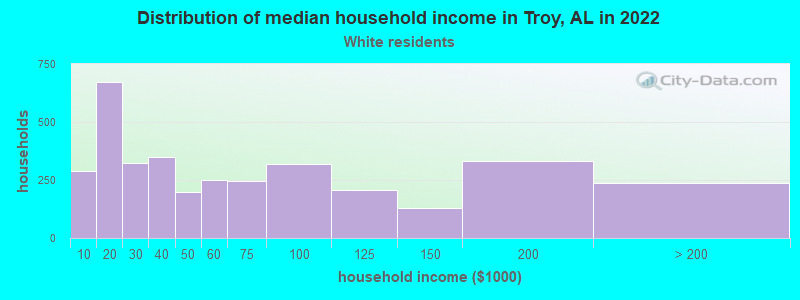
- $52,445White non-Hispanic householders
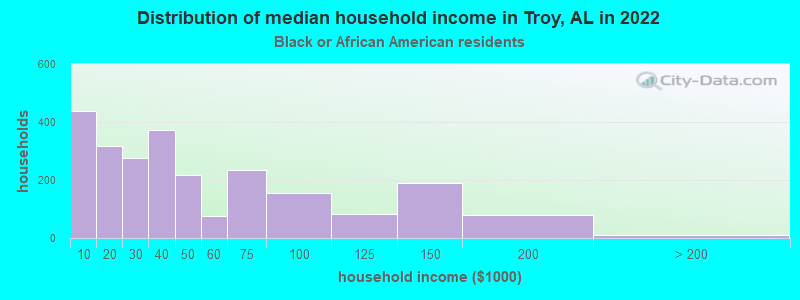
- $27,459Black householders
- $39,227American Indian and Alaska Native householders
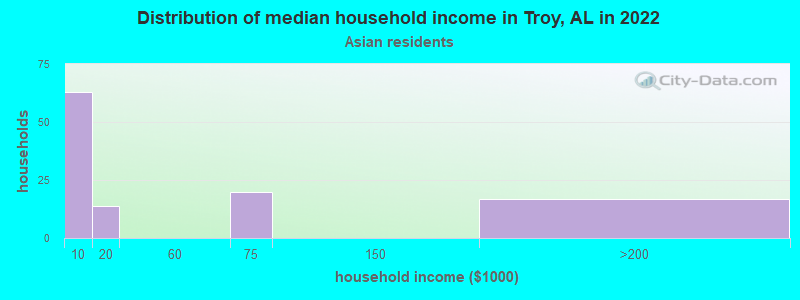
- $58,060Asian householders
- $43,951Some other race householders
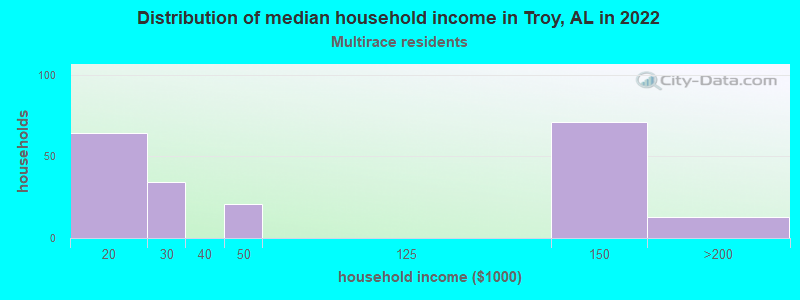
- $71,861Two or more races householders
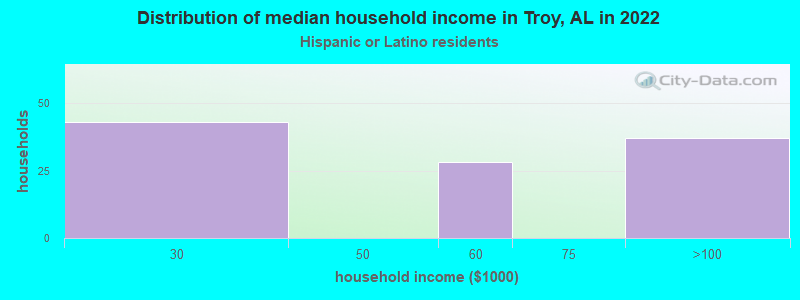
- $36,380Hispanic or Latino race householders
- Median 2022 house value
- $252,500White Non-Hispanic householders
- $124,416Black or African American householders
- $153,228American Indian or Alaska Native householders
- $360,153Asian householders
- $425,635Two or more races householders
- $470,163Hispanic or Latino householders
Household income for White non-Hispanic householders
Household income for Black householders
Household income for Asian householders
Household income for Two or more races householders
Household income for Hispanic or Latino race householders
Median age by race in Troy
- 27.3Median age for White residents
- 27.6Males
- 26.5Females
- 26.3Median age for Black or African American residents
- 27.9Males
- 26.2Females
- 22.2Median age for American Indian / Alaska Native residents
- 24.7Median age for Asian residents
- 26.5Males
- 24.4Females
- 26.3Median age for Other race residents
- 12.7Median age for Two or more races residents
- 51.3Males
- 11.8Females
- 27.1Median age for White alone residents
- 27.4Males
- 26.6Females
- 20.1Median age for Hispanic or Latino residents
- 25.4Males
- 20.0Females
Owner/renter occupied households by race in Troy
- House owners and renters - White residents
- 2,39862.3%Owner occupied
- 1,45037.7%Renter occupied
- House owners and renters - Black or African American residents
- 1,00134.8%Owner occupied
- 1,87765.2%Renter occupied
- House owners and renters - Asian residents
- 8738.6%Owner occupied
- 13861.4%Renter occupied
- House owners and renters - Other race residents
- 36100.0%Owner occupied
- House owners and renters - Two or more races residents
- 11052.6%Owner occupied
- 9947.4%Renter occupied
- House owners and renters - White alone residents
- 2,40963.6%Owner occupied
- 1,38036.4%Renter occupied
- House owners and renters - Hispanic or Latino residents
- 100100.0%Renter occupied
Language usage in Troy
- English speakers - Total
- 92.1% of residents of Troy speak English at home.
- 1.2% of residents speak Spanish at home
- 17177.7%Speak English very well
- 4922.3%Speak English less than very well
- 6.5% of residents speak other language at home
- 18915.6%Speak English very well
- 1,01984.4%Speak English less than very well
- English speakers - Born in the United States
- 92.2% of residents of Troy speak English at home.
- 3.3% of residents speak Spanish at home
- 121100.0%Speak English very well
- 3.9% of residents speak other language at home
- 5337.3%Speak English very well
- 8962.7%Speak English less than very well
- English speakers - Native, born elsewhere
- 65.7% of residents of Troy speak English at home.
- 28.4% of residents speak other language at home
- 29100.0%Speak English less than very well
- English speakers - Foreign-born
- 7.4% of residents of Troy speak English at home.
- 5.6% of residents speak Spanish at home
- 1625.0%Speak English very well
- 4875.0%Speak English less than very well
- 86.0% of residents speak other language at home
- 11711.9%Speak English very well
- 86688.1%Speak English less than very well
White (Caucasian) - Speak only English
| Native: | 98.7% (9,592) |
| Foreign-born: | 1.9% (10) |
White (Caucasian) - Speak another language
| Native: | 1.3% (130) |
| Foreign-born: | 92.7% (457) |
Asian - Speak only English
| Native: | 2.2% (5) |
| Foreign-born: | 13.2% (59) |
Asian - Speak another language
| Native: | 81.4% (170) |
| Foreign-born: | 86.7% (388) |
Two or more races - Speak another language
| Native: | 17.2% (113) |
| Foreign-born: | 100.0% (82) |
White alone - Speak only English
| Native: | 99.3% (9,540) |
| Foreign-born: | 1.7% (11) |
White alone - Speak another language
| Native: | 0.7% (68) |
| Foreign-born: | 100.0% (653) |
Hispanic or Latino - Speak another language
| Native: | 36.4% (111) |
| Foreign-born: | 100.0% (49) |
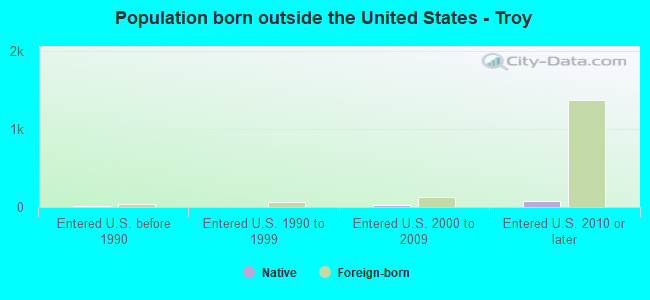
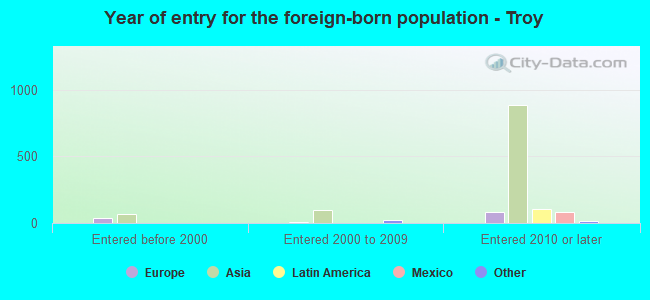
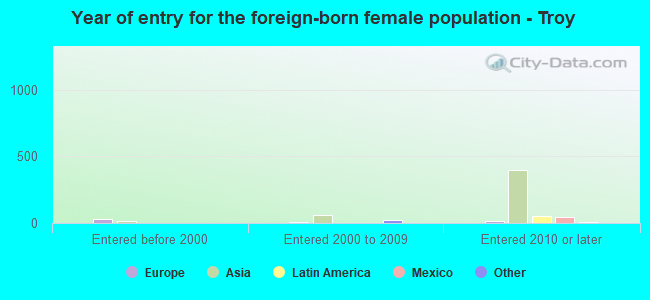
Foreign-born residents in Troy
1,106 residents are foreign born (4.7% Asia, 0.6% Europe).
| This city: | 5.6% |
| Alabama: | 100.0% |


Marital status for residents in Troy
Marital status - White (Caucasian) population 15 years and over
- Males
- 53.7%Never married
- 34.6%Now married
- 1.6%Separated
- 1.4%Widowed
- 8.7%Divorced
- Females
- 46.7%Never married
- 38.3%Now married
- 0.0%Separated
- 7.6%Widowed
- 7.4%Divorced
Women who gave birth in the past 12 months
| Now married: | 100.0% (20) |
| Unmarried: | 0.0% (0) |
Women who did not give birth in the past 12 months
| Now married: | 27.0% (827) |
| Unmarried: | 73.0% (2,235) |
Marital status - Black or African American population 15 years and over
- Males
- 49.4%Never married
- 29.4%Now married
- 1.0%Separated
- 2.5%Widowed
- 17.8%Divorced
- Females
- 71.8%Never married
- 14.9%Now married
- 0.6%Separated
- 6.2%Widowed
- 6.5%Divorced
Women who gave birth in the past 12 months
| Now married: | 20.4% (21) |
| Unmarried: | 79.6% (83) |
Women who did not give birth in the past 12 months
| Now married: | 8.1% (222) |
| Unmarried: | 91.9% (2,518) |
Marital status - American Indian / Alaska Native population 15 years and over
- Males
- 100.0%Never married
- 0.0%Now married
- 0.0%Separated
- 0.0%Widowed
- 0.0%Divorced
- Females
- 100.0%Never married
- 0.0%Now married
- 0.0%Separated
- 0.0%Widowed
- 0.0%Divorced
Women who did not give birth in the past 12 months
| Now married: | 0.0% (0) |
| Unmarried: | 100.0% (10) |
Marital status - Asian population 15 years and over
- Males
- 78.3%Never married
- 21.7%Now married
- 0.0%Separated
- 0.0%Widowed
- 0.0%Divorced
- Females
- 70.8%Never married
- 22.5%Now married
- 0.0%Separated
- 6.6%Widowed
- 0.0%Divorced
Women who gave birth in the past 12 months
| Now married: | 100.0% (34) |
| Unmarried: | 0.0% (0) |
Women who did not give birth in the past 12 months
| Now married: | 7.5% (18) |
| Unmarried: | 92.5% (220) |
Marital status - Two or more races population 15 years and over
- Males
- 40.7%Never married
- 41.5%Now married
- 0.0%Separated
- 0.0%Widowed
- 17.8%Divorced
- Females
- 75.4%Never married
- 24.6%Now married
- 0.0%Separated
- 0.0%Widowed
- 0.0%Divorced
Women who did not give birth in the past 12 months
| Now married: | 0.0% (0) |
| Unmarried: | 100.0% (100) |
Marital status - White alone, not Hispanic / Latino population 15 years and over
- Males
- 53.7%Never married
- 34.5%Now married
- 1.6%Separated
- 1.4%Widowed
- 8.8%Divorced
- Females
- 46.6%Never married
- 38.1%Now married
- 0.0%Separated
- 7.8%Widowed
- 7.6%Divorced
Women who gave birth in the past 12 months
| Now married: | 100.0% (20) |
| Unmarried: | 0.0% (0) |
Women who did not give birth in the past 12 months
| Now married: | 27.6% (833) |
| Unmarried: | 72.4% (2,190) |
Marital status - Hispanic or Latino population 15 years and over
- Males
- 39.6%Never married
- 60.4%Now married
- 0.0%Separated
- 0.0%Widowed
- 0.0%Divorced
- Females
- 53.0%Never married
- 47.0%Now married
- 0.0%Separated
- 0.0%Widowed
- 0.0%Divorced
Women who did not give birth in the past 12 months
| Now married: | 0.0% (0) |
| Unmarried: | 100.0% (76) |
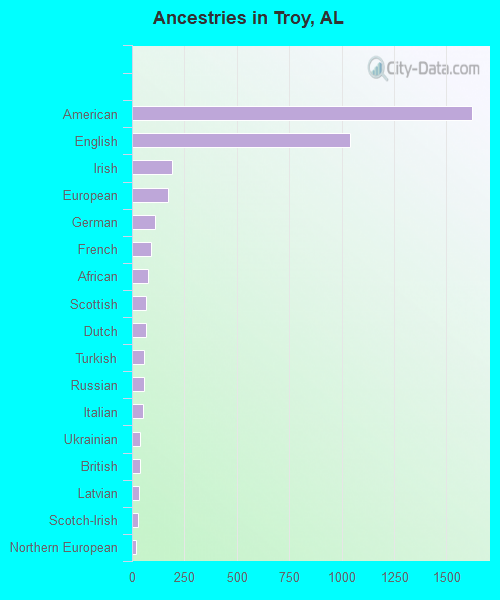
Ancestries in Troy

- 3,05323.5%American
- 1,1578.9%English
- 4143.2%African
- 2021.6%European
- 1981.5%Irish
- 1811.4%German
- 1491.1%Scottish
- 1341.0%Italian
- 1000.8%Scotch-Irish
- 400.3%French
- 290.2%Canadian
- 210.2%Northern European
- 200.2%Latvian
- 190.1%British
- 180.1%Brazilian
- 100.08%Welsh
- 80.06%Nigerian
- 70.05%Danish
- 60.05%Egyptian
- 50.04%Swedish
- 30.02%Czech
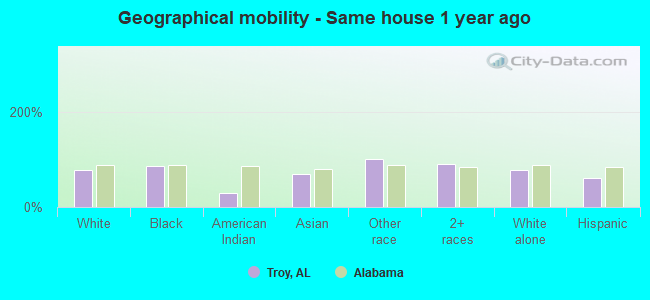
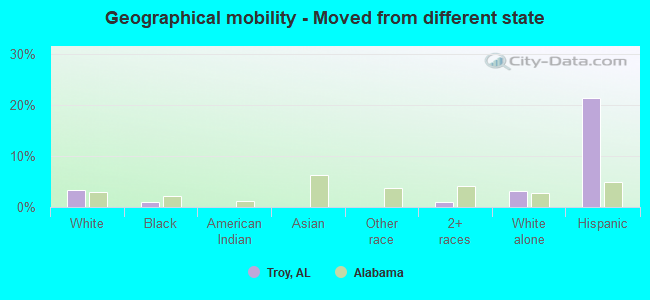
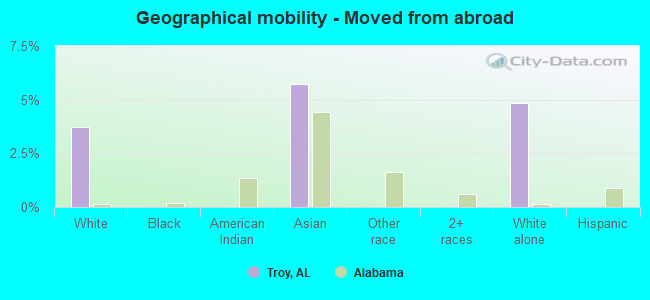
Geographical mobility in Troy

- Same house 1 year ago
- 8,18376.9%White (Caucasian)
- 6,40284.8%Black or African American
- 530.3%American Indian / Alaska Native
- 45368.8%Asian
- 25100.0%Other race
- 76489.6%Two or more races
- 8,16177.1%White alone, not Hispanic / Latino
- 18760.7%Hispanic or Latino
-
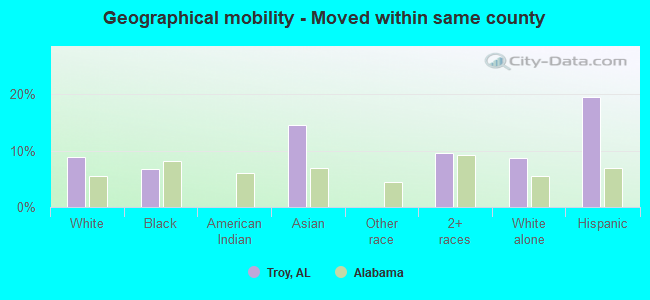
- Moved within same county
- 9518.9%White / Caucasian
- 5046.7%Black or African American
- 9514.5%Asian
- 829.6%Two or more races
- 9168.7%White alone, not Hispanic / Latino
- 6019.5%Hispanic or Latino
-
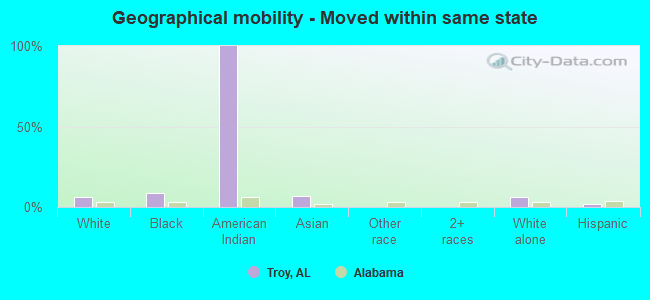
- Moved within same state
- 6225.8%White / Caucasian
- 6819.0%Black or African American
- 21100.0%American Indian / Alaska Native
- 477.1%Asian
- 6506.1%White alone, not Hispanic / Latino
- 51.7%Hispanic or Latino
-
- Moved from different state
- 3613.4%White / Caucasian
- 710.9%Black or African American
- 91.0%Two or more races
- 3243.1%White alone, not Hispanic / Latino
- 6621.3%Hispanic or Latino
-
- Moved from abroad
- 3993.7%White
- 385.7%Asian
- 5154.9%White alone, not Hispanic / Latino
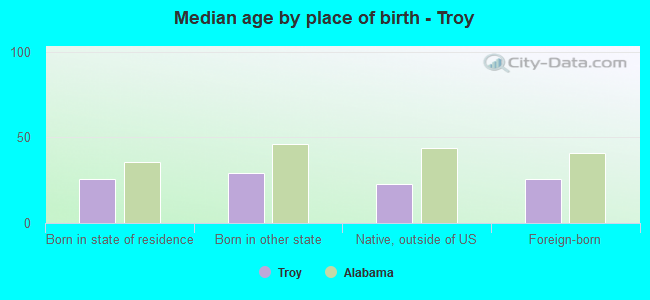
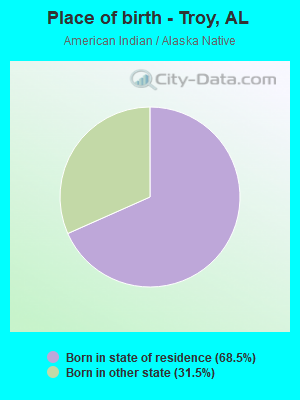
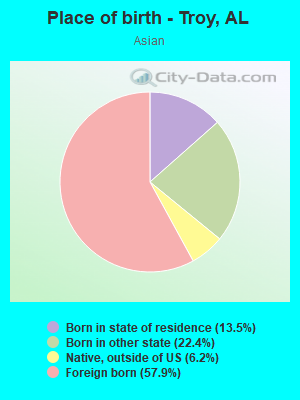
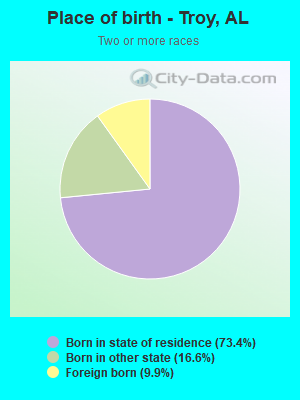
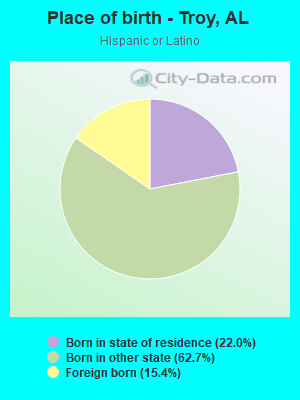
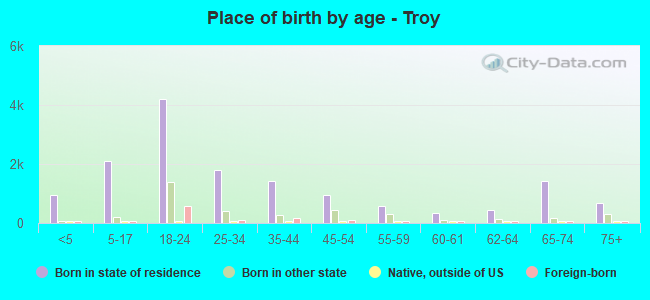
Children Nativity (place of birth) in Troy
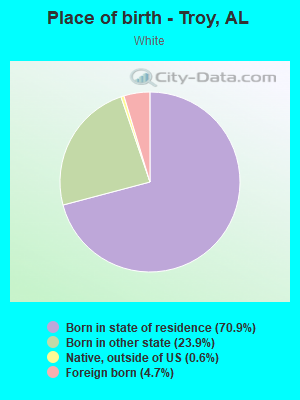
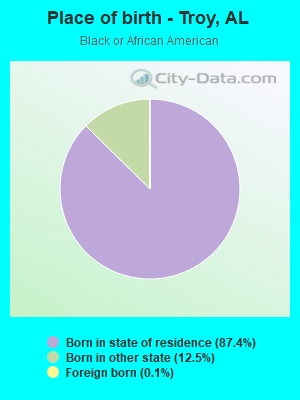
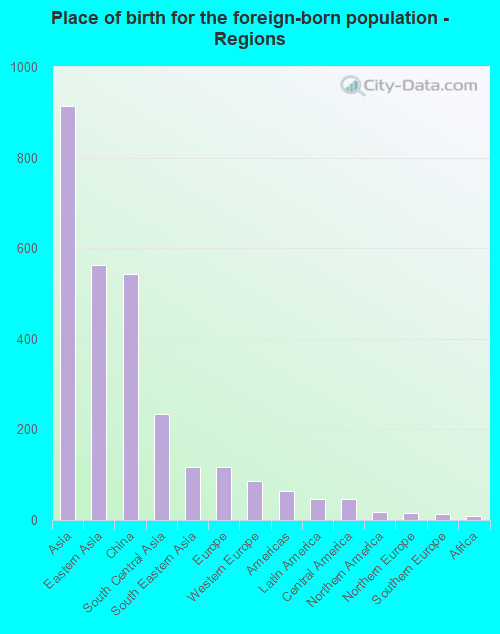
Place of birth for residents in Troy
![Place of birth for the foreign-born population - Regions]()
- 914Asia
- 563Eastern Asia
- 543China
- 234South Central Asia
- 117South Eastern Asia
- 116Europe
- 86Western Europe
- 65Americas
- 47Latin America
- 47Central America
- 17Northern America
- 15Northern Europe
- 13Southern Europe
- 9Africa
- 5Western Africa
- 3Northern Africa
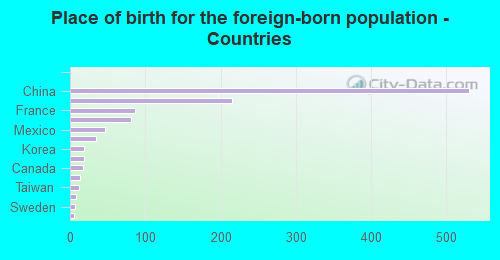
![Place of birth for the foreign-born population - Countries]()
- 530China
- 215India
- 86France
- 81Vietnam
- 47Mexico
- 35Indonesia
- 19Korea
- 18Nepal
- 17Canada
- 13Italy
- 12Taiwan
- 8United Kingdom
- 6Sweden
- 5Nigeria
- 3Egypt
Grandparents responsible for own grandchildren in Troy
Zip codes: 36082.