Races in Villages of Oriole, Florida (FL) Detailed Stats
Ancestries, Foreign-born residents, place of birth

Discuss Villages of Oriole, Florida races on our local forum with over 2,400,000 registered users
9.8% of Villages of Oriole, FL residents are foreign-born (9.0% born in Europe), which is 115.3% less than the foreign-born rate of 21.0% across the entire state of Florida.
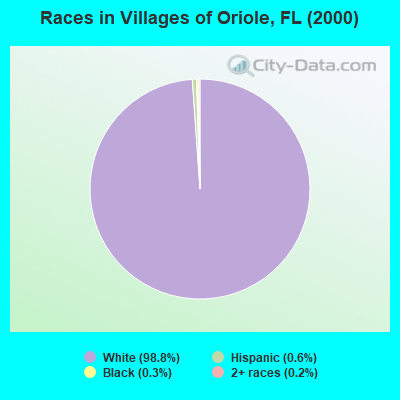
Race distribution in Villages of Oriole

- 4,70198.8%White alone
- 300.6%Hispanic
- 140.3%Black alone
- 90.2%Two or more races
- 20.04%Asian alone
- 20.04%Native Hawaiian and Other
Pacific Islander alone
2000
2022
-
- 10,458,50965.4%White alone
- 2,682,71516.8%Hispanic
- 2,264,26814.2%Black alone
- 261,6931.6%Asian alone
- 236,9541.5%Two or more races
- 42,3580.3%American Indian alone
- 28,9940.2%Other race alone
- 6,8870.04%Native Hawaiian and Other
Pacific Islander alone

-
- 11,309,40350.8%White alone
- 6,025,03927.1%Hispanic
- 3,241,01514.6%Black alone
- 861,6303.9%Two or more races
- 623,6922.8%Asian alone
- 152,0540.7%Other race alone
- 22,5040.1%American Indian alone
- 9,4860.04%Native Hawaiian and Other
Pacific Islander alone

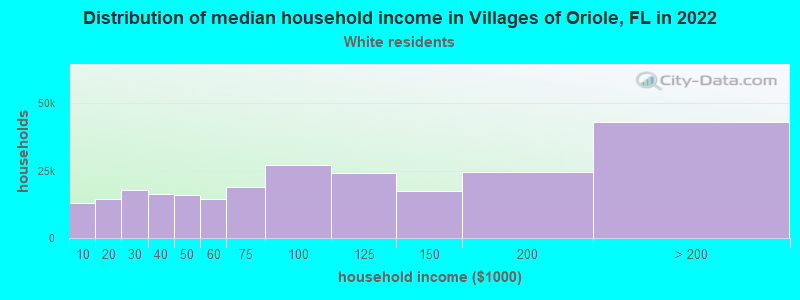
Income and house value in Villages of Oriole
- Median household income in 2022
- $53,088White non-Hispanic householders
- Median 2022 house value
- $223,902White Non-Hispanic householders
Household income for White non-Hispanic householders
Foreign-born residents in Villages of Oriole
464 residents are foreign born (9.0% Europe).
| This city: | 9.8% |
| Florida: | 16.7% |
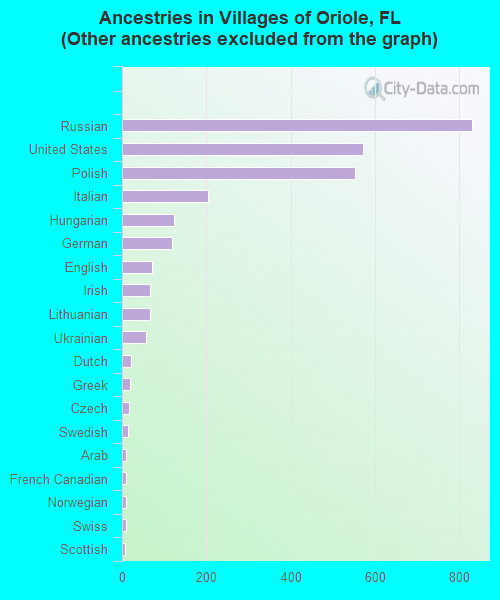
Ancestries in Villages of Oriole

- 1,56736.1%Other
- 82919.1%Russian
- 57113.1%United States
- 55312.7%Polish
- 2034.7%Italian
- 1242.9%Hungarian
- 1192.7%German
- 721.7%English
- 671.5%Irish
- 661.5%Lithuanian
- 581.3%Ukrainian
- 210.5%Dutch
- 190.4%Greek
- 160.4%Czech
- 150.3%Swedish
- 90.2%Arab
- 90.2%French Canadian
- 90.2%Norwegian
- 90.2%Swiss
- 80.2%Scottish
Zip codes: 33446.