Estimated zip code population in 2022: 28,557 Zip code population in 2010: 22,088 Zip code population in 2000: 15,146
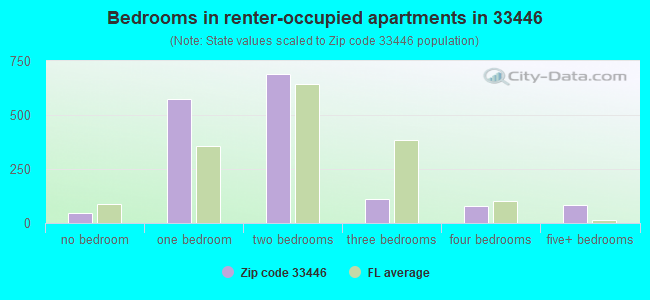
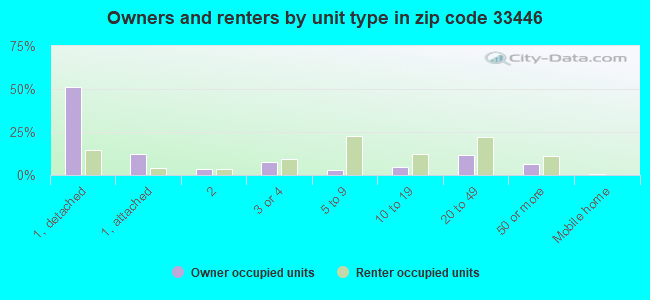
Houses and condos: 18,820 Renter-occupied apartments: 1,577
% of renters here:
11%
State:
33%
March 2022 cost of living index in zip code 33446: 101.3 (near average, U.S. average is 100)
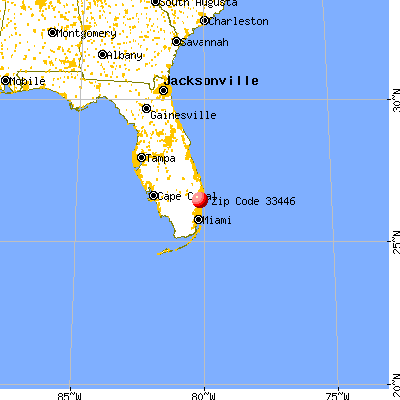
Land area: 21.3 sq. mi. Water area: 0.0 sq. mi.
Population density: 1,340 people per square mile
(low).
OSM Map
General Map
Google Map
MSN Map
OSM Map
General Map
Google Map
MSN Map
OSM Map
General Map
Google Map
MSN Map
OSM Map
General Map
Google Map
MSN Map
Please wait while loading the map...
Real estate property taxes paid for housing units in 2022:
This zip code:
0.8% ($3,263)
Florida:
0.7% ($2,529)
Median real estate property taxes paid for housing units with mortgages in 2022: $5,410 (0.9%) Median real estate property taxes paid for housing units with no mortgage in 2022: $2,308 (0.7%)
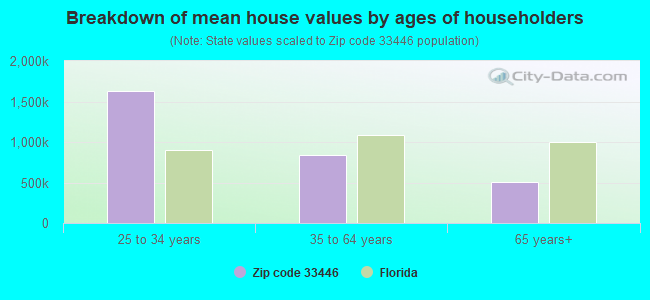
Estimated median house/condo value in 2022: $427,416
33446:
$427,416
Florida:
$354,100
According to our research of Florida and other state lists, there were 17 registered sex offenders living in 33446 zip code as of April 26, 2024. The ratio of all residents to sex offenders in zip code 33446 is 1,365 to 1. The ratio of registered sex offenders to all residents in this zip code is lower than the state average.
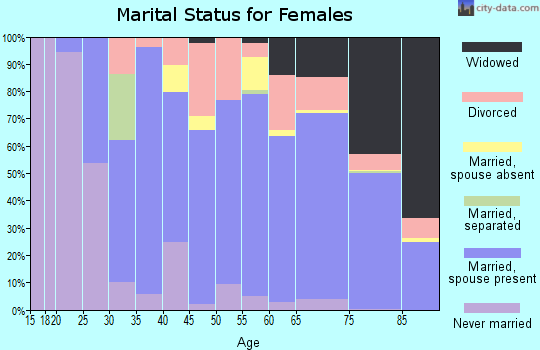
Median resident age:
This zip code:
67.7 years
Florida median age:
42.7 years
Average household size:
This zip code:
1.9 people
Florida:
2.5 people
Averages for the 2020 tax year for zip code 33446, filed in 2021:
Average Adjusted Gross Income (AGI) in 2020: $220,116 (Individual Income Tax Returns)
Here:
$220,116
State:
$82,200
Salary/wage: $132,498 (reported on 51.8% of returns)
Here:
$132,498
State:
$58,347
(% of AGI for various income ranges: 935.7% for AGIs below $25k, 3049.6% for AGIs $25k-50k, 5051.8% for AGIs $50k-75k, 6305.8% for AGIs $75k-100k, 12170.7% for AGIs $100k-200k, 134654.7% for AGIs over 200k)
Taxable interest for individuals: $9,802 (reported on 57.2% of returns)
This zip code:
$9,802
Florida:
$4,272
(% of AGI for various income ranges: 111.2% for AGIs below $25k, 214.6% for AGIs $25k-50k, 332.9% for AGIs $50k-75k, 593.8% for AGIs $75k-100k, 1068.9% for AGIs $100k-200k, 10870.2% for AGIs over 200k)
Ordinary dividends: $23,931 (reported on 51.9% of returns)
Here:
$23,931
State:
$15,863
(% of AGI for various income ranges: 222.0% for AGIs below $25k, 481.7% for AGIs $25k-50k, 762.8% for AGIs $50k-75k, 1500.2% for AGIs $75k-100k, 2708.7% for AGIs $100k-200k, 23273.6% for AGIs over 200k)
Net capital gain/loss in AGI: +$78,344 (reported on 51.3% of returns)
Here:
+$78,344
State:
+$62,983
(% of AGI for various income ranges: 37.4% for AGIs below $25k, 264.3% for AGIs $25k-50k, 428.1% for AGIs $50k-75k, 880.0% for AGIs $75k-100k, 2392.9% for AGIs $100k-200k, 100424.8% for AGIs over 200k)
Profit/loss from business: +$25,642 (reported on 20.2% of returns)
Here:
+$25,642
State:
+$9,719
(% of AGI for various income ranges: 257.7% for AGIs below $25k, 345.1% for AGIs $25k-50k, 412.1% for AGIs $50k-75k, 408.7% for AGIs $75k-100k, 1025.0% for AGIs $100k-200k, 9026.4% for AGIs over 200k)
Taxable individual retirement arrangement distribution: $33,190 (reported on 25.2% of returns)
33446:
$33,190
Florida:
$24,823
(% of AGI for various income ranges: 262.4% for AGIs below $25k, 553.8% for AGIs $25k-50k, 958.1% for AGIs $50k-75k, 1768.2% for AGIs $75k-100k, 3002.3% for AGIs $100k-200k, 10953.3% for AGIs over 200k)
Self-employed (Keogh) retirement plans: $26,750 (reported on 1.5% of returns)
33446:
$26,750
Florida:
$29,694
(% of AGI for various income ranges: 19.3% for AGIs $25k-50k, 67.1% for AGIs $100k-200k, 933.1% for AGIs over 200k)
Total itemized deductions: $53,068 (reported on 20.6% of returns)
Here:
$53,068
State:
$45,393
(% of AGI for various income ranges: 244.7% for AGIs below $25k, 618.2% for AGIs $25k-50k, 967.5% for AGIs $50k-75k, 1532.7% for AGIs $75k-100k, 2552.4% for AGIs $100k-200k, 18767.4% for AGIs over 200k)
Charity contributions: $19,255 (reported on 18.1% of returns)
Here:
$19,255
State:
$20,178
(% of AGI for various income ranges: 10.4% for AGIs below $25k, 48.7% for AGIs $25k-50k, 90.6% for AGIs $50k-75k, 189.0% for AGIs $75k-100k, 353.5% for AGIs $100k-200k, 8153.4% for AGIs over 200k)
Taxes paid: $8,155 (reported on 20.4% of returns)
33446:
$8,155
State:
$6,967
(% of AGI for various income ranges: 45.1% for AGIs below $25k, 113.1% for AGIs $25k-50k, 182.3% for AGIs $50k-75k, 322.0% for AGIs $75k-100k, 550.5% for AGIs $100k-200k, 2337.9% for AGIs over 200k)
Earned income credit: $1,477 (reported on 5.5% of returns)
Here:
$1,477
State:
$2,306
(% of AGI for various income ranges: 45.4% for AGIs below $25k, 23.6% for AGIs $25k-50k)
Percentage of individuals using paid preparers for their 2020 taxes: 91.2%
Here:
91%
State:
92%
(% for various income ranges: 88.9% for AGIs below $25k, 89.9% for AGIs $25k-50k, 91.4% for AGIs $50k-75k, 92.5% for AGIs $75k-100k, 93.0% for AGIs $100k-200k, 93.3% for AGIs over 200k)
Averages for the 2012 tax year for zip code 33446, filed in 2013:
Average Adjusted Gross Income (AGI) in 2012: $135,685 (Individual Income Tax Returns)
Here:
$135,685
State:
$60,316
Salary/wage: $87,342 (reported on 45.4% of returns)
Here:
$87,342
State:
$45,277
(% of AGI for various income ranges: 38.2% for AGIs below $25k, 40.7% for AGIs $25k-50k, 30.8% for AGIs $50k-75k, 23.7% for AGIs $75k-100k, 28.1% for AGIs $100k-200k, 28.6% for AGIs over 200k)
Taxable interest for individuals: $8,625 (reported on 65.0% of returns)
This zip code:
$8,625
Florida:
$3,587
(% of AGI for various income ranges: 7.8% for AGIs below $25k, 4.9% for AGIs $25k-50k, 5.4% for AGIs $50k-75k, 5.6% for AGIs $75k-100k, 5.2% for AGIs $100k-200k, 3.4% for AGIs over 200k)
Ordinary dividends: $18,095 (reported on 55.0% of returns)
Here:
$18,095
State:
$12,831
(% of AGI for various income ranges: 11.1% for AGIs below $25k, 8.6% for AGIs $25k-50k, 8.8% for AGIs $50k-75k, 9.2% for AGIs $75k-100k, 9.1% for AGIs $100k-200k, 6.4% for AGIs over 200k)
Net capital gain/loss in AGI: +$45,468 (reported on 53.9% of returns)
Here:
+$45,468
State:
+$33,493
(% of AGI for various income ranges: 1.5% for AGIs $50k-75k, 2.0% for AGIs $75k-100k, 3.8% for AGIs $100k-200k, 26.6% for AGIs over 200k)
Profit/loss from business: +$20,125 (reported on 15.2% of returns)
Here:
+$20,125
State:
+$10,012
(% of AGI for various income ranges: 8.0% for AGIs below $25k, 3.1% for AGIs $25k-50k, 2.0% for AGIs $50k-75k, 2.1% for AGIs $75k-100k, 2.4% for AGIs $100k-200k, 1.9% for AGIs over 200k)
Taxable individual retirement arrangement distribution: $29,413 (reported on 41.5% of returns)
33446:
$29,413
Florida:
$21,544
(% of AGI for various income ranges: 16.3% for AGIs below $25k, 12.5% for AGIs $25k-50k, 12.8% for AGIs $50k-75k, 14.7% for AGIs $75k-100k, 14.5% for AGIs $100k-200k, 6.3% for AGIs over 200k)
Self-employment retirement plans: $23,492 (reported on 1.1% of returns)
33446:
$23,492
Florida:
$20,611
(% of AGI for various income ranges: 0.2% for AGIs $25k-50k, 0.2% for AGIs $100k-200k, 0.2% for AGIs over 200k)
Total itemized deductions: $38,005 (16% of AGI, reported on 46.4% of returns)
Here:
$38,005
State:
$25,533
Here:
15.7% of AGI
State:
18.0% of AGI
(% of AGI for various income ranges: 28.2% for AGIs below $25k, 21.8% for AGIs $25k-50k, 17.9% for AGIs $50k-75k, 17.7% for AGIs $75k-100k, 17.6% for AGIs $100k-200k, 9.8% for AGIs over 200k)
Charity contributions: $7,350 (reported on 41.8% of returns)
Here:
$7,350
State:
$5,698
(% of AGI for various income ranges: 1.4% for AGIs below $25k, 1.6% for AGIs $25k-50k, 1.7% for AGIs $50k-75k, 1.9% for AGIs $75k-100k, 2.1% for AGIs $100k-200k, 2.5% for AGIs over 200k)
Taxes paid: $12,076 (reported on 46.1% of returns)
33446:
$12,076
State:
$6,203
(% of AGI for various income ranges: 5.4% for AGIs below $25k, 4.6% for AGIs $25k-50k, 4.2% for AGIs $50k-75k, 5.0% for AGIs $75k-100k, 5.6% for AGIs $100k-200k, 3.6% for AGIs over 200k)
Earned income credit: $1,503 (reported on 5.4% of returns)
Here:
$1,503
State:
$2,372
(% of AGI for various income ranges: 1.7% for AGIs below $25k, 0.2% for AGIs $25k-50k)
Percentage of individuals using paid preparers for their 2012 taxes: 72.4%
Here:
72%
State:
54%
(% for various income ranges: 66.1% for AGIs below $25k, 68.3% for AGIs $25k-50k, 74.5% for AGIs $50k-75k, 76.6% for AGIs $75k-100k, 76.4% for AGIs $100k-200k, 86.7% for AGIs over 200k)
Averages for the 2004 tax year for zip code 33446, filed in 2005:
Average Adjusted Gross Income (AGI) in 2004: $90,306 (Individual Income Tax Returns)
Here:
$90,306
State:
$50,523
Salary/wage: $72,117 (reported on 42.1% of returns)
Here:
$72,117
State:
$39,563
(% of AGI for various income ranges: 29.5% for AGIs $10k-25k, 28.9% for AGIs $25k-50k, 26.3% for AGIs $50k-75k, 23.9% for AGIs $75k-100k, 33.7% for AGIs over 100k)
Taxable interest for individuals: $9,388 (reported on 81.2% of returns)
This zip code:
$9,388
Florida:
$3,211
(% of AGI for various income ranges: 17.1% for AGIs $10k-25k, 12.2% for AGIs $25k-50k, 10.5% for AGIs $50k-75k, 9.4% for AGIs $75k-100k, 6.0% for AGIs over 100k)
Taxable dividends: $10,451 (reported on 65.3% of returns)
Here:
$10,451
State:
$6,129
(% of AGI for various income ranges: 11.9% for AGIs $10k-25k, 9.0% for AGIs $25k-50k, 8.5% for AGIs $50k-75k, 7.8% for AGIs $75k-100k, 6.2% for AGIs over 100k)
Net capital gain/loss: +$26,779 (reported on 62.0% of returns)
Here:
+$26,779
State:
+$27,205
(% of AGI for various income ranges: -1.6% for AGIs $10k-25k, 0.3% for AGIs $25k-50k, 2.3% for AGIs $50k-75k, 4.4% for AGIs $75k-100k, 23.7% for AGIs over 100k)
Profit/loss from business: +$21,528 (reported on 12.7% of returns)
Here:
+$21,528
State:
+$10,634
(% of AGI for various income ranges: 3.6% for AGIs $10k-25k, 2.4% for AGIs $25k-50k, 2.5% for AGIs $50k-75k, 2.3% for AGIs $75k-100k, 3.0% for AGIs over 100k)
IRA payment deduction: $3,997 (reported on 3.7% of returns)
33446:
$3,997
Florida:
$3,082
(% of AGI for various income ranges: 0.4% for AGIs $10k-25k, 0.4% for AGIs $25k-50k, 0.3% for AGIs $50k-75k, 0.2% for AGIs $75k-100k, 0.1% for AGIs over 100k)
Self-employed pension: $22,255 (reported on 1.0% of returns)
Here:
$22,255
Florida:
$15,857
Total itemized deductions: $27,536 (18% of AGI, reported on 47.9% of returns)
Here:
$27,536
State:
$20,370
Here:
17.9% of AGI
State:
20.7% of AGI
(% of AGI for various income ranges: 33.0% for AGIs $10k-25k, 24.2% for AGIs $25k-50k, 19.8% for AGIs $50k-75k, 18.5% for AGIs $75k-100k, 10.2% for AGIs over 100k)
Charity contributions deductions: $4,590 (3% of AGI, reported on 43.9% of returns)
Here:
$4,590
State:
$4,064
Here:
3.0% of AGI
State:
3.8% of AGI
(% of AGI for various income ranges: 2.5% for AGIs $10k-25k, 2.3% for AGIs $25k-50k, 2.3% for AGIs $50k-75k, 2.3% for AGIs $75k-100k, 2.0% for AGIs over 100k)
Total tax: $22,489 (reported on 76.0% of returns)
33446:
$22,489
State:
$9,431
(% of AGI for various income ranges: 3.1% for AGIs $10k-25k, 6.7% for AGIs $25k-50k, 9.5% for AGIs $50k-75k, 11.0% for AGIs $75k-100k, 22.0% for AGIs over 100k)
Earned income credit: $1,140 (reported on 3.0% of returns)
Here:
$1,140
State:
$1,808
Percentage of individuals using paid preparers for their 2004 taxes: 75.1%
Here:
75%
State:
60%
(% for various income ranges: 71.7% for AGIs below $10k, 74.2% for AGIs $10k-25k, 74.0% for AGIs $25k-50k, 73.7% for AGIs $50k-75k, 74.6% for AGIs $75k-100k, 82.4% for AGIs over 100k)
Likely homosexual households (counted as self-reported same-sex unmarried-partner households)
Lesbian couples: 0.0% of all households
Gay men: 0.0% of all households
Household received Food Stamps/SNAP in the past 12 months: 731 Household did not receive Food Stamps/SNAP in the past 12 months: 14,294
Women who had a birth in the past 12 months: 70 (74 now married, 0 unmarried) Women who did not have a birth in the past 12 months: 2,596 (1,475 now married, 1,122 unmarried)
Housing units in zip code 33446 with a mortgage: 4,912 (212 second mortgage, 136 both second mortgage and home equity loan) Houses without a mortgage: 143
Median monthly owner costs for units with a mortgage: $2,315 Median monthly owner costs for units without a mortgage: $815
Residents with income below the poverty level in 2022:
This zip code:
9.5%
Whole state:
12.7%
Residents with income below 50% of the poverty level in 2022:
This zip code:
2.4%
Whole state:
6.6%
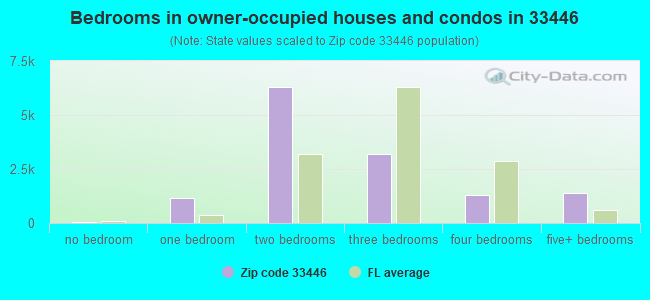
Median number of rooms in houses and condos:
Here:
5.4
State:
5.9
Median number of rooms in apartments:
Here:
3.9
State:
4.2
Notable locations in this zip code not listed on our city pages
Notable locations in zip code 33446: Cutter Sound Golf and Yacht Club (A), Crystalbrook Golf Course (B), Crystal Lake Country Club (C), Cross Creek Country Club (D), Countryside Golf Club (E), Country Creek Country Club (F), Palm Beach County Fire Rescue Station 42 Headquarters (G), South County Civic Center (H), Donald B Gordon Memorial Library (I). Display/hide their locations on the map
In group quarters: 14 (-1 institutionalized population)
Size of family households: 5,968 2-persons, 792 3-persons, 800 4-persons, 389 5-persons, 56 6-persons, 36 7-or-more-persons
Size of nonfamily households: 5,861 1-person, 1,011 2-persons, 25 4-persons
2,565 married couples with children.
269 single-parent households (168 men, 101 women).
80.9% of residents of 33446 zip code speak English at home.
11.8% of residents speak Spanish at home (70% very well, 21% well, 9% not well, 1% not at all).
7.0% of residents speak other Indo-European language at home (69% very well, 20% well, 11% not well).
0.2% of residents speak Asian or Pacific Island language at home (100% very well).
1.5% of residents speak other language at home (91% very well, 9% well).
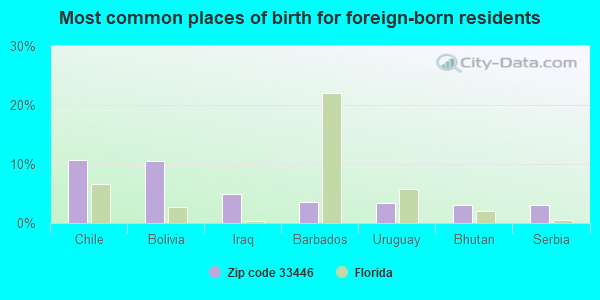
Foreign born population: 5,814 (20.4%) (65.7% of them are naturalized citizens)
This zip code:
20.4%
Whole state:
21.7%
11%Chile
11%Bolivia
5%Iraq
4%Barbados
3%Uruguay
3%Bhutan
3%Serbia
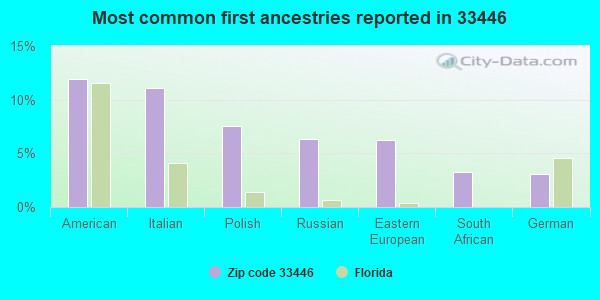
12%American
11%Italian
8%Polish
6%Russian
6%Eastern European
3%South African
3%German
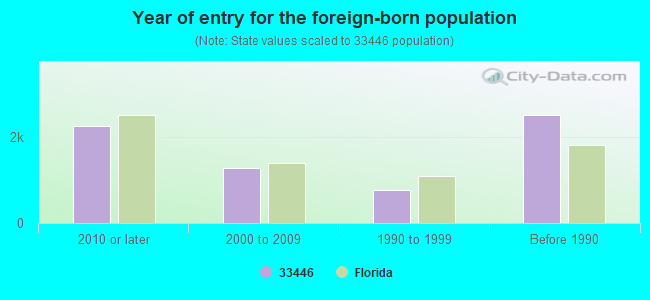
Year of entry for the foreign-born population
2,2432010 or later
1,2672000 to 2009
7721990 to 1999
2,502Before 1990
Facilities with environmental interests located in this zip code:
GFP CORP (6576 W ATLANTIC AVE in DELRAY BEACH, FL)
AIR MINOR (AIRS/AFS) Small Quantity Generators, between 100 kg and 1000 kg of hazardous waste/month (Resource Conservation and Recovery Act (tracking hazardous waste)) - notification Business SIC classification: DRYCLEANING PLANTS, EXCEPT RUG CLEANING Organizations: GARY FRANK PRESIDENT (CONTACT/OWNER)
Alternative names: POINT CLEANERS
GRAND HAVEN AT LINTON BLVD (LINTON BLVD & FLORIDA TURNPIKE in DELRAY BEACH, FL)
National Pollutant Discharge Elimination System NON-MAJOR (Tracking pollutant discharge elimination systems) - permit Organizations: BILL LAKEMAN (CONTACT/OWNER)
ATLANTIC CLEANERS (15210 CARTER RD in DELRAY BEACH, FL)
(Resource Conservation and Recovery Act (tracking hazardous waste)) Organizations: ROBERT GAMBOA, PRES (CONTACT/OWNER)
HAGEN RANCH ROAD BRANCH LIBRAR (14276 HAGEN RANCH RD in DELRAY BEACH, FL)
National Pollutant Discharge Elimination System NON-MAJOR (Tracking pollutant discharge elimination systems) - permit Organizations: JOHN CHESHER (CONTACT/OWNER)
KARTSON CLEANER CORP (15200 JOG RD #D5 in DELRAY BEACH, FL)
OCEANSIDE HOMES (W OF JOG RD ON LINTON BLVD in DELRAY BCH, FL)
National Pollutant Discharge Elimination System NON-MAJOR (Tracking pollutant discharge elimination systems) - permit Organizations: RONALD PITOCCHELLI (CONTACT/OWNER)
PERO FARMS PACKING PLANT EXPAN (14095 SR7 in DELRAY BEACH, FL)
National Pollutant Discharge Elimination System NON-MAJOR (Tracking pollutant discharge elimination systems) - permit Organizations: CHRIS CROMWELL (CONTACT/OWNER)
POLO TRACE GOLF COURSE (13135 HAGEN RANCH ROAD in DELRAY BEACH, FL)
(Resource Conservation and Recovery Act (tracking hazardous waste)) Organizations: NON NOTIFIER (CONTACT/OWNER)
AMERIGROW RECYCLING - DELRAY, LTD. PARTP (10320 WEST ATLANTIC AVENUE in DELRAY BEACH, FL)
AIR MINOR (AIRS/AFS) Business SIC classification: REFUSE SYSTEMS
JERMAR OF BOCA INC (7431 WEST ATLANTIC AVENUE in DELRAY BEACH, FL)
AIR MINOR (AIRS/AFS) Business SIC classification: DRYCLEANING PLANTS, EXCEPT RUG CLEANING
DELRAY TRAINING CTR (LYONS RD & LINTON BLVD in DELRAY BEACH, FL)
National Pollutant Discharge Elimination System NON-MAJOR (Tracking pollutant discharge elimination systems) - permit Alternative names: TBI/PALM BEACH LTD PATNERSHIP
ATLANTIC CHEVRON (7533 W ATLANTIC AVE in DELRAY BEACH, FL)
Small Quantity Generators, between 100 kg and 1000 kg of hazardous waste/month (Resource Conservation and Recovery Act (tracking hazardous waste)) - notification Organizations: WESLEY TOWNSEND, DEALER (CONTACT/OWNER)
Housing units lacking complete plumbing facilities: 0.5% Housing units lacking complete kitchen facilities: 0.1%
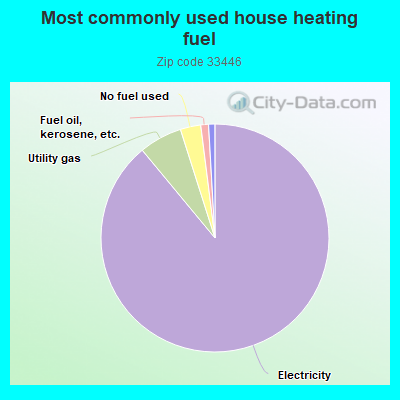
89.0%Electricity
6.1%Utility gas
2.9%No fuel used
1.1%Fuel oil, kerosene, etc.
0.9%Bottled, tank, or LP gas
Population in 1990: 13,016. Population change in the 1990s: +2,130 (+16.4%).
Place of birth for U.S.-born residents:
This state: 3,679
Northeast: 14,436
Midwest: 2,047
South: 1,383
West: 305
64% of the 33446 zip code residents lived in the same house 5 years ago. Out of people who lived in different houses, 30% lived in this county. Out of people who lived in different counties, 50% lived in Florida.
85% of the 33446 zip code residents lived in the same house 1 year ago. Out of people who lived in different houses, 38% moved from this county. Out of people who lived in different houses, 14% moved from different county within same state. Out of people who lived in different houses, 41% moved from different state. Out of people who lived in different houses, 8% moved from abroad.
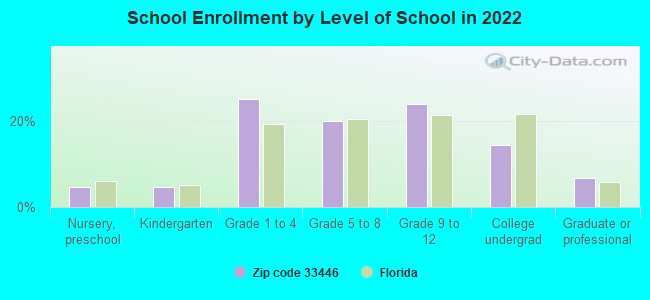
Private vs. public school enrollment:
Students in private schools in grades 1 to 8 (elementary and middle school): 510
Here:
35.0%
Florida:
15.8%
Students in private schools in grades 9 to 12 (high school): 263
Here:
34.3%
Florida:
12.9%
Students in private undergraduate colleges: 80
Here:
17.7%
Florida:
23.6%
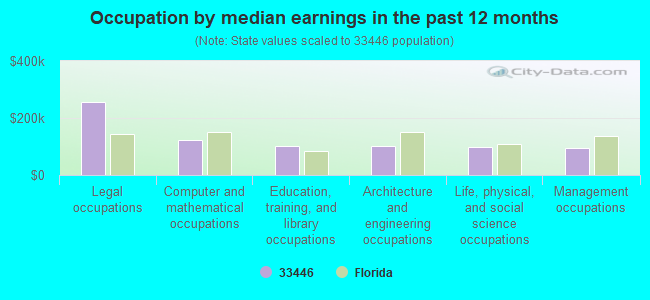
Occupation by median earnings in the past 12 months ($)
256,359Legal occupations
124,155Computer and mathematical occupations
101,748Education, training, and library occupations
100,085Architecture and engineering occupations
99,848Life, physical, and social science occupations
94,366Management occupations
Top industries in this zip code by the number of employees in 2005:
Arts, Entertainment, and Recreation: Golf Courses and Country Clubs (250-499 employees: 2 establishments, 100-249 employees: 1 establishment, 1-4 employees: 1 establishment)
Administrative and Support and Waste Management and Remediation Services: Landscaping Services (250-499: 1, 100-249: 1, 50-99: 1, 20-49: 3, 10-19: 3, 1-4: 6)
2003 - 2018 National Fire Incident Reporting System (NFIRS) incidents
According to the data from the years 2003 - 2018 the average number of fires per year is 39. The highest number of reported fire incidents - 93 took place in 2004, and the least - 15 in 2010. The data has a declining trend.
When looking into fire subcategories, the most reports belonged to: Outside Fires (44.1%), and Mobile Property/Vehicle Fires (20.5%).
Fire incident types reported to NFIRS in Zip Code 33446


 Nearest zip codes: 33496, 33484, 33473, 33434, 33437, 33498.


 According to the data from the years 2003 - 2018 the average number of fires per year is 39. The highest number of reported fire incidents - 93 took place in 2004, and the least - 15 in 2010. The data has a declining trend.
 When looking into fire subcategories, the most reports belonged to: Outside Fires (44.1%), and Mobile Property/Vehicle Fires (20.5%).