Estimated zip code population in 2022: 39,254 Zip code population in 2010: 35,938 Zip code population in 2000: 39,212
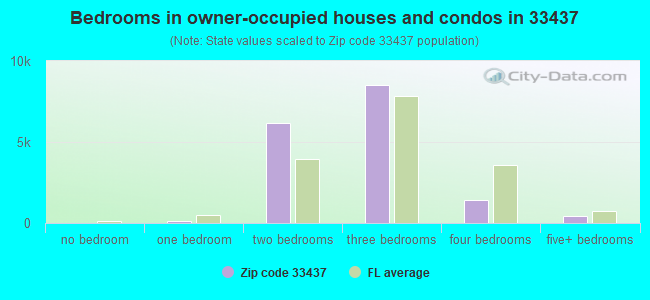
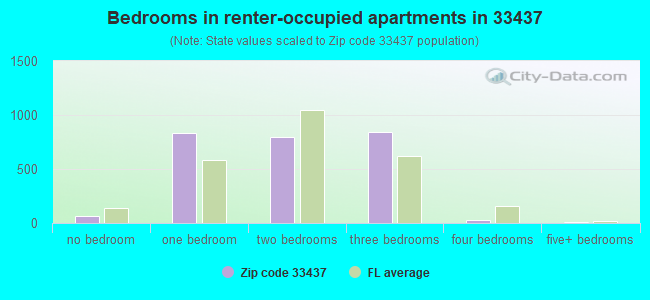
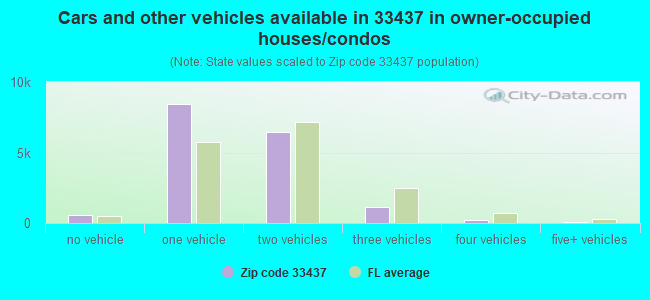
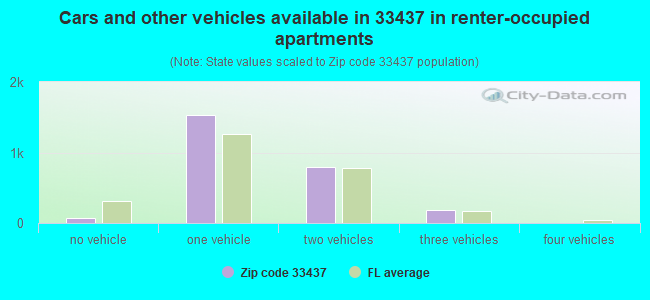
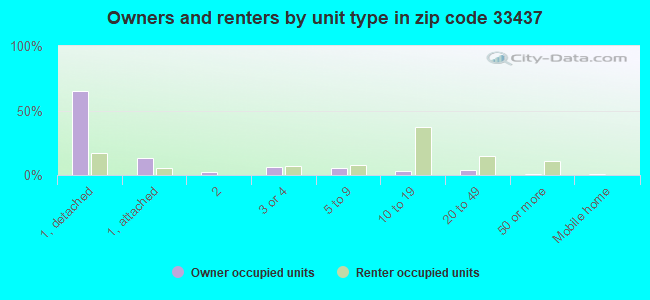
Houses and condos: 22,683 Renter-occupied apartments: 2,587
% of renters here:
13%
State:
33%
March 2022 cost of living index in zip code 33437: 101.6 (near average, U.S. average is 100)
Land area: 10.8 sq. mi. Water area: 0.0 sq. mi.
Population density: 3,619 people per square mile
(average).
OSM Map
General Map
Google Map
MSN Map
OSM Map
General Map
Google Map
MSN Map
OSM Map
General Map
Google Map
MSN Map
OSM Map
General Map
Google Map
MSN Map
Please wait while loading the map...
Real estate property taxes paid for housing units in 2022:
This zip code:
0.8% ($3,608)
Florida:
0.7% ($2,529)
Median real estate property taxes paid for housing units with mortgages in 2022: $3,712 (0.8%) Median real estate property taxes paid for housing units with no mortgage in 2022: $3,486 (0.8%)
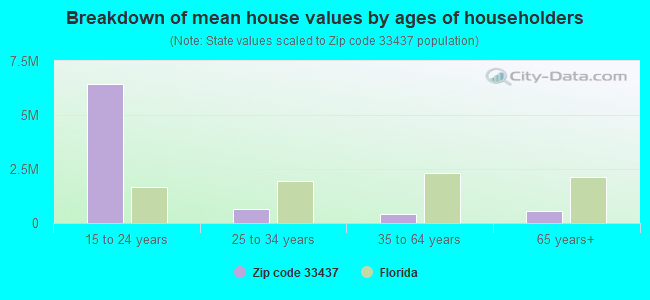
Estimated median house/condo value in 2022: $439,292
33437:
$439,292
Florida:
$354,100
According to our research of Florida and other state lists, there were 12 registered sex offenders living in 33437 zip code as of April 27, 2024. The ratio of all residents to sex offenders in zip code 33437 is 3,267 to 1. The ratio of registered sex offenders to all residents in this zip code is much lower than the state average.
Median resident age:
This zip code:
66.4 years
Florida median age:
42.7 years
Average household size:
This zip code:
2.0 people
Florida:
2.5 people
Averages for the 2020 tax year for zip code 33437, filed in 2021:
Average Adjusted Gross Income (AGI) in 2020: $79,441 (Individual Income Tax Returns)
Here:
$79,441
State:
$82,200
Salary/wage: $54,624 (reported on 50.1% of returns)
Here:
$54,624
State:
$58,347
(% of AGI for various income ranges: 1048.8% for AGIs below $25k, 2932.0% for AGIs $25k-50k, 4742.1% for AGIs $50k-75k, 6283.4% for AGIs $75k-100k, 11006.7% for AGIs $100k-200k, 41973.9% for AGIs over 200k)
Taxable interest for individuals: $3,715 (reported on 50.7% of returns)
This zip code:
$3,715
Florida:
$4,272
(% of AGI for various income ranges: 98.8% for AGIs below $25k, 157.0% for AGIs $25k-50k, 266.8% for AGIs $50k-75k, 386.1% for AGIs $75k-100k, 831.7% for AGIs $100k-200k, 3105.0% for AGIs over 200k)
Ordinary dividends: $11,788 (reported on 46.9% of returns)
Here:
$11,788
State:
$15,863
(% of AGI for various income ranges: 204.9% for AGIs below $25k, 340.1% for AGIs $25k-50k, 636.5% for AGIs $50k-75k, 1104.7% for AGIs $75k-100k, 2188.6% for AGIs $100k-200k, 13570.4% for AGIs over 200k)
Net capital gain/loss in AGI: +$20,524 (reported on 44.2% of returns)
Here:
+$20,524
State:
+$62,983
(% of AGI for various income ranges: 2.2% for AGIs below $25k, 123.2% for AGIs $25k-50k, 285.4% for AGIs $50k-75k, 642.0% for AGIs $75k-100k, 2153.7% for AGIs $100k-200k, 47591.4% for AGIs over 200k)
Profit/loss from business: +$9,115 (reported on 18.0% of returns)
Here:
+$9,115
State:
+$9,719
(% of AGI for various income ranges: 162.0% for AGIs below $25k, 165.2% for AGIs $25k-50k, 223.3% for AGIs $50k-75k, 261.9% for AGIs $75k-100k, 527.5% for AGIs $100k-200k, 3041.4% for AGIs over 200k)
Taxable individual retirement arrangement distribution: $23,527 (reported on 29.0% of returns)
33437:
$23,527
Florida:
$24,823
(% of AGI for various income ranges: 251.5% for AGIs below $25k, 492.8% for AGIs $25k-50k, 894.5% for AGIs $50k-75k, 1716.2% for AGIs $75k-100k, 3132.1% for AGIs $100k-200k, 11516.4% for AGIs over 200k)
Self-employed (Keogh) retirement plans: $19,245 (reported on 0.5% of returns)
33437:
$19,245
Florida:
$29,694
(% of AGI for various income ranges: 18.4% for AGIs $50k-75k, 41.7% for AGIs $100k-200k, 404.6% for AGIs over 200k)
Total itemized deductions: $35,797 (reported on 13.5% of returns)
Here:
$35,797
State:
$45,393
(% of AGI for various income ranges: 272.8% for AGIs below $25k, 428.5% for AGIs $25k-50k, 753.7% for AGIs $50k-75k, 1262.6% for AGIs $75k-100k, 1851.1% for AGIs $100k-200k, 7502.9% for AGIs over 200k)
Charity contributions: $7,184 (reported on 11.8% of returns)
Here:
$7,184
State:
$20,178
(% of AGI for various income ranges: 14.1% for AGIs below $25k, 40.8% for AGIs $25k-50k, 78.8% for AGIs $50k-75k, 153.8% for AGIs $75k-100k, 307.4% for AGIs $100k-200k, 2730.0% for AGIs over 200k)
Taxes paid: $6,152 (reported on 13.4% of returns)
33437:
$6,152
State:
$6,967
(% of AGI for various income ranges: 42.8% for AGIs below $25k, 77.7% for AGIs $25k-50k, 138.4% for AGIs $50k-75k, 238.4% for AGIs $75k-100k, 340.4% for AGIs $100k-200k, 987.9% for AGIs over 200k)
Earned income credit: $2,162 (reported on 8.8% of returns)
Here:
$2,162
State:
$2,306
(% of AGI for various income ranges: 83.8% for AGIs below $25k, 46.4% for AGIs $25k-50k)
Percentage of individuals using paid preparers for their 2020 taxes: 91.5%
Here:
92%
State:
92%
(% for various income ranges: 91.0% for AGIs below $25k, 92.5% for AGIs $25k-50k, 91.2% for AGIs $50k-75k, 91.1% for AGIs $75k-100k, 91.4% for AGIs $100k-200k, 93.2% for AGIs over 200k)
Averages for the 2012 tax year for zip code 33437, filed in 2013:
Average Adjusted Gross Income (AGI) in 2012: $67,222 (Individual Income Tax Returns)
Here:
$67,222
State:
$60,316
Salary/wage: $45,013 (reported on 48.5% of returns)
Here:
$45,013
State:
$45,277
(% of AGI for various income ranges: 47.4% for AGIs below $25k, 47.2% for AGIs $25k-50k, 37.1% for AGIs $50k-75k, 30.4% for AGIs $75k-100k, 30.5% for AGIs $100k-200k, 21.6% for AGIs over 200k)
Taxable interest for individuals: $4,749 (reported on 58.6% of returns)
This zip code:
$4,749
Florida:
$3,587
(% of AGI for various income ranges: 6.3% for AGIs below $25k, 4.4% for AGIs $25k-50k, 3.9% for AGIs $50k-75k, 3.7% for AGIs $75k-100k, 3.8% for AGIs $100k-200k, 4.4% for AGIs over 200k)
Ordinary dividends: $10,411 (reported on 50.2% of returns)
Here:
$10,411
State:
$12,831
(% of AGI for various income ranges: 10.6% for AGIs below $25k, 7.1% for AGIs $25k-50k, 7.2% for AGIs $50k-75k, 7.3% for AGIs $75k-100k, 7.1% for AGIs $100k-200k, 9.1% for AGIs over 200k)
Net capital gain/loss in AGI: +$9,087 (reported on 47.5% of returns)
Here:
+$9,087
State:
+$33,493
(% of AGI for various income ranges: 0.8% for AGIs $75k-100k, 2.8% for AGIs $100k-200k, 26.5% for AGIs over 200k)
Profit/loss from business: +$9,988 (reported on 14.1% of returns)
Here:
+$9,988
State:
+$10,012
(% of AGI for various income ranges: 6.0% for AGIs below $25k, 2.4% for AGIs $25k-50k, 1.6% for AGIs $50k-75k, 1.6% for AGIs $75k-100k, 1.7% for AGIs $100k-200k, 1.9% for AGIs over 200k)
Taxable individual retirement arrangement distribution: $20,925 (reported on 42.0% of returns)
33437:
$20,925
Florida:
$21,544
(% of AGI for various income ranges: 16.1% for AGIs below $25k, 12.1% for AGIs $25k-50k, 12.1% for AGIs $50k-75k, 12.8% for AGIs $75k-100k, 14.5% for AGIs $100k-200k, 11.5% for AGIs over 200k)
Self-employment retirement plans: $16,042 (reported on 0.6% of returns)
33437:
$16,042
Florida:
$20,611
(% of AGI for various income ranges: 0.1% for AGIs $25k-50k, 0.2% for AGIs $100k-200k, 0.3% for AGIs over 200k)
Total itemized deductions: $23,304 (25% of AGI, reported on 44.8% of returns)
Here:
$23,304
State:
$25,533
Here:
24.8% of AGI
State:
18.0% of AGI
(% of AGI for various income ranges: 30.0% for AGIs below $25k, 21.8% for AGIs $25k-50k, 17.8% for AGIs $50k-75k, 15.6% for AGIs $75k-100k, 13.4% for AGIs $100k-200k, 9.7% for AGIs over 200k)
Charity contributions: $3,007 (reported on 39.6% of returns)
Here:
$3,007
State:
$5,698
(% of AGI for various income ranges: 1.5% for AGIs below $25k, 1.7% for AGIs $25k-50k, 1.8% for AGIs $50k-75k, 1.6% for AGIs $75k-100k, 1.8% for AGIs $100k-200k, 2.0% for AGIs over 200k)
Taxes paid: $5,917 (reported on 44.2% of returns)
33437:
$5,917
State:
$6,203
(% of AGI for various income ranges: 5.3% for AGIs below $25k, 4.4% for AGIs $25k-50k, 3.9% for AGIs $50k-75k, 3.9% for AGIs $75k-100k, 3.8% for AGIs $100k-200k, 3.3% for AGIs over 200k)
Earned income credit: $2,024 (reported on 9.0% of returns)
Here:
$2,024
State:
$2,372
(% of AGI for various income ranges: 3.6% for AGIs below $25k, 0.5% for AGIs $25k-50k)
Percentage of individuals using paid preparers for their 2012 taxes: 69.0%
Here:
69%
State:
54%
(% for various income ranges: 66.8% for AGIs below $25k, 67.8% for AGIs $25k-50k, 68.8% for AGIs $50k-75k, 69.9% for AGIs $75k-100k, 72.1% for AGIs $100k-200k, 80.9% for AGIs over 200k)
Averages for the 2004 tax year for zip code 33437, filed in 2005:
Average Adjusted Gross Income (AGI) in 2004: $58,273 (Individual Income Tax Returns)
Here:
$58,273
State:
$50,523
Salary/wage: $42,936 (reported on 52.3% of returns)
Here:
$42,936
State:
$39,563
(% of AGI for various income ranges: 40.1% for AGIs $10k-25k, 44.6% for AGIs $25k-50k, 39.4% for AGIs $50k-75k, 38.6% for AGIs $75k-100k, 34.2% for AGIs over 100k)
Taxable interest for individuals: $5,699 (reported on 72.6% of returns)
This zip code:
$5,699
Florida:
$3,211
(% of AGI for various income ranges: 12.0% for AGIs $10k-25k, 8.2% for AGIs $25k-50k, 6.8% for AGIs $50k-75k, 6.1% for AGIs $75k-100k, 5.9% for AGIs over 100k)
Taxable dividends: $6,591 (reported on 57.7% of returns)
Here:
$6,591
State:
$6,129
(% of AGI for various income ranges: 10.6% for AGIs $10k-25k, 7.0% for AGIs $25k-50k, 6.1% for AGIs $50k-75k, 5.2% for AGIs $75k-100k, 5.8% for AGIs over 100k)
Net capital gain/loss: +$8,410 (reported on 54.2% of returns)
Here:
+$8,410
State:
+$27,205
(% of AGI for various income ranges: -2.1% for AGIs $10k-25k, 0.0% for AGIs $25k-50k, 1.0% for AGIs $50k-75k, 2.6% for AGIs $75k-100k, 16.5% for AGIs over 100k)
Profit/loss from business: +$9,538 (reported on 14.1% of returns)
Here:
+$9,538
State:
+$10,634
(% of AGI for various income ranges: 5.0% for AGIs $10k-25k, 2.6% for AGIs $25k-50k, 1.9% for AGIs $50k-75k, 2.0% for AGIs $75k-100k, 2.0% for AGIs over 100k)
IRA payment deduction: $3,673 (reported on 3.4% of returns)
33437:
$3,673
Florida:
$3,082
(% of AGI for various income ranges: 0.3% for AGIs $10k-25k, 0.4% for AGIs $25k-50k, 0.3% for AGIs $50k-75k, 0.2% for AGIs $75k-100k, 0.1% for AGIs over 100k)
Self-employed pension: $12,398 (reported on 0.7% of returns)
Here:
$12,398
Florida:
$15,857
(% of AGI for various income ranges: 0.1% for AGIs $25k-50k, 0.1% for AGIs $50k-75k, 0.1% for AGIs $75k-100k, 0.2% for AGIs over 100k)
Total itemized deductions: $19,332 (26% of AGI, reported on 53.3% of returns)
Here:
$19,332
State:
$20,370
Here:
25.6% of AGI
State:
20.7% of AGI
(% of AGI for various income ranges: 35.1% for AGIs $10k-25k, 26.1% for AGIs $25k-50k, 20.0% for AGIs $50k-75k, 16.4% for AGIs $75k-100k, 10.8% for AGIs over 100k)
Charity contributions deductions: $2,662 (3% of AGI, reported on 49.1% of returns)
Here:
$2,662
State:
$4,064
Here:
3.4% of AGI
State:
3.8% of AGI
(% of AGI for various income ranges: 2.5% for AGIs $10k-25k, 2.4% for AGIs $25k-50k, 2.4% for AGIs $50k-75k, 2.1% for AGIs $75k-100k, 2.1% for AGIs over 100k)
Total tax: $9,199 (reported on 78.5% of returns)
33437:
$9,199
State:
$9,431
(% of AGI for various income ranges: 2.9% for AGIs $10k-25k, 6.1% for AGIs $25k-50k, 9.0% for AGIs $50k-75k, 10.9% for AGIs $75k-100k, 17.4% for AGIs over 100k)
Earned income credit: $1,457 (reported on 5.5% of returns)
Here:
$1,457
State:
$1,808
Percentage of individuals using paid preparers for their 2004 taxes: 69.6%
Here:
70%
State:
60%
(% for various income ranges: 66.5% for AGIs below $10k, 71.1% for AGIs $10k-25k, 68.7% for AGIs $25k-50k, 68.8% for AGIs $50k-75k, 68.9% for AGIs $75k-100k, 73.6% for AGIs over 100k)
Likely homosexual households (counted as self-reported same-sex unmarried-partner households)
Lesbian couples: 0.0% of all households
Gay men: 0.1% of all households
Household received Food Stamps/SNAP in the past 12 months: 1,065 Household did not receive Food Stamps/SNAP in the past 12 months: 18,345
Women who had a birth in the past 12 months: 196 (117 now married, 77 unmarried) Women who did not have a birth in the past 12 months: 4,699 (1,937 now married, 2,761 unmarried)
Housing units in zip code 33437 with a mortgage: 7,009 (410 second mortgage, 8 home equity loan, 302 both second mortgage and home equity loan) Houses without a mortgage: 101
Median monthly owner costs for units with a mortgage: $1,914 Median monthly owner costs for units without a mortgage: $885
Residents with income below the poverty level in 2022:
This zip code:
6.5%
Whole state:
12.7%
Residents with income below 50% of the poverty level in 2022:
This zip code:
2.7%
Whole state:
6.6%
Median number of rooms in houses and condos:
Here:
5.8
State:
5.9
Median number of rooms in apartments:
Here:
4.2
State:
4.2
Notable locations in this zip code not listed on our city pages
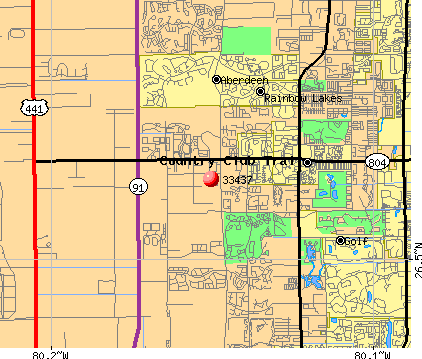
Notable locations in zip code 33437: Bonita Springs Golf Club (A), Bonaventure Country Club (B), Bocaire Country Club (C), Palm Beach County Fire Rescue Station 41 (D), Palm Beach County Fire Rescue Station 47 (E), Palm Beach County Fire Rescue Station 44 (F), Palm Beach County Library System West Boynton Branch Library (G), Saint Vincent de Paul Regional Seminary Library (H). Display/hide their locations on the map
2,096 married couples with children.
668 single-parent households (83 men, 585 women).
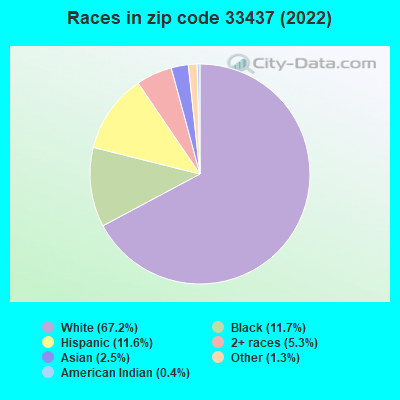
78.1% of residents of 33437 zip code speak English at home.
10.6% of residents speak Spanish at home (70% very well, 14% well, 11% not well, 5% not at all).
10.7% of residents speak other Indo-European language at home (52% very well, 16% well, 14% not well, 18% not at all).
1.3% of residents speak Asian or Pacific Island language at home (58% very well, 23% well, 19% not well).
0.7% of residents speak other language at home (86% very well, 6% well, 8% not well).
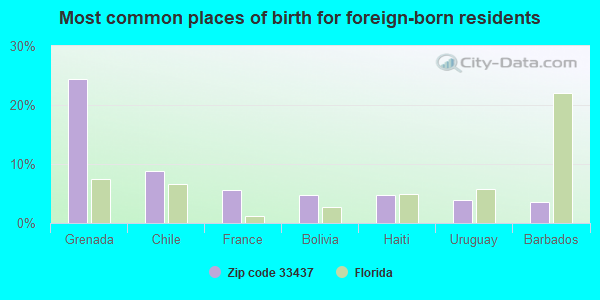
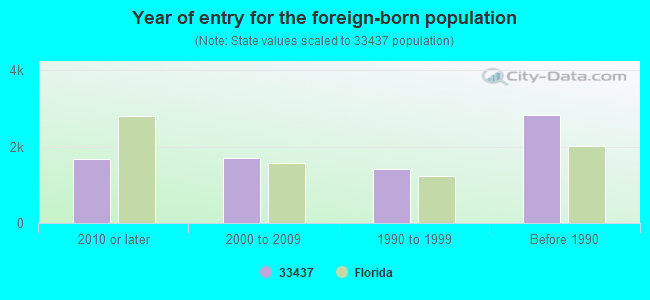
Foreign born population: 7,564 (19.3%) (68.0% of them are naturalized citizens)
Major facilities with environmental interests located in this zip code:
HAGEN ROAD ELEMENTARY SCHOOL (10439 HAGEN RANCH RD in BOYNTON BEACH, FL)
(National Center for Education Statistics) - STATE ID-1421 Small Quantity Generators, between 100 kg and 1000 kg of hazardous waste/month (Resource Conservation and Recovery Act (tracking hazardous waste)) - notification Organizations: SNYDER MICHAEL ENV (CONTACT/OWNER)
, PALM BEACH COUNTY SCHOOL DISTRICT (SCHOOL DISTRICT)
Alternative names: PALM BEACH CO HAGEN RD ELEM
CHRISTA MCAULIFFE MIDDLE SCHOOL (6500 LE CHALET BLVD in BOYNTON BEACH, FL)
(National Center for Education Statistics) - STATE ID-1821 Small Quantity Generators, between 100 kg and 1000 kg of hazardous waste/month (Resource Conservation and Recovery Act (tracking hazardous waste)) - notification Organizations: SNYDER MICHAEL ENV (CONTACT/OWNER)
, PALM BEACH COUNTY SCHOOL DISTRICT (SCHOOL DISTRICT)
Alternative names: PALM BEACH CO MCAULIFFE MIDDLE
ODYSSEY MIDDLE SCHOOL (6161 WEST WOOLBRIGHT RD in BOYNTON BEACH, FL)
(National Center for Education Statistics) - STATE ID-2601 Organizations: PALM BEACH COUNTY SCHOOL DISTRICT (SCHOOL DISTRICT)
CRYSTAL LAKES ELEMENTARY SCHOOL (6050 GATEWAY BLVD in BOYNTON BEACH, FL)
(National Center for Education Statistics) - STATE ID-2121 Organizations: PALM BEACH COUNTY SCHOOL DISTRICT (SCHOOL DISTRICT)
PALM BEACH COUNTY WATER UTILITIES DEPT. (12751 HAGEN RANCH ROAD in BOYNTON BEACH, FL)
AIR SYNTHETIC MINOR (AIRS/AFS) CRITERIA AND HAZARDOUS AIR POLLUTANT INVENTORY (Inventory of air pollution sources) National Pollutant Discharge Elimination System NON-MAJOR (Tracking pollutant discharge elimination systems) - permit Business SIC classification: SEWERAGE SYSTEMS; REFUSE SYSTEMS Business NAICS classification: SEWAGE TREATMENT FACILITIES. Organizations: LARRY JOHNSON (CONTACT/OWNER)
Alternative names: PBC SOUTHERN REGION WATER RECLAMATION FACILITY, SOUTHERN REGION WATER RECLAM F, SOUTHERN REGION WATER RECLAMAT
HAGEN RANCH ROAD (W ATLANTIC AVE TO N OF LAKE ID in BOYNTON BEACH, FL)
National Pollutant Discharge Elimination System NON-MAJOR (Tracking pollutant discharge elimination systems) - permit Organizations: OMELIO FERNANDEZ (CONTACT/OWNER)
HANWOOL INC (7410 WEST BOYNTON BEACH BOULEVARD in BOYNTON BEACH, FL)
AIR MINOR (AIRS/AFS) Small Quantity Generators, between 100 kg and 1000 kg of hazardous waste/month (Resource Conservation and Recovery Act (tracking hazardous waste)) - notification Business SIC classification: DRYCLEANING PLANTS, EXCEPT RUG CLEANING Organizations: VINCENT PRESIPRCO (CONTACT/OWNER)
Alternative names: HAGEN RANCH CLEANERS, HAGEN RANCH DRY CLEANERS INC
LYONS RD. & PINEHUEST DR. PIPE (BOYTON BEACH BLVD. & LYONS RD. in WEST PALM BEACH, FL)
National Pollutant Discharge Elimination System NON-MAJOR (Tracking pollutant discharge elimination systems) - permit Organizations: DAN SMOLIK (CONTACT/OWNER)
LYONS WEST AGR-PUD (E OF LWDD E-1 CANAL, W OF LYON in BOYNTON BEACH, FL)
National Pollutant Discharge Elimination System NON-MAJOR (Tracking pollutant discharge elimination systems) - permit Organizations: RICK ELSNER (CONTACT/OWNER)
ASGROW FLORIDA CO (9293 STATE ROAD 7 in BOYNTON BEACH, FL)
(Resource Conservation and Recovery Act (tracking hazardous waste)) Organizations: WILLIAM J STONE, SAFETY COORD (CONTACT/OWNER)
GREEN CAY VILLAGE (INTERSECTION OF JOG ROAD ANDFL in BOYNTON BEACH, FL)
National Pollutant Discharge Elimination System NON-MAJOR (Tracking pollutant discharge elimination systems) - permit Organizations: SHAWN WILSON (CONTACT/OWNER)
Alternative names: CYPRESS CREEK DRI
JOSEPH RUBIN MEMORIAL CHAPEL (7340 BOYNTON BEACH BLVD in BOYNTON BEACH, FL)
National Pollutant Discharge Elimination System NON-MAJOR (Tracking pollutant discharge elimination systems) - permit
MARLIN SUBSTATION (N OF S 100TH ST, W OF SR 7 (US in BOYNTON BCH, FL)
National Pollutant Discharge Elimination System NON-MAJOR (Tracking pollutant discharge elimination systems) - permit Organizations: DEAN BUSCH (CONTACT/OWNER)
Housing units lacking complete plumbing facilities: 0.0% Housing units lacking complete kitchen facilities: 0.0%
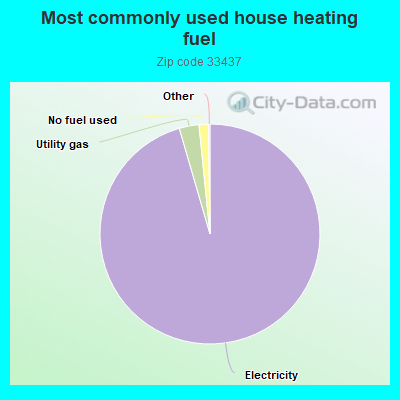
95.5%Electricity
2.9%Utility gas
1.4%No fuel used
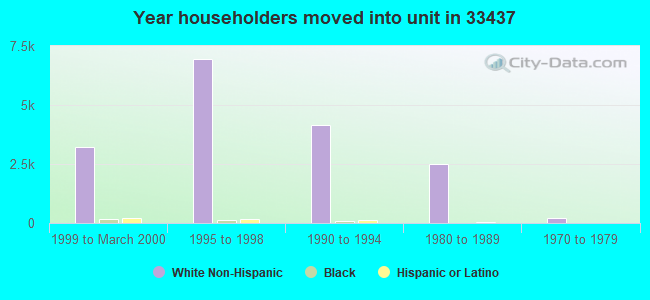
Population in 1990: 14,809. Population change in the 1990s: +24,403 (+164.8%).
Place of birth for U.S.-born residents:
This state: 5,986
Northeast: 20,728
Midwest: 2,583
South: 1,683
West: 527
47% of the 33437 zip code residents lived in the same house 5 years ago. Out of people who lived in different houses, 35% lived in this county. Out of people who lived in different counties, 50% lived in Florida.
89% of the 33437 zip code residents lived in the same house 1 year ago. Out of people who lived in different houses, 40% moved from this county. Out of people who lived in different houses, 11% moved from different county within same state. Out of people who lived in different houses, 40% moved from different state. Out of people who lived in different houses, 12% moved from abroad.
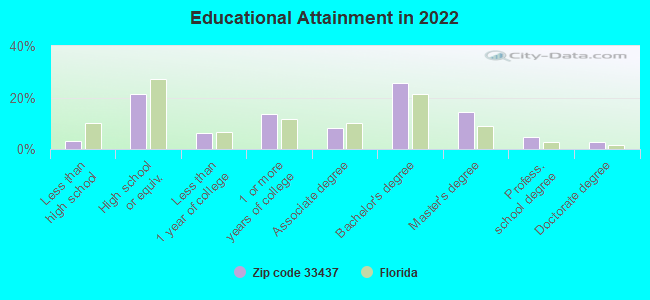
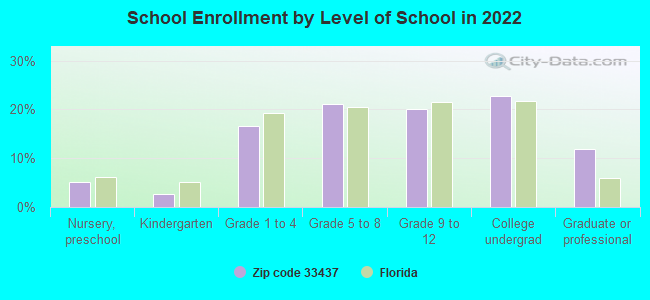
Private vs. public school enrollment:
Students in private schools in grades 1 to 8 (elementary and middle school): 37
Here:
2.7%
Florida:
15.8%
Students in private schools in grades 9 to 12 (high school): 167
Here:
21.9%
Florida:
12.9%
Students in private undergraduate colleges: 104
Here:
12.3%
Florida:
23.6%
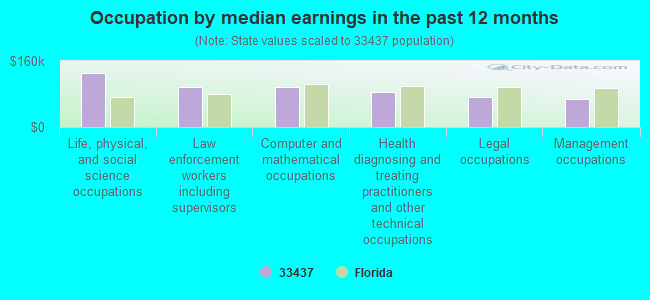
Occupation by median earnings in the past 12 months ($)
130,121Life, physical, and social science occupations
97,358Law enforcement workers including supervisors
96,283Computer and mathematical occupations
84,541Health diagnosing and treating practitioners and other technical occupations
73,653Legal occupations
67,972Management occupations
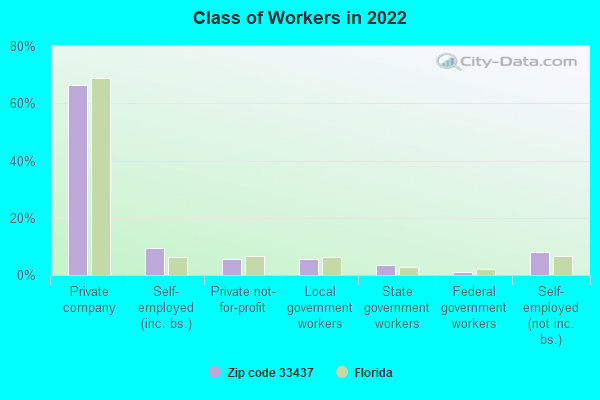
Companies with federal contracts located in this zip code:
THE SKARP CORPORATION (10473 COPPER LAKE WAY in BOYNTON BEACH, FL; small business)
$29,706 with Navy for Engineering and Technical Services. Signed on 2000-07-07. Completion date: 2000-09-30.
RIO VILLAGE MHP, LLC (6748 COBRA CIR in BOYNTON BEACH, FL; small business) : $27,360 in 2 contractsfrom 2005 to 2006
$27,360 with Federal Emergency Management Agency for Lease or Rental of Equipment -- Ground Effect Vehicles, Motor Vehicles, Trailers, and Cycles. Signed on 2005-12-08. Effective on 2005-10-01. Completion date: 2006-09-30.
$0, same as above.Signed on 2006-03-30. Completion date: 2010-09-30.
ATR, INC (6633 ARNO WAY in BOYNTON BEACH, FL; small business)
$4,297 with Army for Radio and Television Communication Equipment, Except Airborne. Signed on 2003-04-11. Completion date: 2003-04-30.
Top industries in this zip code by the number of employees in 2005:
Administrative and Support and Waste Management and Remediation Services: Landscaping Services (50-99 employees: 3 establishments, 20-49 employees: 4 establishments, 5-9 employees: 4 establishments, 1-4 employees: 11 establishments)
2006 - 2018 National Fire Incident Reporting System (NFIRS) incidents
According to the data from the years 2006 - 2018 the average number of fires per year is 27. The highest number of reported fire incidents - 41 took place in 2016, and the least - 9 in 2010. The data has a rising trend.
When looking into fire subcategories, the most reports belonged to: Structure Fires (36.5%), and Outside Fires (31.0%).
Fire incident types reported to NFIRS in Zip Code 33437


 Nearest zip codes: 33436, 33473, 33472, 33484, 33426, 33445.
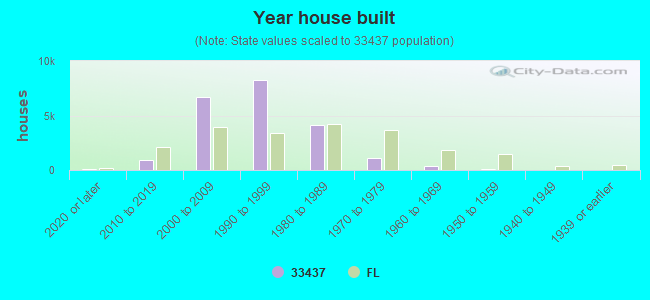


 According to the data from the years 2006 - 2018 the average number of fires per year is 27. The highest number of reported fire incidents - 41 took place in 2016, and the least - 9 in 2010. The data has a rising trend.
 When looking into fire subcategories, the most reports belonged to: Structure Fires (36.5%), and Outside Fires (31.0%).