Estimated zip code population in 2022: 48,948 Zip code population in 2010: 41,896 Zip code population in 2000: 35,683
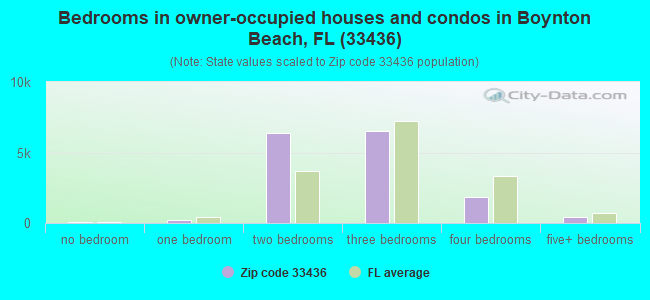
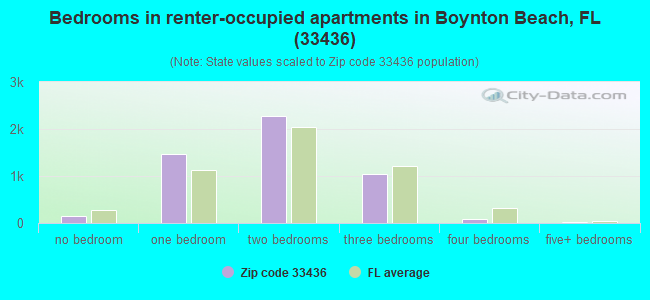
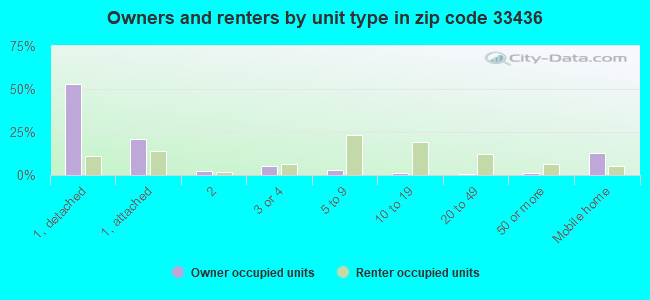
Houses and condos: 24,245 Renter-occupied apartments: 5,051
% of renters here:
25%
State:
33%
March 2022 cost of living index in zip code 33436: 100.9 (near average, U.S. average is 100)
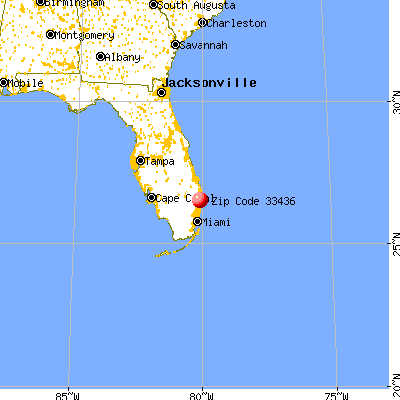
Land area: 11.7 sq. mi. Water area: 0.1 sq. mi.
Population density: 4,179 people per square mile
(average).
OSM Map
General Map
Google Map
MSN Map
OSM Map
General Map
Google Map
MSN Map
OSM Map
General Map
Google Map
MSN Map
OSM Map
General Map
Google Map
MSN Map
Please wait while loading the map...
Real estate property taxes paid for housing units in 2022:
This zip code:
0.7% ($2,754)
Florida:
0.7% ($2,529)
Median real estate property taxes paid for housing units with mortgages in 2022: $3,168 (0.8%) Median real estate property taxes paid for housing units with no mortgage in 2022: $2,115 (0.7%)
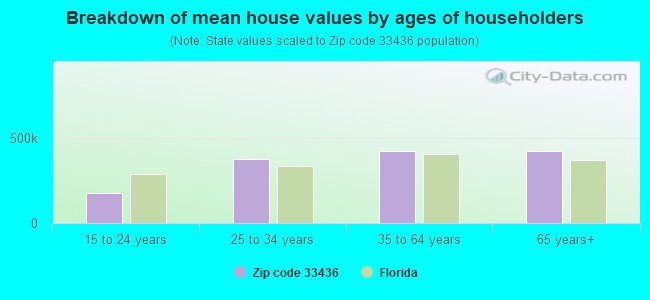
Estimated median house/condo value in 2022: $375,550
33436:
$375,550
Florida:
$354,100
According to our research of Florida and other state lists, there were 16 registered sex offenders living in 33436 zip code as of April 27, 2024. The ratio of all residents to sex offenders in zip code 33436 is 2,784 to 1. The ratio of registered sex offenders to all residents in this zip code is much lower than the state average.
Median resident age:
This zip code:
45.7 years
Florida median age:
42.7 years
Average household size:
This zip code:
2.4 people
Florida:
2.5 people
Averages for the 2020 tax year for zip code 33436, filed in 2021:
Average Adjusted Gross Income (AGI) in 2020: $83,099 (Individual Income Tax Returns)
Here:
$83,099
State:
$82,200
Salary/wage: $58,170 (reported on 73.2% of returns)
Here:
$58,170
State:
$58,347
(% of AGI for various income ranges: 1200.3% for AGIs below $25k, 3684.0% for AGIs $25k-50k, 6451.2% for AGIs $50k-75k, 9474.4% for AGIs $75k-100k, 16986.2% for AGIs $100k-200k, 86611.0% for AGIs over 200k)
Taxable interest for individuals: $3,915 (reported on 27.6% of returns)
This zip code:
$3,915
Florida:
$4,272
(% of AGI for various income ranges: 23.2% for AGIs below $25k, 34.7% for AGIs $25k-50k, 67.3% for AGIs $50k-75k, 143.7% for AGIs $75k-100k, 325.2% for AGIs $100k-200k, 4915.2% for AGIs over 200k)
Ordinary dividends: $20,355 (reported on 24.1% of returns)
Here:
$20,355
State:
$15,863
(% of AGI for various income ranges: 56.6% for AGIs below $25k, 88.0% for AGIs $25k-50k, 202.0% for AGIs $50k-75k, 428.5% for AGIs $75k-100k, 1354.1% for AGIs $100k-200k, 26701.4% for AGIs over 200k)
Net capital gain/loss in AGI: +$62,190 (reported on 23.2% of returns)
Here:
+$62,190
State:
+$62,983
(% of AGI for various income ranges: 8.6% for AGIs below $25k, 45.3% for AGIs $25k-50k, 132.1% for AGIs $50k-75k, 331.0% for AGIs $75k-100k, 1098.8% for AGIs $100k-200k, 106943.4% for AGIs over 200k)
Profit/loss from business: +$8,443 (reported on 24.6% of returns)
Here:
+$8,443
State:
+$9,719
(% of AGI for various income ranges: 186.6% for AGIs below $25k, 88.5% for AGIs $25k-50k, 183.7% for AGIs $50k-75k, 217.5% for AGIs $75k-100k, 502.7% for AGIs $100k-200k, 6803.1% for AGIs over 200k)
Taxable individual retirement arrangement distribution: $26,057 (reported on 11.8% of returns)
33436:
$26,057
Florida:
$24,823
(% of AGI for various income ranges: 66.9% for AGIs below $25k, 118.1% for AGIs $25k-50k, 304.9% for AGIs $50k-75k, 603.2% for AGIs $75k-100k, 1485.7% for AGIs $100k-200k, 9083.8% for AGIs over 200k)
Self-employed (Keogh) retirement plans: $21,089 (reported on 0.4% of returns)
33436:
$21,089
Florida:
$29,694
(% of AGI for various income ranges: 26.6% for AGIs $100k-200k, 519.7% for AGIs over 200k)
Total itemized deductions: $41,226 (reported on 9.6% of returns)
Here:
$41,226
State:
$45,393
(% of AGI for various income ranges: 64.5% for AGIs below $25k, 182.9% for AGIs $25k-50k, 423.9% for AGIs $50k-75k, 781.1% for AGIs $75k-100k, 1326.7% for AGIs $100k-200k, 14509.7% for AGIs over 200k)
Charity contributions: $17,501 (reported on 7.9% of returns)
Here:
$17,501
State:
$20,178
(% of AGI for various income ranges: 3.1% for AGIs below $25k, 24.1% for AGIs $25k-50k, 60.6% for AGIs $50k-75k, 146.8% for AGIs $75k-100k, 266.5% for AGIs $100k-200k, 8172.4% for AGIs over 200k)
Taxes paid: $6,696 (reported on 9.4% of returns)
33436:
$6,696
State:
$6,967
(% of AGI for various income ranges: 10.5% for AGIs below $25k, 36.2% for AGIs $25k-50k, 85.5% for AGIs $50k-75k, 160.4% for AGIs $75k-100k, 290.4% for AGIs $100k-200k, 1467.9% for AGIs over 200k)
Earned income credit: $2,373 (reported on 17.2% of returns)
Here:
$2,373
State:
$2,306
(% of AGI for various income ranges: 120.1% for AGIs below $25k, 64.4% for AGIs $25k-50k, 0.8% for AGIs $50k-75k)
Percentage of individuals using paid preparers for their 2020 taxes: 92.5%
Here:
93%
State:
92%
(% for various income ranges: 90.5% for AGIs below $25k, 94.1% for AGIs $25k-50k, 93.6% for AGIs $50k-75k, 93.1% for AGIs $75k-100k, 92.7% for AGIs $100k-200k, 94.3% for AGIs over 200k)
Averages for the 2012 tax year for zip code 33436, filed in 2013:
Average Adjusted Gross Income (AGI) in 2012: $65,784 (Individual Income Tax Returns)
Here:
$65,784
State:
$60,316
Salary/wage: $46,933 (reported on 73.5% of returns)
Here:
$46,933
State:
$45,277
(% of AGI for various income ranges: 70.4% for AGIs below $25k, 76.4% for AGIs $25k-50k, 69.1% for AGIs $50k-75k, 66.8% for AGIs $75k-100k, 57.3% for AGIs $100k-200k, 26.9% for AGIs over 200k)
Taxable interest for individuals: $4,339 (reported on 34.3% of returns)
This zip code:
$4,339
Florida:
$3,587
(% of AGI for various income ranges: 2.5% for AGIs below $25k, 1.4% for AGIs $25k-50k, 1.4% for AGIs $50k-75k, 1.6% for AGIs $75k-100k, 2.1% for AGIs $100k-200k, 3.1% for AGIs over 200k)
Ordinary dividends: $17,304 (reported on 26.0% of returns)
Here:
$17,304
State:
$12,831
(% of AGI for various income ranges: 3.8% for AGIs below $25k, 2.4% for AGIs $25k-50k, 2.9% for AGIs $50k-75k, 3.9% for AGIs $75k-100k, 5.8% for AGIs $100k-200k, 11.9% for AGIs over 200k)
Net capital gain/loss in AGI: +$25,657 (reported on 23.4% of returns)
Here:
+$25,657
State:
+$33,493
(% of AGI for various income ranges: 0.5% for AGIs $50k-75k, 0.6% for AGIs $75k-100k, 2.6% for AGIs $100k-200k, 23.9% for AGIs over 200k)
Profit/loss from business: +$9,693 (reported on 18.0% of returns)
Here:
+$9,693
State:
+$10,012
(% of AGI for various income ranges: 7.6% for AGIs below $25k, 2.6% for AGIs $25k-50k, 1.9% for AGIs $50k-75k, 2.2% for AGIs $75k-100k, 1.7% for AGIs $100k-200k, 2.5% for AGIs over 200k)
Taxable individual retirement arrangement distribution: $27,155 (reported on 16.7% of returns)
33436:
$27,155
Florida:
$21,544
(% of AGI for various income ranges: 4.3% for AGIs below $25k, 3.6% for AGIs $25k-50k, 4.8% for AGIs $50k-75k, 6.0% for AGIs $75k-100k, 9.3% for AGIs $100k-200k, 8.2% for AGIs over 200k)
Self-employment retirement plans: $16,144 (reported on 0.4% of returns)
33436:
$16,144
Florida:
$20,611
(% of AGI for various income ranges: 0.1% for AGIs $25k-50k, 0.1% for AGIs $100k-200k, 0.2% for AGIs over 200k)
Total itemized deductions: $24,765 (19% of AGI, reported on 31.5% of returns)
Here:
$24,765
State:
$25,533
Here:
18.5% of AGI
State:
18.0% of AGI
(% of AGI for various income ranges: 11.9% for AGIs below $25k, 12.5% for AGIs $25k-50k, 13.7% for AGIs $50k-75k, 13.5% for AGIs $75k-100k, 13.4% for AGIs $100k-200k, 9.5% for AGIs over 200k)
Charity contributions: $4,967 (reported on 26.3% of returns)
Here:
$4,967
State:
$5,698
(% of AGI for various income ranges: 0.8% for AGIs below $25k, 1.2% for AGIs $25k-50k, 1.5% for AGIs $50k-75k, 1.9% for AGIs $75k-100k, 2.0% for AGIs $100k-200k, 2.7% for AGIs over 200k)
Taxes paid: $6,467 (reported on 30.6% of returns)
33436:
$6,467
State:
$6,203
(% of AGI for various income ranges: 2.1% for AGIs below $25k, 2.2% for AGIs $25k-50k, 2.8% for AGIs $50k-75k, 3.0% for AGIs $75k-100k, 3.6% for AGIs $100k-200k, 3.2% for AGIs over 200k)
Earned income credit: $2,321 (reported on 19.1% of returns)
Here:
$2,321
State:
$2,372
(% of AGI for various income ranges: 7.0% for AGIs below $25k, 0.9% for AGIs $25k-50k)
Percentage of individuals using paid preparers for their 2012 taxes: 63.3%
Here:
63%
State:
54%
(% for various income ranges: 63.5% for AGIs below $25k, 59.2% for AGIs $25k-50k, 60.5% for AGIs $50k-75k, 62.3% for AGIs $75k-100k, 67.3% for AGIs $100k-200k, 87.3% for AGIs over 200k)
Averages for the 2004 tax year for zip code 33436, filed in 2005:
Average Adjusted Gross Income (AGI) in 2004: $59,089 (Individual Income Tax Returns)
Here:
$59,089
State:
$50,523
Salary/wage: $43,312 (reported on 72.9% of returns)
Here:
$43,312
State:
$39,563
(% of AGI for various income ranges: 103.8% for AGIs below $10k, 66.4% for AGIs $10k-25k, 74.2% for AGIs $25k-50k, 69.2% for AGIs $50k-75k, 65.8% for AGIs $75k-100k, 36.5% for AGIs over 100k)
Taxable interest for individuals: $4,705 (reported on 50.2% of returns)
This zip code:
$4,705
Florida:
$3,211
(% of AGI for various income ranges: 14.1% for AGIs below $10k, 5.5% for AGIs $10k-25k, 3.1% for AGIs $25k-50k, 3.1% for AGIs $50k-75k, 3.3% for AGIs $75k-100k, 4.3% for AGIs over 100k)
Taxable dividends: $10,907 (reported on 34.0% of returns)
Here:
$10,907
State:
$6,129
(% of AGI for various income ranges: 12.7% for AGIs below $10k, 4.2% for AGIs $10k-25k, 2.8% for AGIs $25k-50k, 3.2% for AGIs $50k-75k, 4.1% for AGIs $75k-100k, 9.0% for AGIs over 100k)
Net capital gain/loss: +$20,379 (reported on 31.2% of returns)
Here:
+$20,379
State:
+$27,205
(% of AGI for various income ranges: -4.7% for AGIs below $10k, -0.2% for AGIs $10k-25k, 0.3% for AGIs $25k-50k, 0.7% for AGIs $50k-75k, 2.5% for AGIs $75k-100k, 20.8% for AGIs over 100k)
Profit/loss from business: +$10,027 (reported on 14.4% of returns)
Here:
+$10,027
State:
+$10,634
(% of AGI for various income ranges: 13.6% for AGIs below $10k, 5.0% for AGIs $10k-25k, 2.2% for AGIs $25k-50k, 1.7% for AGIs $50k-75k, 2.1% for AGIs $75k-100k, 2.2% for AGIs over 100k)
IRA payment deduction: $3,031 (reported on 3.0% of returns)
33436:
$3,031
Florida:
$3,082
(% of AGI for various income ranges: 0.2% for AGIs below $10k, 0.2% for AGIs $10k-25k, 0.3% for AGIs $25k-50k, 0.2% for AGIs $50k-75k, 0.2% for AGIs $75k-100k, 0.1% for AGIs over 100k)
Self-employed pension: $15,929 (reported on 0.5% of returns)
Here:
$15,929
Florida:
$15,857
(% of AGI for various income ranges: 0.1% for AGIs $10k-25k, 0.1% for AGIs $50k-75k, 0.1% for AGIs $75k-100k, 0.2% for AGIs over 100k)
Total itemized deductions: $20,252 (21% of AGI, reported on 41.4% of returns)
Here:
$20,252
State:
$20,370
Here:
21.2% of AGI
State:
20.7% of AGI
(% of AGI for various income ranges: 29.6% for AGIs below $10k, 16.6% for AGIs $10k-25k, 17.2% for AGIs $25k-50k, 17.2% for AGIs $50k-75k, 17.0% for AGIs $75k-100k, 11.0% for AGIs over 100k)
Charity contributions deductions: $4,230 (4% of AGI, reported on 36.6% of returns)
Here:
$4,230
State:
$4,064
Here:
4.2% of AGI
State:
3.8% of AGI
(% of AGI for various income ranges: 1.3% for AGIs below $10k, 1.5% for AGIs $10k-25k, 1.9% for AGIs $25k-50k, 2.1% for AGIs $50k-75k, 2.3% for AGIs $75k-100k, 3.2% for AGIs over 100k)
Total tax: $10,490 (reported on 76.7% of returns)
33436:
$10,490
State:
$9,431
(% of AGI for various income ranges: 3.7% for AGIs below $10k, 3.7% for AGIs $10k-25k, 7.0% for AGIs $25k-50k, 9.5% for AGIs $50k-75k, 10.9% for AGIs $75k-100k, 19.2% for AGIs over 100k)
Earned income credit: $1,667 (reported on 12.1% of returns)
Here:
$1,667
State:
$1,808
Percentage of individuals using paid preparers for their 2004 taxes: 62.3%
Here:
62%
State:
60%
(% for various income ranges: 57.1% for AGIs below $10k, 64.0% for AGIs $10k-25k, 58.5% for AGIs $25k-50k, 60.5% for AGIs $50k-75k, 63.6% for AGIs $75k-100k, 75.7% for AGIs over 100k)
Likely homosexual households (counted as self-reported same-sex unmarried-partner households)
Lesbian couples: 0.3% of all households
Gay men: 0.1% of all households
Household received Food Stamps/SNAP in the past 12 months: 1,745 Household did not receive Food Stamps/SNAP in the past 12 months: 18,881
Women who had a birth in the past 12 months: 463 (302 now married, 160 unmarried) Women who did not have a birth in the past 12 months: 9,176 (3,397 now married, 5,778 unmarried)
Housing units in zip code 33436 with a mortgage: 7,363 (673 second mortgage, 8 home equity loan, 659 both second mortgage and home equity loan) Houses without a mortgage: 85
Median monthly owner costs for units with a mortgage: $1,939 Median monthly owner costs for units without a mortgage: $775
Residents with income below the poverty level in 2022:
This zip code:
8.4%
Whole state:
12.7%
Residents with income below 50% of the poverty level in 2022:
This zip code:
4.1%
Whole state:
6.6%
Median number of rooms in houses and condos:
Here:
5.5
State:
5.9
Median number of rooms in apartments:
Here:
4.3
State:
4.2
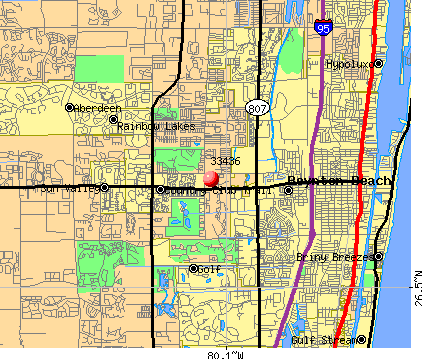
Notable locations in this zip code not listed on our city pages
Notable locations in zip code 33436: Paz Plaza (A), Bonita Fairways Country Club (B), Bonita Bay Club (C), Boca Woods Country Club (D), Boca Teeca Country Club (E), Boca Rio Golf Club (F), Boca Raton Municipal Golf Course (G), Boynton Trail Centre (H), Boynton Beach Fire Rescue Station 2 (I), Boynton Beach Fire and Rescue Station 3 (J), Palm Beach County Sheriff's Office Substation (K). Display/hide their locations on the map
5,472 married couples with children.
2,227 single-parent households (563 men, 1,664 women).
65.6% of residents of 33436 zip code speak English at home.
14.0% of residents speak Spanish at home (63% very well, 17% well, 15% not well, 5% not at all).
16.9% of residents speak other Indo-European language at home (64% very well, 25% well, 9% not well, 2% not at all).
1.6% of residents speak Asian or Pacific Island language at home (49% very well, 36% well, 11% not well, 4% not at all).
2.4% of residents speak other language at home (80% very well, 9% well, 5% not well, 6% not at all).
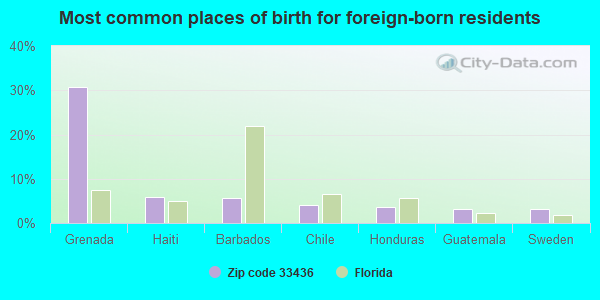
Foreign born population: 12,823 (26.2%) (57.5% of them are naturalized citizens)
This zip code:
26.2%
Whole state:
21.7%
31%Grenada
6%Haiti
6%Barbados
4%Chile
4%Honduras
3%Guatemala
3%Sweden
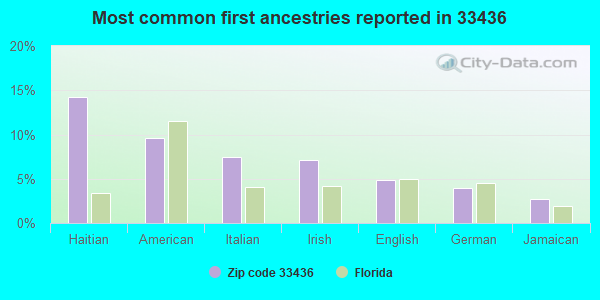
14%Haitian
10%American
7%Italian
7%Irish
5%English
4%German
3%Jamaican
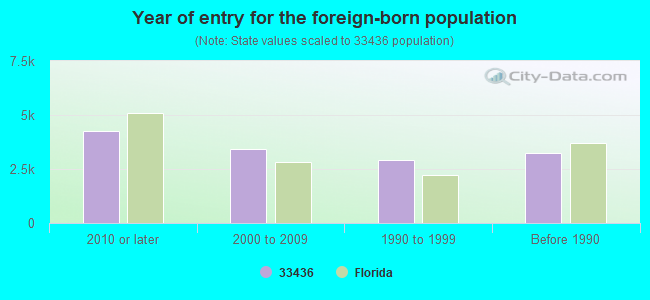
Year of entry for the foreign-born population
4,2642010 or later
3,4172000 to 2009
2,8941990 to 1999
3,256Before 1990
Major facilities with environmental interests located in this zip code:
GROVE PLAZA C LLC (SE CORNER OF HYPOLUXO RD & LAW in BOYNTON BEACH, FL)
National Pollutant Discharge Elimination System NON-MAJOR (Tracking pollutant discharge elimination systems) - permit National Pollutant Discharge Elimination System NON-MAJOR (Tracking pollutant discharge elimination systems) - permit Organizations: DALE GOLDSTEIN (CONTACT/OWNER)
Alternative names: GROVE PLAZA D LLC
CITRUS COVE ELEMENTARY SCHOOL (8400 LAWRENCE RD in BOYNTON BEACH, FL)
(National Center for Education Statistics) - STATE ID-2071 Small Quantity Generators, between 100 kg and 1000 kg of hazardous waste/month (Resource Conservation and Recovery Act (tracking hazardous waste)) - notification Organizations: MICHAEL SNYDER, ENVC (CONTACT/OWNER)
, PALM BEACH COUNTY SCHOOL DISTRICT (SCHOOL DISTRICT)
Alternative names: PALM BEACH CO CITRUS GROVE ELEM
GROVE PLAZA B LLC (SE CORNER OF HYPOLUXO RD & LAW in BOYNTON BEACH, FL)
National Pollutant Discharge Elimination System NON-MAJOR (Tracking pollutant discharge elimination systems) - permit Organizations: DALE GOLDSTEIN (CONTACT/OWNER)
MARCH 15 CORPORATION (3517 WEST BOYNTON BEACH BLVD in BOYNTON BEACH, FL)
AIR MINOR (AIRS/AFS) Small Quantity Generators, between 100 kg and 1000 kg of hazardous waste/month (Resource Conservation and Recovery Act (tracking hazardous waste)) - notification Business SIC classification: DRYCLEANING PLANTS, EXCEPT RUG CLEANING Organizations: HOWARD BROWN (CONTACT/OWNER)
Alternative names: GREENTREE CLEANERS, GREENTREE DRY CLEANERS
MONTREUX UNIT 21 DEVELOPMENT (BARWICK/RIDGEWOOD in BOYNTON, FL)
National Pollutant Discharge Elimination System NON-MAJOR (Tracking pollutant discharge elimination systems) - permit Organizations: MIKE SMOLAK (CONTACT/OWNER)
MONTREUX UNIT 21 RESIDENTIAL (BARWICK/RIDGEWOOD in BOYNTON, FL)
National Pollutant Discharge Elimination System NON-MAJOR (Tracking pollutant discharge elimination systems) - permit Organizations: MIKE SMOLAK (CONTACT/OWNER)
(SEC 13, TWP 45S, RNG 42E) KNO (S13 T45S R42E in BOYNTON BEACH, FL)
National Pollutant Discharge Elimination System NON-MAJOR (Tracking pollutant discharge elimination systems) - permit Organizations: PAUL ROMANOWSKI (CONTACT/OWNER)
ANDERSON, P.U.D., S 12, T45S, (W SIDE OF LARENCE ROAD ON THE in BOYTON BEACH, FL)
National Pollutant Discharge Elimination System NON-MAJOR (Tracking pollutant discharge elimination systems) - permit Organizations: PAUL ROMANOWSKI (CONTACT/OWNER)
ASPEN GLEN (7216 LAWRENCE ROAD in BOYNTON BEACH, FL)
National Pollutant Discharge Elimination System NON-MAJOR (Tracking pollutant discharge elimination systems) - permit Organizations: LEONARD ALBANESE (CONTACT/OWNER)
KIMCO REALTY CORP - SITE #005 (9777 S MILITARY TRL in BOYNTON BEACH, FL)
National Pollutant Discharge Elimination System NON-MAJOR (Tracking pollutant discharge elimination systems) - permit Organizations: CYNTHIA PHILLIPS (CONTACT/OWNER)
RENAISSANCE COMMONS (S. OF GATEWAY BLVD., E OF CONG in BOYNTON BEACH, FL)
National Pollutant Discharge Elimination System NON-MAJOR (Tracking pollutant discharge elimination systems) - permit Organizations: JAMES COMPARATO (CONTACT/OWNER)
RENAISSANCE COMMONS, S 20, T45 (SOUTH OF GATEWAY BLVD, ON THE in BOYTON BEACH, FL)
National Pollutant Discharge Elimination System NON-MAJOR (Tracking pollutant discharge elimination systems) - permit Organizations: CARL KLEPPER (CONTACT/OWNER)
CRYSTAL CLEANERS (6615 BOYNTON BEACH BLVD in BOYNTON BEACH, FL)
(Resource Conservation and Recovery Act (tracking hazardous waste)) Organizations: VINCENT PRECIPUO, OWNER (CONTACT/OWNER)
Housing units lacking complete plumbing facilities: 0.4% Housing units lacking complete kitchen facilities: 1.0%
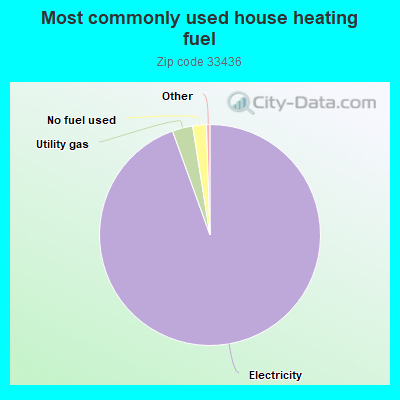
94.6%Electricity
3.0%Utility gas
2.0%No fuel used
Population in 1990: 19,263. Population change in the 1990s: +16,420 (+85.2%).
Place of birth for U.S.-born residents:
This state: 14,889
Northeast: 12,400
Midwest: 3,770
South: 3,091
West: 843
47% of the 33436 zip code residents lived in the same house 5 years ago. Out of people who lived in different houses, 49% lived in this county. Out of people who lived in different counties, 50% lived in Florida.
89% of the 33436 zip code residents lived in the same house 1 year ago. Out of people who lived in different houses, 46% moved from this county. Out of people who lived in different houses, 13% moved from different county within same state. Out of people who lived in different houses, 31% moved from different state. Out of people who lived in different houses, 12% moved from abroad.
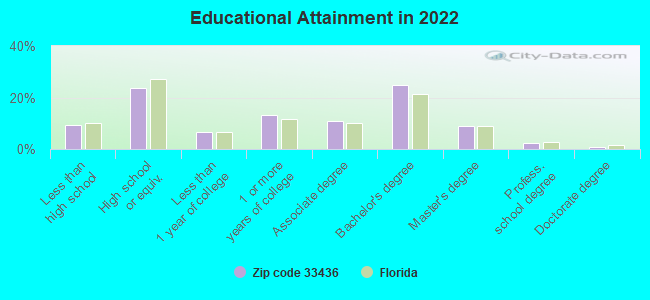
Private vs. public school enrollment:
Students in private schools in grades 1 to 8 (elementary and middle school): 335
Here:
9.4%
Florida:
15.8%
Students in private schools in grades 9 to 12 (high school): 118
Here:
5.7%
Florida:
12.9%
Students in private undergraduate colleges: 491
Here:
24.7%
Florida:
23.6%
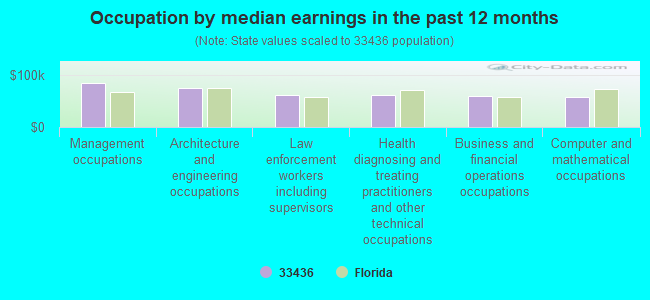
Occupation by median earnings in the past 12 months ($)
83,905Management occupations
75,122Architecture and engineering occupations
60,856Law enforcement workers including supervisors
60,429Health diagnosing and treating practitioners and other technical occupations
59,915Business and financial operations occupations
57,596Computer and mathematical occupations
Companies with federal contracts located in this zip code:
NEWTON, LEE (8655 DUKE CT E in BOYNTON BEACH, FL; small business) : $22,560 in 8 contractsin 2004
Contracts for Guard Services by Army, U.S. Army Corps of Engineers - civil program financing only Signed by year:2000: $0; 2001: $0; 2002: $0; 2003: $0; 2004: $22,560; 2005: $0; 2006: $0.
Biggest contracts:
$12,720 with Army for Guard Services. Taking place in VA. Signed on 2004-02-06. Completion date: 2004-04-27.
$12,720 with U.S. Army Corps of Engineers - civil program financing only for Guard Services. Taking place in VA. Signed on 2004-02-06. Completion date: 2004-04-27.
$240 with Army for Guard Services. Taking place in VA. Signed on 2004-04-30. Completion date: 2004-04-27.
$240 with U.S. Army Corps of Engineers - civil program financing only for Guard Services. Taking place in VA. Signed on 2004-04-30. Completion date: 2004-04-27.
SAFETY SOLUTIONS INCORPORATED (4672 BUCIDA ROAD in BOYNTON BEACH, FL; small business)
$5,435 with Army for Safety and Rescue Equipment. Taking place in NY. Signed on 2004-03-09. Completion date: 2004-04-09.
Top industries in this zip code by the number of employees in 2005:
Arts, Entertainment, and Recreation: Golf Courses and Country Clubs (250-499 employees: 1 establishment, 100-249 employees: 1 establishment, 50-99 employees: 3 establishments, 1-4 employees: 1 establishment)
Administrative and Support and Waste Management and Remediation Services: Professional Employer Organizations (500-999: 1)
Administrative and Support and Waste Management and Remediation Services: Landscaping Services (50-99: 1, 20-49: 3, 10-19: 1, 5-9: 2, 1-4: 18)
Other Services (except Public Administration): Other Similar Organizations (except Business, Professional, Labor, and Political Organizations) (100-249: 1, 10-19: 3, 5-9: 2, 1-4: 6)
Health Care and Social Assistance: Offices of Physicians (except Mental Health Specialists) (20-49: 1, 10-19: 5, 5-9: 13, 1-4: 13)
People in group quarters in 2010:
381 people in nursing facilities/skilled-nursing facilities
5 people in group homes intended for adults
People in group quarters in 2000:
381 people in nursing homes
Fatal accident statistics in 2014:
Fatal accident count: 3
Vehicles involved in fatal accidents: 5
Fatal accidents caused by drunken drivers: 0
Fatalities: 5
Persons involved in fatal accidents: 7
Pedestrians involved in fatal accidents: 2
Fatal accident statistics in 2013:
Fatal accident count: 1
Vehicles involved in fatal accidents: 1
Fatal accidents caused by drunken drivers: 0
Fatalities: 1
Persons involved in fatal accidents: 1
Pedestrians involved in fatal accidents: 1
Home Mortgage Disclosure Act Aggregated Statistics For Year 2009 (Based on 8 full and 8 partial tracts)
A) FHA, FSA/RHS & VA Home Purchase Loans
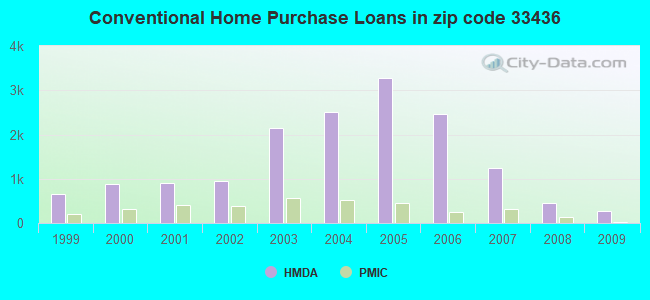
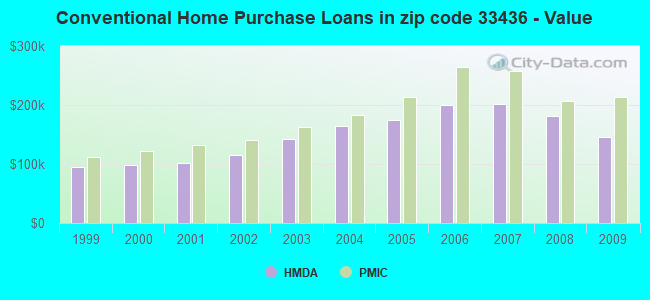
B) Conventional Home Purchase Loans
C) Refinancings
D) Home Improvement Loans
E) Loans on Dwellings For 5+ Families
F) Non-occupant Loans on < 5 Family Dwellings (A B C & D)
G) Loans On Manufactured Home Dwelling (A B C & D)
Number
Average Value
Number
Average Value
Number
Average Value
Number
Average Value
Number
Average Value
Number
Average Value
Number
Average Value
LOANS ORIGINATED
336
$171,979
277
$145,327
447
$177,543
30
$69,849
4
$14,395,920
77
$155,701
40
$58,613
APPLICATIONS APPROVED, NOT ACCEPTED
11
$163,869
56
$107,029
67
$157,575
14
$106,165
0
$0
12
$125,342
31
$45,668
APPLICATIONS DENIED
69
$179,378
104
$126,868
370
$184,152
34
$34,609
0
$0
44
$92,442
44
$43,325
APPLICATIONS WITHDRAWN
38
$167,525
52
$128,764
177
$203,057
7
$95,094
0
$0
27
$217,180
3
$58,583
FILES CLOSED FOR INCOMPLETENESS
24
$151,092
16
$195,501
67
$198,222
0
$0
0
$0
8
$201,185
4
$57,372
Aggregated Statistics For Year 2008 (Based on 8 full and 8 partial tracts)
A) FHA, FSA/RHS & VA Home Purchase Loans
B) Conventional Home Purchase Loans
C) Refinancings
D) Home Improvement Loans
F) Non-occupant Loans on < 5 Family Dwellings (A B C & D)
G) Loans On Manufactured Home Dwelling (A B C & D)
Number
Average Value
Number
Average Value
Number
Average Value
Number
Average Value
Number
Average Value
Number
Average Value
LOANS ORIGINATED
197
$215,783
448
$181,419
386
$180,857
53
$95,855
148
$152,424
42
$57,928
APPLICATIONS APPROVED, NOT ACCEPTED
9
$193,344
105
$169,345
137
$173,738
15
$49,487
27
$155,256
32
$73,966
APPLICATIONS DENIED
54
$188,408
171
$184,732
530
$204,375
62
$87,057
69
$142,885
47
$50,596
APPLICATIONS WITHDRAWN
13
$227,925
80
$167,283
185
$194,442
17
$143,917
26
$134,380
21
$61,007
FILES CLOSED FOR INCOMPLETENESS
7
$191,039
32
$239,056
69
$206,301
7
$51,321
10
$134,388
8
$48,849
Aggregated Statistics For Year 2007 (Based on 8 full and 8 partial tracts)
A) FHA, FSA/RHS & VA Home Purchase Loans
B) Conventional Home Purchase Loans
C) Refinancings
D) Home Improvement Loans
E) Loans on Dwellings For 5+ Families
F) Non-occupant Loans on < 5 Family Dwellings (A B C & D)
G) Loans On Manufactured Home Dwelling (A B C & D)
Number
Average Value
Number
Average Value
Number
Average Value
Number
Average Value
Number
Average Value
Number
Average Value
Number
Average Value
LOANS ORIGINATED
34
$244,533
1,248
$201,792
1,248
$202,336
139
$79,587
0
$0
366
$189,420
78
$67,254
APPLICATIONS APPROVED, NOT ACCEPTED
2
$166,335
235
$198,424
354
$198,430
43
$94,389
0
$0
83
$193,976
46
$54,637
APPLICATIONS DENIED
9
$261,982
538
$199,545
1,057
$219,948
146
$97,171
0
$0
139
$200,681
91
$57,143
APPLICATIONS WITHDRAWN
8
$223,926
250
$232,697
488
$216,322
28
$122,910
2
$103,665
93
$186,362
16
$68,758
FILES CLOSED FOR INCOMPLETENESS
2
$150,645
60
$232,991
184
$256,660
3
$179,713
0
$0
15
$215,955
0
$0
Aggregated Statistics For Year 2006 (Based on 8 full and 8 partial tracts)
A) FHA, FSA/RHS & VA Home Purchase Loans
B) Conventional Home Purchase Loans
C) Refinancings
D) Home Improvement Loans
F) Non-occupant Loans on < 5 Family Dwellings (A B C & D)
G) Loans On Manufactured Home Dwelling (A B C & D)
Number
Average Value
Number
Average Value
Number
Average Value
Number
Average Value
Number
Average Value
Number
Average Value
LOANS ORIGINATED
15
$211,463
2,454
$199,309
1,912
$205,450
236
$102,006
717
$191,233
84
$52,834
APPLICATIONS APPROVED, NOT ACCEPTED
0
$0
397
$180,119
439
$191,951
73
$90,973
118
$202,954
44
$48,977
APPLICATIONS DENIED
8
$276,626
730
$182,988
896
$216,842
150
$97,243
192
$187,905
72
$50,759
APPLICATIONS WITHDRAWN
0
$0
341
$207,800
694
$201,820
52
$105,956
111
$207,969
12
$63,560
FILES CLOSED FOR INCOMPLETENESS
0
$0
88
$218,348
193
$192,968
9
$123,197
29
$185,524
0
$0
Aggregated Statistics For Year 2005 (Based on 8 full and 8 partial tracts)
A) FHA, FSA/RHS & VA Home Purchase Loans
B) Conventional Home Purchase Loans
C) Refinancings
D) Home Improvement Loans
E) Loans on Dwellings For 5+ Families
F) Non-occupant Loans on < 5 Family Dwellings (A B C & D)
G) Loans On Manufactured Home Dwelling (A B C & D)
Number
Average Value
Number
Average Value
Number
Average Value
Number
Average Value
Number
Average Value
Number
Average Value
Number
Average Value
LOANS ORIGINATED
6
$202,125
3,285
$175,259
2,419
$189,202
269
$132,065
5
$18,842,154
1,232
$147,226
109
$52,888
APPLICATIONS APPROVED, NOT ACCEPTED
0
$0
460
$163,838
375
$176,204
57
$138,215
0
$0
152
$137,993
50
$61,038
APPLICATIONS DENIED
2
$142,795
991
$156,016
892
$192,494
200
$92,627
0
$0
388
$140,975
138
$54,301
APPLICATIONS WITHDRAWN
0
$0
491
$170,807
941
$177,856
115
$111,611
2
$11,770
184
$146,683
17
$54,188
FILES CLOSED FOR INCOMPLETENESS
0
$0
103
$177,634
207
$222,397
19
$85,691
0
$0
32
$129,850
3
$103,610
Aggregated Statistics For Year 2004 (Based on 8 full and 8 partial tracts)
A) FHA, FSA/RHS & VA Home Purchase Loans
B) Conventional Home Purchase Loans
C) Refinancings
D) Home Improvement Loans
E) Loans on Dwellings For 5+ Families
F) Non-occupant Loans on < 5 Family Dwellings (A B C & D)
G) Loans On Manufactured Home Dwelling (A B C & D)
Number
Average Value
Number
Average Value
Number
Average Value
Number
Average Value
Number
Average Value
Number
Average Value
Number
Average Value
LOANS ORIGINATED
38
$179,254
2,513
$163,652
2,038
$153,371
198
$78,105
1
$95,560
643
$145,493
94
$38,818
APPLICATIONS APPROVED, NOT ACCEPTED
2
$93,935
248
$139,462
353
$143,431
35
$73,913
0
$0
57
$139,480
56
$48,622
APPLICATIONS DENIED
7
$163,149
540
$155,455
898
$150,205
187
$48,700
0
$0
140
$171,633
140
$38,472
APPLICATIONS WITHDRAWN
11
$105,624
269
$165,498
849
$155,131
46
$62,465
0
$0
64
$136,987
11
$47,720
FILES CLOSED FOR INCOMPLETENESS
2
$95,720
77
$160,705
215
$164,785
24
$138,610
0
$0
25
$285,828
5
$36,984
Aggregated Statistics For Year 2003 (Based on 8 full and 8 partial tracts)
A) FHA, FSA/RHS & VA Home Purchase Loans
B) Conventional Home Purchase Loans
C) Refinancings
D) Home Improvement Loans
E) Loans on Dwellings For 5+ Families
F) Non-occupant Loans on < 5 Family Dwellings (A B C & D)
Number
Average Value
Number
Average Value
Number
Average Value
Number
Average Value
Number
Average Value
Number
Average Value
LOANS ORIGINATED
65
$139,968
2,147
$142,665
3,813
$129,668
104
$40,834
3
$9,840,903
503
$136,637
APPLICATIONS APPROVED, NOT ACCEPTED
0
$0
232
$108,082
523
$130,433
38
$35,126
0
$0
50
$160,929
APPLICATIONS DENIED
15
$144,751
415
$112,872
1,112
$124,719
116
$32,057
2
$360,915
99
$127,657
APPLICATIONS WITHDRAWN
8
$135,859
234
$154,536
872
$140,241
25
$62,448
2
$109,845
51
$138,029
FILES CLOSED FOR INCOMPLETENESS
3
$120,127
59
$137,133
158
$129,034
5
$45,820
0
$0
23
$124,871
Aggregated Statistics For Year 2002 (Based on 4 full and 4 partial tracts)
A) FHA, FSA/RHS & VA Home Purchase Loans
B) Conventional Home Purchase Loans
C) Refinancings
D) Home Improvement Loans
F) Non-occupant Loans on < 5 Family Dwellings (A B C & D)
Number
Average Value
Number
Average Value
Number
Average Value
Number
Average Value
Number
Average Value
LOANS ORIGINATED
34
$133,146
940
$114,664
1,322
$118,539
53
$41,728
191
$117,838
APPLICATIONS APPROVED, NOT ACCEPTED
0
$0
88
$94,878
255
$115,727
29
$36,333
17
$83,413
APPLICATIONS DENIED
7
$96,241
236
$71,306
487
$101,036
70
$29,042
40
$97,896
APPLICATIONS WITHDRAWN
2
$117,330
81
$132,795
302
$111,815
10
$23,468
14
$121,356
FILES CLOSED FOR INCOMPLETENESS
0
$0
17
$161,938
141
$128,628
6
$57,088
5
$268,470
Aggregated Statistics For Year 2001 (Based on 4 full and 4 partial tracts)
A) FHA, FSA/RHS & VA Home Purchase Loans
B) Conventional Home Purchase Loans
C) Refinancings
D) Home Improvement Loans
E) Loans on Dwellings For 5+ Families
F) Non-occupant Loans on < 5 Family Dwellings (A B C & D)
Number
Average Value
Number
Average Value
Number
Average Value
Number
Average Value
Number
Average Value
Number
Average Value
LOANS ORIGINATED
65
$115,222
908
$102,172
784
$110,778
59
$32,496
1
$857,470
118
$104,722
APPLICATIONS APPROVED, NOT ACCEPTED
6
$101,543
121
$78,210
159
$90,119
17
$23,088
0
$0
17
$73,754
APPLICATIONS DENIED
11
$113,602
332
$51,820
467
$86,958
65
$15,880
0
$0
28
$50,033
APPLICATIONS WITHDRAWN
5
$123,108
89
$114,352
224
$97,812
17
$24,584
0
$0
11
$120,096
FILES CLOSED FOR INCOMPLETENESS
1
$75,390
21
$129,163
78
$109,204
2
$23,985
0
$0
1
$199,620
Aggregated Statistics For Year 2000 (Based on 4 full and 4 partial tracts)
A) FHA, FSA/RHS & VA Home Purchase Loans
B) Conventional Home Purchase Loans
C) Refinancings
D) Home Improvement Loans
F) Non-occupant Loans on < 5 Family Dwellings (A B C & D)
Number
Average Value
Number
Average Value
Number
Average Value
Number
Average Value
Number
Average Value
LOANS ORIGINATED
80
$101,120
871
$98,811
176
$81,996
58
$26,175
75
$99,027
APPLICATIONS APPROVED, NOT ACCEPTED
1
$126,350
106
$78,302
50
$77,252
29
$22,628
13
$56,282
APPLICATIONS DENIED
7
$88,360
326
$61,189
213
$68,638
72
$25,669
17
$55,665
APPLICATIONS WITHDRAWN
15
$77,163
70
$92,358
104
$78,825
9
$46,909
10
$107,876
FILES CLOSED FOR INCOMPLETENESS
1
$88,130
42
$103,006
51
$83,541
2
$45,125
3
$70,160
Aggregated Statistics For Year 1999 (Based on 2 full and 4 partial tracts)
A) FHA, FSA/RHS & VA Home Purchase Loans
B) Conventional Home Purchase Loans
C) Refinancings
D) Home Improvement Loans
E) Loans on Dwellings For 5+ Families
F) Non-occupant Loans on < 5 Family Dwellings (A B C & D)
2003 - 2018 National Fire Incident Reporting System (NFIRS) incidents
According to the data from the years 2003 - 2018 the average number of fire incidents per year is 58. The highest number of fire incidents - 125 took place in 2004, and the least - 22 in 2016. The data has a declining trend.
When looking into fire subcategories, the most reports belonged to: Outside Fires (44.7%), and Mobile Property/Vehicle Fires (24.1%).
Fire incident types reported to NFIRS in Zip Code 33436


 Nearest zip codes: 33426, 33437, 33435, 33462, 33445, 33444.


 According to the data from the years 2003 - 2018 the average number of fire incidents per year is 58. The highest number of fire incidents - 125 took place in 2004, and the least - 22 in 2016. The data has a declining trend.
 When looking into fire subcategories, the most reports belonged to: Outside Fires (44.7%), and Mobile Property/Vehicle Fires (24.1%).