Estimated zip code population in 2022: 33,141 Zip code population in 2010: 30,879 Zip code population in 2000: 26,221
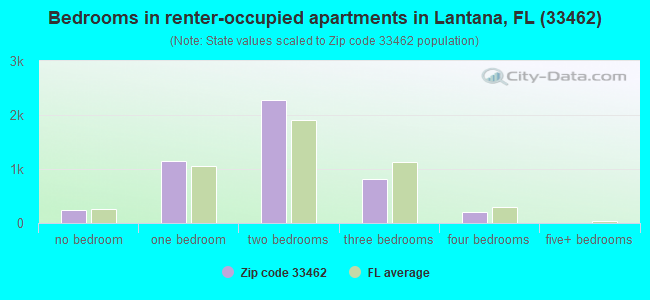
Houses and condos: 16,142 Renter-occupied apartments: 4,666
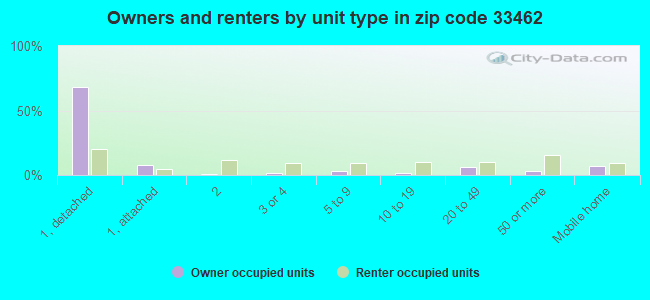
% of renters here:
35%
State:
33%
March 2022 cost of living index in zip code 33462: 100.2 (near average, U.S. average is 100)
Land area: 8.8 sq. mi. Water area: 2.5 sq. mi.
Population density: 3,779 people per square mile
(average).
OSM Map
General Map
Google Map
MSN Map
OSM Map
General Map
Google Map
MSN Map
OSM Map
General Map
Google Map
MSN Map
OSM Map
General Map
Google Map
MSN Map
Please wait while loading the map...
Real estate property taxes paid for housing units in 2022:
This zip code:
0.7% ($2,439)
Florida:
0.7% ($2,529)
Median real estate property taxes paid for housing units with mortgages in 2022: $2,808 (0.8%) Median real estate property taxes paid for housing units with no mortgage in 2022: $1,729 (0.5%)
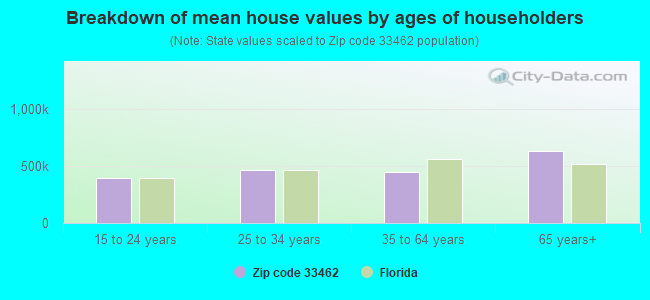
Estimated median house/condo value in 2022: $347,798
33462:
$347,798
Florida:
$354,100
According to our research of Florida and other state lists, there were 21 registered sex offenders living in 33462 zip code as of April 26, 2024. The ratio of all residents to sex offenders in zip code 33462 is 1,603 to 1. The ratio of registered sex offenders to all residents in this zip code is much lower than the state average.
Median resident age:
This zip code:
42.5 years
Florida median age:
42.7 years
Average household size:
This zip code:
2.5 people
Florida:
2.5 people
Averages for the 2020 tax year for zip code 33462, filed in 2021:
Average Adjusted Gross Income (AGI) in 2020: $141,682 (Individual Income Tax Returns)
Here:
$141,682
State:
$82,200
Salary/wage: $48,413 (reported on 78.5% of returns)
Here:
$48,413
State:
$58,347
(% of AGI for various income ranges: 1348.2% for AGIs below $25k, 3921.4% for AGIs $25k-50k, 6686.1% for AGIs $50k-75k, 9894.4% for AGIs $75k-100k, 17435.1% for AGIs $100k-200k, 99332.0% for AGIs over 200k)
Taxable interest for individuals: $14,827 (reported on 20.0% of returns)
This zip code:
$14,827
Florida:
$4,272
(% of AGI for various income ranges: 13.5% for AGIs below $25k, 28.6% for AGIs $25k-50k, 49.5% for AGIs $50k-75k, 114.1% for AGIs $75k-100k, 387.9% for AGIs $100k-200k, 30507.3% for AGIs over 200k)
Ordinary dividends: $40,611 (reported on 17.0% of returns)
Here:
$40,611
State:
$15,863
(% of AGI for various income ranges: 34.2% for AGIs below $25k, 47.4% for AGIs $25k-50k, 193.5% for AGIs $50k-75k, 354.1% for AGIs $75k-100k, 1225.8% for AGIs $100k-200k, 68492.7% for AGIs over 200k)
Net capital gain/loss in AGI: +$164,403 (reported on 16.7% of returns)
Here:
+$164,403
State:
+$62,983
(% of AGI for various income ranges: 7.8% for AGIs below $25k, 46.0% for AGIs $25k-50k, 115.2% for AGIs $50k-75k, 366.6% for AGIs $75k-100k, 1325.6% for AGIs $100k-200k, 308248.0% for AGIs over 200k)
Profit/loss from business: +$9,567 (reported on 26.7% of returns)
Here:
+$9,567
State:
+$9,719
(% of AGI for various income ranges: 177.4% for AGIs below $25k, 31.1% for AGIs $25k-50k, 161.4% for AGIs $50k-75k, 223.7% for AGIs $75k-100k, 531.7% for AGIs $100k-200k, 17578.0% for AGIs over 200k)
Taxable individual retirement arrangement distribution: $28,707 (reported on 7.0% of returns)
33462:
$28,707
Florida:
$24,823
(% of AGI for various income ranges: 28.6% for AGIs below $25k, 53.4% for AGIs $25k-50k, 173.3% for AGIs $50k-75k, 515.6% for AGIs $75k-100k, 1431.4% for AGIs $100k-200k, 10128.7% for AGIs over 200k)
Self-employed (Keogh) retirement plans: $37,180 (reported on 0.3% of returns)
33462:
$37,180
Florida:
$29,694
(% of AGI for various income ranges: 1239.3% for AGIs over 200k)
Total itemized deductions: $66,332 (reported on 7.9% of returns)
Here:
$66,332
State:
$45,393
(% of AGI for various income ranges: 57.6% for AGIs below $25k, 173.9% for AGIs $25k-50k, 404.8% for AGIs $50k-75k, 854.9% for AGIs $75k-100k, 1587.5% for AGIs $100k-200k, 38886.0% for AGIs over 200k)
Charity contributions: $38,437 (reported on 6.1% of returns)
Here:
$38,437
State:
$20,178
(% of AGI for various income ranges: 3.2% for AGIs below $25k, 16.9% for AGIs $25k-50k, 47.8% for AGIs $50k-75k, 103.8% for AGIs $75k-100k, 251.4% for AGIs $100k-200k, 24439.3% for AGIs over 200k)
Taxes paid: $6,585 (reported on 7.6% of returns)
33462:
$6,585
State:
$6,967
(% of AGI for various income ranges: 8.8% for AGIs below $25k, 25.7% for AGIs $25k-50k, 62.0% for AGIs $50k-75k, 136.8% for AGIs $75k-100k, 293.2% for AGIs $100k-200k, 2205.3% for AGIs over 200k)
Earned income credit: $2,477 (reported on 25.2% of returns)
Here:
$2,477
State:
$2,306
(% of AGI for various income ranges: 147.9% for AGIs below $25k, 85.8% for AGIs $25k-50k, 1.4% for AGIs $50k-75k)
Percentage of individuals using paid preparers for their 2020 taxes: 91.4%
Here:
91%
State:
92%
(% for various income ranges: 90.2% for AGIs below $25k, 92.6% for AGIs $25k-50k, 91.8% for AGIs $50k-75k, 93.1% for AGIs $75k-100k, 90.8% for AGIs $100k-200k, 93.3% for AGIs over 200k)
Averages for the 2012 tax year for zip code 33462, filed in 2013:
Average Adjusted Gross Income (AGI) in 2012: $87,581 (Individual Income Tax Returns)
Here:
$87,581
State:
$60,316
Salary/wage: $38,039 (reported on 79.7% of returns)
Here:
$38,039
State:
$45,277
(% of AGI for various income ranges: 78.6% for AGIs below $25k, 83.1% for AGIs $25k-50k, 73.1% for AGIs $50k-75k, 65.6% for AGIs $75k-100k, 55.8% for AGIs $100k-200k, 10.6% for AGIs over 200k)
Taxable interest for individuals: $5,959 (reported on 23.8% of returns)
This zip code:
$5,959
Florida:
$3,587
(% of AGI for various income ranges: 1.6% for AGIs below $25k, 0.9% for AGIs $25k-50k, 1.4% for AGIs $50k-75k, 1.7% for AGIs $75k-100k, 2.4% for AGIs $100k-200k, 1.6% for AGIs over 200k)
Ordinary dividends: $21,574 (reported on 18.1% of returns)
Here:
$21,574
State:
$12,831
(% of AGI for various income ranges: 3.1% for AGIs below $25k, 2.0% for AGIs $25k-50k, 3.2% for AGIs $50k-75k, 4.4% for AGIs $75k-100k, 6.4% for AGIs $100k-200k, 4.9% for AGIs over 200k)
Net capital gain/loss in AGI: +$131,855 (reported on 15.5% of returns)
Here:
+$131,855
State:
+$33,493
(% of AGI for various income ranges: 0.2% for AGIs $25k-50k, 1.2% for AGIs $50k-75k, 1.6% for AGIs $75k-100k, 4.1% for AGIs $100k-200k, 37.6% for AGIs over 200k)
Profit/loss from business: +$7,428 (reported on 18.9% of returns)
Here:
+$7,428
State:
+$10,012
(% of AGI for various income ranges: 7.9% for AGIs below $25k, 2.1% for AGIs $25k-50k, 2.2% for AGIs $50k-75k, 1.1% for AGIs $75k-100k, 2.2% for AGIs $100k-200k, 0.6% for AGIs over 200k)
Taxable individual retirement arrangement distribution: $29,239 (reported on 9.1% of returns)
33462:
$29,239
Florida:
$21,544
(% of AGI for various income ranges: 1.9% for AGIs below $25k, 1.9% for AGIs $25k-50k, 3.0% for AGIs $50k-75k, 4.5% for AGIs $75k-100k, 8.4% for AGIs $100k-200k, 2.4% for AGIs over 200k)
Self-employment retirement plans: $18,800 (reported on 0.3% of returns)
33462:
$18,800
Florida:
$20,611
Total itemized deductions: $34,054 (13% of AGI, reported on 23.4% of returns)
Here:
$34,054
State:
$25,533
Here:
12.6% of AGI
State:
18.0% of AGI
(% of AGI for various income ranges: 8.5% for AGIs below $25k, 12.3% for AGIs $25k-50k, 13.3% for AGIs $50k-75k, 15.3% for AGIs $75k-100k, 14.1% for AGIs $100k-200k, 6.8% for AGIs over 200k)
Charity contributions: $7,342 (reported on 18.2% of returns)
Here:
$7,342
State:
$5,698
(% of AGI for various income ranges: 0.5% for AGIs below $25k, 1.0% for AGIs $25k-50k, 1.5% for AGIs $50k-75k, 1.7% for AGIs $75k-100k, 2.0% for AGIs $100k-200k, 1.6% for AGIs over 200k)
Taxes paid: $10,217 (reported on 22.4% of returns)
33462:
$10,217
State:
$6,203
(% of AGI for various income ranges: 1.5% for AGIs below $25k, 2.0% for AGIs $25k-50k, 2.4% for AGIs $50k-75k, 3.2% for AGIs $75k-100k, 3.6% for AGIs $100k-200k, 2.7% for AGIs over 200k)
Earned income credit: $2,494 (reported on 27.8% of returns)
Here:
$2,494
State:
$2,372
(% of AGI for various income ranges: 8.8% for AGIs below $25k, 1.3% for AGIs $25k-50k)
Percentage of individuals using paid preparers for their 2012 taxes: 64.7%
Here:
65%
State:
54%
(% for various income ranges: 65.4% for AGIs below $25k, 60.3% for AGIs $25k-50k, 61.3% for AGIs $50k-75k, 64.6% for AGIs $75k-100k, 70.8% for AGIs $100k-200k, 88.4% for AGIs over 200k)
Averages for the 2004 tax year for zip code 33462, filed in 2005:
Average Adjusted Gross Income (AGI) in 2004: $61,760 (Individual Income Tax Returns)
Here:
$61,760
State:
$50,523
Salary/wage: $39,980 (reported on 79.3% of returns)
Here:
$39,980
State:
$39,563
(% of AGI for various income ranges: 179.6% for AGIs below $10k, 78.9% for AGIs $10k-25k, 82.1% for AGIs $25k-50k, 74.1% for AGIs $50k-75k, 69.3% for AGIs $75k-100k, 30.8% for AGIs over 100k)
Taxable interest for individuals: $5,422 (reported on 36.9% of returns)
This zip code:
$5,422
Florida:
$3,211
(% of AGI for various income ranges: 17.8% for AGIs below $10k, 2.4% for AGIs $10k-25k, 1.9% for AGIs $25k-50k, 2.8% for AGIs $50k-75k, 2.5% for AGIs $75k-100k, 3.7% for AGIs over 100k)
Taxable dividends: $14,295 (reported on 23.5% of returns)
Here:
$14,295
State:
$6,129
(% of AGI for various income ranges: 13.6% for AGIs below $10k, 2.3% for AGIs $10k-25k, 2.1% for AGIs $25k-50k, 2.7% for AGIs $50k-75k, 3.6% for AGIs $75k-100k, 7.4% for AGIs over 100k)
Net capital gain/loss: +$38,916 (reported on 20.8% of returns)
Here:
+$38,916
State:
+$27,205
(% of AGI for various income ranges: 18.9% for AGIs below $10k, 0.3% for AGIs $10k-25k, 0.7% for AGIs $25k-50k, 1.7% for AGIs $50k-75k, 3.3% for AGIs $75k-100k, 21.6% for AGIs over 100k)
Profit/loss from business: +$8,258 (reported on 15.1% of returns)
Here:
+$8,258
State:
+$10,634
(% of AGI for various income ranges: 20.6% for AGIs below $10k, 6.1% for AGIs $10k-25k, 2.4% for AGIs $25k-50k, 2.0% for AGIs $50k-75k, 2.4% for AGIs $75k-100k, 1.1% for AGIs over 100k)
IRA payment deduction: $3,073 (reported on 2.4% of returns)
33462:
$3,073
Florida:
$3,082
(% of AGI for various income ranges: 0.5% for AGIs below $10k, 0.2% for AGIs $10k-25k, 0.2% for AGIs $25k-50k, 0.1% for AGIs $50k-75k, 0.2% for AGIs $75k-100k, 0.1% for AGIs over 100k)
Self-employed pension: $11,400 (reported on 0.4% of returns)
Here:
$11,400
Florida:
$15,857
(% of AGI for various income ranges: 0.7% for AGIs below $10k, 0.1% for AGIs $50k-75k, 0.1% for AGIs over 100k)
Total itemized deductions: $24,030 (18% of AGI, reported on 33.6% of returns)
Here:
$24,030
State:
$20,370
Here:
18.4% of AGI
State:
20.7% of AGI
(% of AGI for various income ranges: 35.1% for AGIs below $10k, 17.9% for AGIs $10k-25k, 16.9% for AGIs $25k-50k, 17.7% for AGIs $50k-75k, 17.9% for AGIs $75k-100k, 9.6% for AGIs over 100k)
Charity contributions deductions: $5,163 (4% of AGI, reported on 28.6% of returns)
Here:
$5,163
State:
$4,064
Here:
3.6% of AGI
State:
3.8% of AGI
(% of AGI for various income ranges: 1.5% for AGIs below $10k, 1.4% for AGIs $10k-25k, 1.9% for AGIs $25k-50k, 2.1% for AGIs $50k-75k, 2.3% for AGIs $75k-100k, 2.7% for AGIs over 100k)
Total tax: $13,367 (reported on 69.8% of returns)
33462:
$13,367
State:
$9,431
(% of AGI for various income ranges: 6.7% for AGIs below $10k, 3.7% for AGIs $10k-25k, 6.4% for AGIs $25k-50k, 9.1% for AGIs $50k-75k, 11.3% for AGIs $75k-100k, 20.8% for AGIs over 100k)
Earned income credit: $1,774 (reported on 20.2% of returns)
Here:
$1,774
State:
$1,808
Percentage of individuals using paid preparers for their 2004 taxes: 63.8%
Here:
64%
State:
60%
(% for various income ranges: 60.0% for AGIs below $10k, 64.5% for AGIs $10k-25k, 61.3% for AGIs $25k-50k, 64.2% for AGIs $50k-75k, 65.5% for AGIs $75k-100k, 78.7% for AGIs over 100k)
Likely homosexual households (counted as self-reported same-sex unmarried-partner households)
Lesbian couples: 0.1% of all households
Gay men: 0.1% of all households
Household received Food Stamps/SNAP in the past 12 months: 1,263 Household did not receive Food Stamps/SNAP in the past 12 months: 12,076
Women who had a birth in the past 12 months: 289 (128 now married, 152 unmarried) Women who did not have a birth in the past 12 months: 6,684 (2,586 now married, 4,097 unmarried)
Housing units in zip code 33462 with a mortgage: 4,898 (546 second mortgage, 145 home equity loan, 251 both second mortgage and home equity loan) Houses without a mortgage: 63
Median monthly owner costs for units with a mortgage: $1,924 Median monthly owner costs for units without a mortgage: $709
Residents with income below the poverty level in 2022:
This zip code:
12.2%
Whole state:
12.7%
Residents with income below 50% of the poverty level in 2022:
This zip code:
5.4%
Whole state:
6.6%
Median number of rooms in houses and condos:
Here:
5.2
State:
5.9
Median number of rooms in apartments:
Here:
4.0
State:
4.2
Notable locations in this zip code not listed on our city pages
Notable locations in zip code 33462: Lantana Village Square (A), Lake Bess Golf Club (B), La Playa Golf Club (C), Palm Beach County Fire Rescue Station 35 (D), Palm Beach County Fire Rescue Station 37 (E), Palm Beach County Fire Rescue Station 38 (F), Palm Beach County Fire Rescue Station 43 (G), Lantana Police Department (H), Manalapan Police Department (I), Atlantis Police Department (J), Florida Highway Patrol Lantana District (K). Display/hide their locations on the map
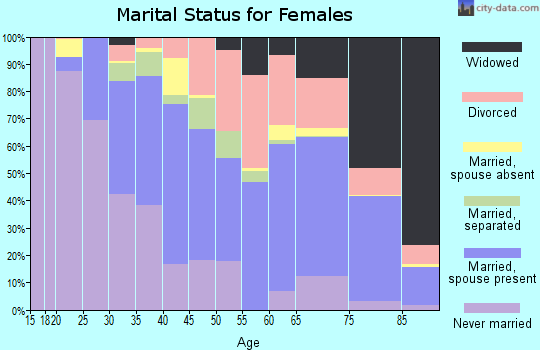
2,265 married couples with children.
2,030 single-parent households (890 men, 1,140 women).
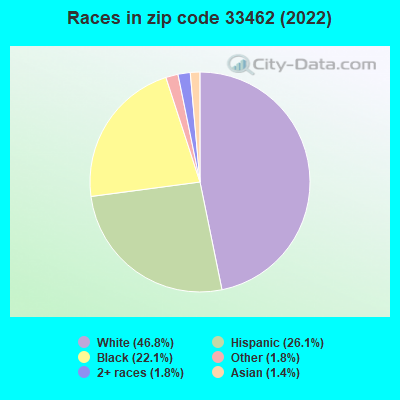
61.4% of residents of 33462 zip code speak English at home.
20.4% of residents speak Spanish at home (54% very well, 20% well, 18% not well, 7% not at all).
16.0% of residents speak other Indo-European language at home (51% very well, 24% well, 21% not well, 3% not at all).
0.3% of residents speak Asian or Pacific Island language at home (45% very well, 19% well, 10% not well, 27% not at all).
2.2% of residents speak other language at home (89% very well, 10% well, 1% not well).
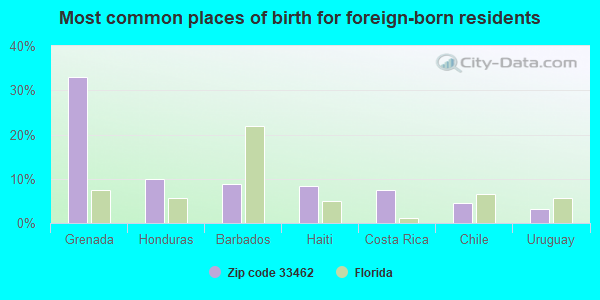
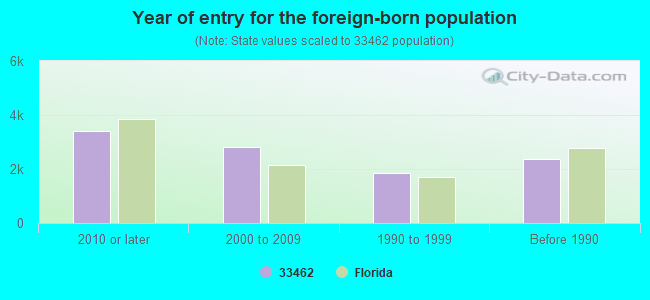
Foreign born population: 9,821 (29.6%) (53.1% of them are naturalized citizens)
Major facilities with environmental interests located in this zip code:
KEMPER AVIATION INC (2633 LANTANA ROAD in LANTANA, FL)
STATE MASTER (FDM) - WAFR-FLR05G131, NPDES STORMWATER PROGRAM, NPDES STORMWATER PERMIT National Pollutant Discharge Elimination System NON-MAJOR (Tracking pollutant discharge elimination systems) - permit (Resource Conservation and Recovery Act (tracking hazardous waste)) Business SIC classification: AIR TRANSPORTATION, NONSCHEDULED Organizations: ROHAN AVIATION (CONTACT/APPLICANT)
, NON NOTIFIER (CONTACT/OWNER)
, AKSHAY MOHAN (CONTACT/OWNER)
Alternative names: ROHAN AVIATION INC DBA KEMPER AVIATION
LANTANA ELEMENTARY SCHOOL (710 W OCEAN AVE in LANTANA, FL)
(Geographic Names Information System) (National Center for Education Statistics) - STATE ID-0751 Small Quantity Generators, between 100 kg and 1000 kg of hazardous waste/month (Resource Conservation and Recovery Act (tracking hazardous waste)) - notification Organizations: SNYDER MICHAEL ENV (CONTACT/OWNER)
, PALM BEACH COUNTY SCHOOL DISTRICT (SCHOOL DISTRICT)
Alternative names: PALM BEACH CO LANTANA ELEMENTARY
LANTANA MIDDLE SCHOOL (1225 W DREW ST in LANTANA, FL)
(Geographic Names Information System) (National Center for Education Statistics) - STATE ID-0761 Small Quantity Generators, between 100 kg and 1000 kg of hazardous waste/month (Resource Conservation and Recovery Act (tracking hazardous waste)) - notification Organizations: SNYDER MICHAEL ENV (CONTACT/OWNER)
, PALM BEACH COUNTY SCHOOL DISTRICT (SCHOOL DISTRICT)
Alternative names: PALM BEACH CO LANTANA MIDDLE
SANTALUCES HIGH SCHOOL (6880 LAWRENCE ROAD in LANTANA, FL)
(National Center for Education Statistics) - STATE ID-1611 Small Quantity Generators, between 100 kg and 1000 kg of hazardous waste/month (Resource Conservation and Recovery Act (tracking hazardous waste)) - notification Organizations: SNYDER MICHAEL ENV (CONTACT/OWNER)
, PALM BEACH COUNTY SCHOOL DISTRICT (SCHOOL DISTRICT)
Alternative names: PALM BEACH CO SANTALUCES HIGH
MURRELLE MARINA (846 N DIXIE HWY in LANTANA, FL)
National Pollutant Discharge Elimination System NON-MAJOR (Tracking pollutant discharge elimination systems) - permit (Resource Conservation and Recovery Act (tracking hazardous waste)) Business SIC classification: BOAT BUILDING AND REPAIRING Organizations: WALT DINARDO (CONTACT/OWNER)
, NON NOTIFIER (CONTACT/OWNER)
Alternative names: MURRELLE MARINE INC, WALT DINARDO
CONTROL LOGISTICS INC (2633 LANTANA RD HANGER 1101 in LANTANA, FL)
National Pollutant Discharge Elimination System NON-MAJOR (Tracking pollutant discharge elimination systems) - permit (Resource Conservation and Recovery Act (tracking hazardous waste)) Business SIC classification: AIRCRAFT PARTS AND AUXILIARY EQUIPMENT Business NAICS classification: ALL OTHER PLASTICS PRODUCT MANUFACTURING. Organizations: CARLOS CAVANAGH (CONTACT/OWNER)
, CARLOS CAVANAUGH (CONTACT/OWNER)
JFK CHARTER SCHOOL (6216 S. CONGRESS AVENUE in LANTANA, FL)
(National Center for Education Statistics) - STATE ID-3395 Organizations: PALM BEACH COUNTY SCHOOL DISTRICT (SCHOOL DISTRICT)
AIRCOASTAL HELICOPTERS INC (2615 LANTANA RD in LANTANA, FL)
National Pollutant Discharge Elimination System NON-MAJOR (Tracking pollutant discharge elimination systems) - permit (Resource Conservation and Recovery Act (tracking hazardous waste)) Business SIC classification: AIR TRANSPORTATION, NONSCHEDULED Organizations: PALM BEACH COUNTY AIRPORTS DEPT. (CONTACT/OWNER)
, BOYCE CROWE (CONTACT/OWNER)
PALM BEACH YOUTH ACADEMY (FORMERLY BANYAN HOUSE (1119 WEST LANTANA ROAD in LANTANA, FL)
(National Center for Education Statistics) - STATE ID-3001 Organizations: PALM BEACH COUNTY SCHOOL DISTRICT (SCHOOL DISTRICT)
ROYAL PALM SCHOOL (6650 LAWRENCE RD in LANTANA, FL)
(National Center for Education Statistics) - STATE ID-1801 Organizations: PALM BEACH COUNTY SCHOOL DISTRICT (SCHOOL DISTRICT)
RUNAWAY BAY APARTMENTS (6715 REFLECTIONS BLVD in LANTANA, FL)
(Integrated Compliance Information System) - ICIS-04-1997-0110, FORMAL ENFORCEMENT ACTION Business SIC classification: OPERATORS OF APARTMENT BUILDINGS
AMA REFINISHING INC (2633 LANTANA RD #17 H 506 &601 in LANTANA, FL)
Small Quantity Generators, between 100 kg and 1000 kg of hazardous waste/month (Resource Conservation and Recovery Act (tracking hazardous waste)) - notification (Resource Conservation and Recovery Act (tracking hazardous waste)) Business NAICS classification: WOOD PRESERVATION.; OTHER AIRCRAFT PARTS AND AUXILIARY EQUIPMENT MANUFACTURING. Organizations: SPECKMAN MICHAEL (CONTACT/OWNER)
, JASON FRITSCHLE, PRES (CONTACT/OWNER)
Alternative names: AMA AIRCRAFT REFINISHING INCORPORATed, AMA AIRCRAFT REFINISHING INCORPORATION
MIDDLE SCHOOL 03-KK (S SIDE LAKE WORTH RD ABOUT .5 in GREENACRES, FL)
National Pollutant Discharge Elimination System NON-MAJOR (Tracking pollutant discharge elimination systems) - permit Organizations: WARREN HAAN (CONTACT/OWNER)
Housing units lacking complete plumbing facilities: 0.1% Housing units lacking complete kitchen facilities: 1.2%
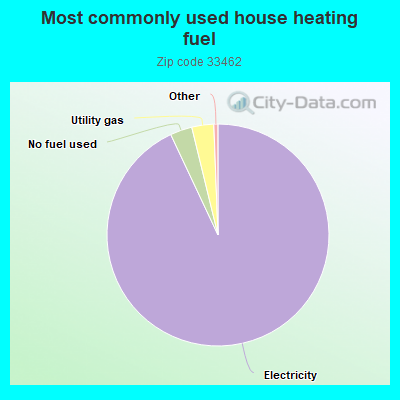
93.0%Electricity
3.2%No fuel used
3.2%Utility gas
Population in 1990: 30,704.
Place of birth for U.S.-born residents:
This state: 10,319
Northeast: 6,604
Midwest: 2,616
South: 2,326
West: 770
54% of the 33462 zip code residents lived in the same house 5 years ago. Out of people who lived in different houses, 68% lived in this county. Out of people who lived in different counties, 50% lived in Florida.
85% of the 33462 zip code residents lived in the same house 1 year ago. Out of people who lived in different houses, 52% moved from this county. Out of people who lived in different houses, 14% moved from different county within same state. Out of people who lived in different houses, 22% moved from different state. Out of people who lived in different houses, 10% moved from abroad.
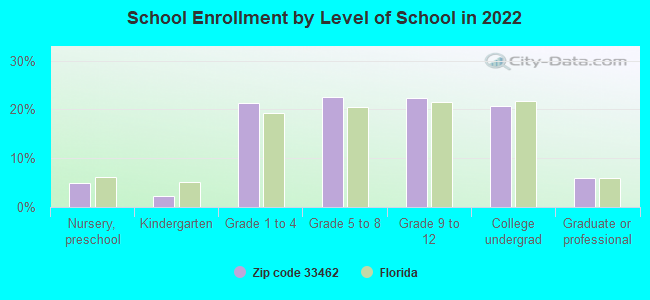
Private vs. public school enrollment:
Students in private schools in grades 1 to 8 (elementary and middle school): 212
Here:
7.6%
Florida:
15.8%
Students in private schools in grades 9 to 12 (high school): 195
Here:
13.8%
Florida:
12.9%
Students in private undergraduate colleges: 174
Here:
13.5%
Florida:
23.6%
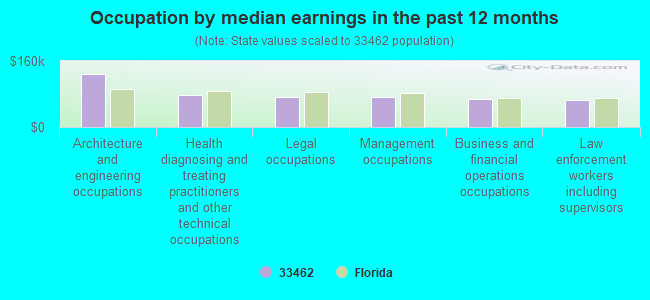
Occupation by median earnings in the past 12 months ($)
127,796Architecture and engineering occupations
78,024Health diagnosing and treating practitioners and other technical occupations
72,848Legal occupations
72,739Management occupations
68,899Business and financial operations occupations
66,591Law enforcement workers including supervisors
Companies with federal contracts located in this zip code:
CONTROL LOGISTICS, INC (2633 LANTANA RD BLDG 1101- in LAKE WORTH, FL; small business) : $14,841,391 in 338 contractsfrom 1999 to 2006
Contracts for Airframe Structural Components, Electric Vehicular Lights and Fixtures, Plastics Fabricated Materials, Rivets by Defense Logistics Agency, Army, Air Force, United States Coast Guard (disused code: now 7008), and others Signed by year:2000: $1,582,148; 2001: $643,498; 2002: $1,265,012; 2003: $203,801; 2004: $6,772,873; 2005: $2,837,506; 2006: $1,158,991.
Biggest contracts:
$729,621 with Defense Logistics Agency for Airframe Structural Components. Signed on 2004-09-03. Completion date: 2005-01-14.
$690,440, same as above.Signed on 2004-01-22. Completion date: 2004-08-16.
$673,576, same as above.Signed on 2005-10-26. Completion date: 2007-04-04.
$529,371, same as above.Signed on 2004-03-02. Completion date: 2004-11-30.
TELEFLEX FLUID SYSTEMS INC (2615 LANTANA ROAD in LANTANA, FL) : $211,753 in 7 contractsfrom 2000 to 2005
Contracts for Hose and Flexible Tubing by Defense Logistics Agency Signed by year:2000: $177,876; 2001: $28,209; 2002: $0; 2003: $0; 2004: $3,021; 2005: $2,647; 2006: $0.
Biggest contracts:
$62,612 with Defense Logistics Agency for Hose and Flexible Tubing. Signed on 2000-07-25. Completion date: 2000-12-02.
$50,348, same as above.Signed on 2000-02-06. Completion date: 2001-06-30.
$32,644, same as above.Signed on 2000-03-07. Completion date: 2000-06-15.
$32,272, same as above.Signed on 2000-05-31. Completion date: 2000-09-28.
Top industries in this zip code by the number of employees in 2005:
Health Care and Social Assistance: General Medical and Surgical Hospitals (over 1000 employees: 1 establishment, 100-249 employees: 1 establishment)
Health Care and Social Assistance: Offices of Physicians (except Mental Health Specialists) (50-99: 1, 20-49: 9, 10-19: 9, 5-9: 11, 1-4: 25)
2003 - 2018 National Fire Incident Reporting System (NFIRS) incidents
According to the data from the years 2003 - 2018 the average number of fire incidents per year is 75. The highest number of fire incidents - 129 took place in 2004, and the least - 41 in 2010. The data has a declining trend.
When looking into fire subcategories, the most reports belonged to: Outside Fires (39.6%), and Mobile Property/Vehicle Fires (25.1%).
Fire incident types reported to NFIRS in Zip Code 33462


 Nearest zip codes: 33460, 33461, 33426, 33435, 33463, 33436.
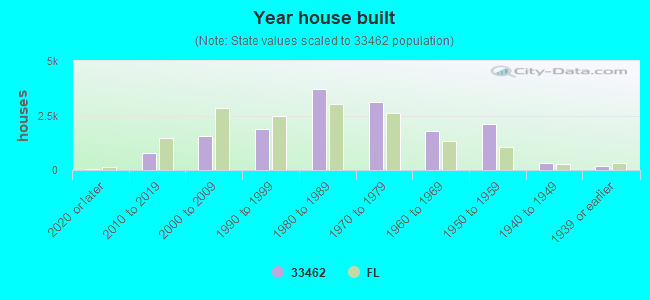


 According to the data from the years 2003 - 2018 the average number of fire incidents per year is 75. The highest number of fire incidents - 129 took place in 2004, and the least - 41 in 2010. The data has a declining trend.
 When looking into fire subcategories, the most reports belonged to: Outside Fires (39.6%), and Mobile Property/Vehicle Fires (25.1%).