Estimated zip code population in 2022: 49,945 Zip code population in 2010: 40,748 Zip code population in 2000: 35,754
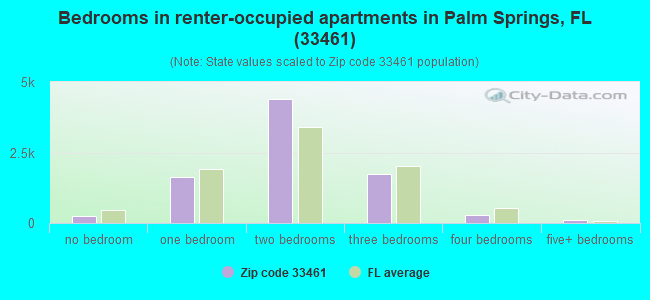
Houses and condos: 18,918 Renter-occupied apartments: 8,439
% of renters here:
51%
State:
33%
March 2022 cost of living index in zip code 33461: 99.5 (near average, U.S. average is 100)
Land area: 7.2 sq. mi. Water area: 0.2 sq. mi.
Population density: 6,931 people per square mile
(high).
OSM Map
General Map
Google Map
MSN Map
OSM Map
General Map
Google Map
MSN Map
OSM Map
General Map
Google Map
MSN Map
OSM Map
General Map
Google Map
MSN Map
Please wait while loading the map...
Real estate property taxes paid for housing units in 2022:
This zip code:
0.7% ($1,833)
Florida:
0.7% ($2,529)
Median real estate property taxes paid for housing units with mortgages in 2022: $2,295 (0.8%) Median real estate property taxes paid for housing units with no mortgage in 2022: $1,273 (0.6%)
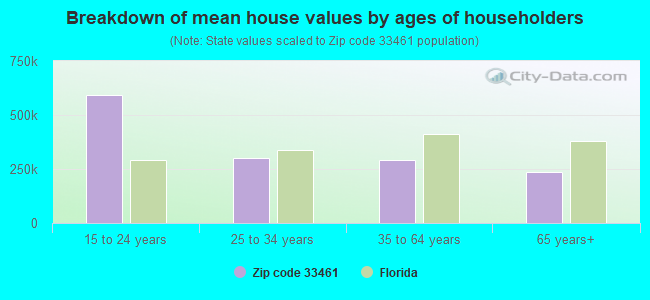
Estimated median house/condo value in 2022: $278,239
33461:
$278,239
Florida:
$354,100
According to our research of Florida and other state lists, there were 49 registered sex offenders living in 33461 zip code as of April 27, 2024. The ratio of all residents to sex offenders in zip code 33461 is 913 to 1. The ratio of registered sex offenders to all residents in this zip code is lower than the state average.
Median resident age:
This zip code:
36.4 years
Florida median age:
42.7 years
Average household size:
This zip code:
3.0 people
Florida:
2.5 people
Averages for the 2020 tax year for zip code 33461, filed in 2021:
Average Adjusted Gross Income (AGI) in 2020: $34,139 (Individual Income Tax Returns)
Here:
$34,139
State:
$82,200
Salary/wage: $33,365 (reported on 79.6% of returns)
Here:
$33,365
State:
$58,347
(% of AGI for various income ranges: 1310.8% for AGIs below $25k, 3884.3% for AGIs $25k-50k, 6777.3% for AGIs $50k-75k, 9803.8% for AGIs $75k-100k, 16386.5% for AGIs $100k-200k, 44283.3% for AGIs over 200k)
Taxable interest for individuals: $970 (reported on 9.3% of returns)
This zip code:
$970
Florida:
$4,272
(% of AGI for various income ranges: 4.8% for AGIs below $25k, 6.6% for AGIs $25k-50k, 12.1% for AGIs $50k-75k, 57.3% for AGIs $75k-100k, 85.1% for AGIs $100k-200k, 936.7% for AGIs over 200k)
Ordinary dividends: $2,859 (reported on 5.8% of returns)
Here:
$2,859
State:
$15,863
(% of AGI for various income ranges: 5.7% for AGIs below $25k, 12.5% for AGIs $25k-50k, 28.1% for AGIs $50k-75k, 77.9% for AGIs $75k-100k, 283.3% for AGIs $100k-200k, 1036.7% for AGIs over 200k)
Net capital gain/loss in AGI: +$9,790 (reported on 5.7% of returns)
Here:
+$9,790
State:
+$62,983
(% of AGI for various income ranges: 2.3% for AGIs below $25k, 11.6% for AGIs $25k-50k, 49.0% for AGIs $50k-75k, 214.9% for AGIs $75k-100k, 830.5% for AGIs $100k-200k, 19093.3% for AGIs over 200k)
Profit/loss from business: +$5,249 (reported on 34.1% of returns)
Here:
+$5,249
State:
+$9,719
(% of AGI for various income ranges: 285.4% for AGIs below $25k, 121.7% for AGIs $25k-50k, 246.9% for AGIs $50k-75k, 330.2% for AGIs $75k-100k, 447.9% for AGIs $100k-200k, 3570.0% for AGIs over 200k)
Taxable individual retirement arrangement distribution: $12,080 (reported on 2.7% of returns)
33461:
$12,080
Florida:
$24,823
(% of AGI for various income ranges: 14.6% for AGIs below $25k, 25.1% for AGIs $25k-50k, 64.7% for AGIs $50k-75k, 191.0% for AGIs $75k-100k, 515.6% for AGIs $100k-200k)
Total itemized deductions: $24,641 (reported on 3.1% of returns)
Here:
$24,641
State:
$45,393
(% of AGI for various income ranges: 24.7% for AGIs below $25k, 107.1% for AGIs $25k-50k, 240.7% for AGIs $50k-75k, 271.1% for AGIs $75k-100k, 682.3% for AGIs $100k-200k)
Charity contributions: $6,205 (reported on 1.9% of returns)
Here:
$6,205
State:
$20,178
(% of AGI for various income ranges: 1.5% for AGIs below $25k, 11.6% for AGIs $25k-50k, 31.1% for AGIs $50k-75k, 58.7% for AGIs $75k-100k, 217.4% for AGIs $100k-200k)
Taxes paid: $5,019 (reported on 2.8% of returns)
33461:
$5,019
State:
$6,967
(% of AGI for various income ranges: 3.4% for AGIs below $25k, 18.9% for AGIs $25k-50k, 51.8% for AGIs $50k-75k, 50.0% for AGIs $75k-100k, 133.3% for AGIs $100k-200k)
Earned income credit: $2,509 (reported on 33.5% of returns)
Here:
$2,509
State:
$2,306
(% of AGI for various income ranges: 166.5% for AGIs below $25k, 89.1% for AGIs $25k-50k, 1.6% for AGIs $50k-75k)
Percentage of individuals using paid preparers for their 2020 taxes: 89.2%
Here:
89%
State:
92%
(% for various income ranges: 86.4% for AGIs below $25k, 92.0% for AGIs $25k-50k, 91.9% for AGIs $50k-75k, 93.5% for AGIs $75k-100k, 92.1% for AGIs $100k-200k, 90.0% for AGIs over 200k)
Averages for the 2012 tax year for zip code 33461, filed in 2013:
Average Adjusted Gross Income (AGI) in 2012: $27,842 (Individual Income Tax Returns)
Here:
$27,842
State:
$60,316
Salary/wage: $26,675 (reported on 84.2% of returns)
Here:
$26,675
State:
$45,277
(% of AGI for various income ranges: 82.1% for AGIs below $25k, 88.9% for AGIs $25k-50k, 83.2% for AGIs $50k-75k, 80.3% for AGIs $75k-100k, 72.3% for AGIs $100k-200k, 31.0% for AGIs over 200k)
Taxable interest for individuals: $1,494 (reported on 11.7% of returns)
This zip code:
$1,494
Florida:
$3,587
(% of AGI for various income ranges: 0.7% for AGIs below $25k, 0.3% for AGIs $25k-50k, 0.4% for AGIs $50k-75k, 0.4% for AGIs $75k-100k, 1.0% for AGIs $100k-200k, 2.2% for AGIs over 200k)
Ordinary dividends: $3,999 (reported on 6.8% of returns)
Here:
$3,999
State:
$12,831
(% of AGI for various income ranges: 0.5% for AGIs below $25k, 0.7% for AGIs $25k-50k, 0.9% for AGIs $50k-75k, 1.1% for AGIs $75k-100k, 1.8% for AGIs $100k-200k, 4.0% for AGIs over 200k)
Net capital gain/loss in AGI: +$4,458 (reported on 4.8% of returns)
Here:
+$4,458
State:
+$33,493
(% of AGI for various income ranges: 0.2% for AGIs $50k-75k, 0.5% for AGIs $75k-100k, 1.2% for AGIs $100k-200k, 12.0% for AGIs over 200k)
Profit/loss from business: +$5,333 (reported on 22.6% of returns)
Here:
+$5,333
State:
+$10,012
(% of AGI for various income ranges: 11.0% for AGIs below $25k, 1.9% for AGIs $25k-50k, 1.3% for AGIs $50k-75k, 1.1% for AGIs $75k-100k, 2.1% for AGIs $100k-200k)
Taxable individual retirement arrangement distribution: $9,685 (reported on 3.9% of returns)
33461:
$9,685
Florida:
$21,544
(% of AGI for various income ranges: 1.1% for AGIs below $25k, 0.8% for AGIs $25k-50k, 1.7% for AGIs $50k-75k, 2.4% for AGIs $75k-100k, 3.2% for AGIs $100k-200k)
Total itemized deductions: $16,653 (29% of AGI, reported on 13.5% of returns)
Here:
$16,653
State:
$25,533
Here:
29.1% of AGI
State:
18.0% of AGI
(% of AGI for various income ranges: 4.7% for AGIs below $25k, 10.0% for AGIs $25k-50k, 9.6% for AGIs $50k-75k, 8.6% for AGIs $75k-100k, 9.6% for AGIs $100k-200k, 7.0% for AGIs over 200k)
Charity contributions: $2,556 (reported on 8.8% of returns)
Here:
$2,556
State:
$5,698
(% of AGI for various income ranges: 0.3% for AGIs below $25k, 0.8% for AGIs $25k-50k, 1.2% for AGIs $50k-75k, 1.1% for AGIs $75k-100k, 1.6% for AGIs $100k-200k, 0.7% for AGIs over 200k)
Taxes paid: $2,499 (reported on 12.5% of returns)
33461:
$2,499
State:
$6,203
(% of AGI for various income ranges: 0.5% for AGIs below $25k, 1.1% for AGIs $25k-50k, 1.5% for AGIs $50k-75k, 1.3% for AGIs $75k-100k, 1.9% for AGIs $100k-200k, 1.9% for AGIs over 200k)
Earned income credit: $2,605 (reported on 37.1% of returns)
Here:
$2,605
State:
$2,372
(% of AGI for various income ranges: 10.3% for AGIs below $25k, 1.5% for AGIs $25k-50k)
Percentage of individuals using paid preparers for their 2012 taxes: 62.3%
Here:
62%
State:
54%
(% for various income ranges: 63.5% for AGIs below $25k, 60.8% for AGIs $25k-50k, 57.7% for AGIs $50k-75k, 58.9% for AGIs $75k-100k, 61.5% for AGIs $100k-200k, 80.0% for AGIs over 200k)
Averages for the 2004 tax year for zip code 33461, filed in 2005:
Average Adjusted Gross Income (AGI) in 2004: $28,432 (Individual Income Tax Returns)
Here:
$28,432
State:
$50,523
Salary/wage: $27,190 (reported on 84.5% of returns)
Here:
$27,190
State:
$39,563
(% of AGI for various income ranges: 92.3% for AGIs below $10k, 83.1% for AGIs $10k-25k, 88.5% for AGIs $25k-50k, 81.4% for AGIs $50k-75k, 81.0% for AGIs $75k-100k, 50.1% for AGIs over 100k)
Taxable interest for individuals: $1,591 (reported on 24.4% of returns)
This zip code:
$1,591
Florida:
$3,211
(% of AGI for various income ranges: 3.2% for AGIs below $10k, 1.6% for AGIs $10k-25k, 0.9% for AGIs $25k-50k, 1.2% for AGIs $50k-75k, 1.4% for AGIs $75k-100k, 2.2% for AGIs over 100k)
Taxable dividends: $2,663 (reported on 11.4% of returns)
Here:
$2,663
State:
$6,129
(% of AGI for various income ranges: 2.3% for AGIs below $10k, 0.8% for AGIs $10k-25k, 0.7% for AGIs $25k-50k, 1.1% for AGIs $50k-75k, 0.8% for AGIs $75k-100k, 2.4% for AGIs over 100k)
Net capital gain/loss: +$6,888 (reported on 9.2% of returns)
Here:
+$6,888
State:
+$27,205
(% of AGI for various income ranges: -1.7% for AGIs below $10k, -0.2% for AGIs $10k-25k, 0.4% for AGIs $25k-50k, 1.1% for AGIs $50k-75k, 2.3% for AGIs $75k-100k, 14.5% for AGIs over 100k)
Profit/loss from business: +$6,473 (reported on 15.6% of returns)
Here:
+$6,473
State:
+$10,634
(% of AGI for various income ranges: 19.2% for AGIs below $10k, 7.0% for AGIs $10k-25k, 2.1% for AGIs $25k-50k, 1.7% for AGIs $50k-75k, 2.0% for AGIs $75k-100k, 1.5% for AGIs over 100k)
IRA payment deduction: $2,467 (reported on 1.6% of returns)
33461:
$2,467
Florida:
$3,082
(% of AGI for various income ranges: 0.2% for AGIs below $10k, 0.1% for AGIs $10k-25k, 0.2% for AGIs $25k-50k, 0.2% for AGIs $50k-75k, 0.1% for AGIs $75k-100k, 0.1% for AGIs over 100k)
Self-employed pension: $5,211 (reported on 0.1% of returns)
Here:
$5,211
Florida:
$15,857
Total itemized deductions: $14,363 (31% of AGI, reported on 23.0% of returns)
Here:
$14,363
State:
$20,370
Here:
30.6% of AGI
State:
20.7% of AGI
(% of AGI for various income ranges: 9.9% for AGIs below $10k, 10.3% for AGIs $10k-25k, 13.4% for AGIs $25k-50k, 12.4% for AGIs $50k-75k, 11.6% for AGIs $75k-100k, 8.1% for AGIs over 100k)
Charity contributions deductions: $2,233 (5% of AGI, reported on 18.7% of returns)
Here:
$2,233
State:
$4,064
Here:
4.5% of AGI
State:
3.8% of AGI
(% of AGI for various income ranges: 0.5% for AGIs below $10k, 1.1% for AGIs $10k-25k, 1.5% for AGIs $25k-50k, 1.7% for AGIs $50k-75k, 1.8% for AGIs $75k-100k, 1.6% for AGIs over 100k)
Total tax: $3,514 (reported on 66.4% of returns)
33461:
$3,514
State:
$9,431
(% of AGI for various income ranges: 4.2% for AGIs below $10k, 3.6% for AGIs $10k-25k, 6.4% for AGIs $25k-50k, 9.4% for AGIs $50k-75k, 11.3% for AGIs $75k-100k, 18.5% for AGIs over 100k)
Earned income credit: $1,900 (reported on 28.3% of returns)
Here:
$1,900
State:
$1,808
Percentage of individuals using paid preparers for their 2004 taxes: 60.4%
Here:
60%
State:
60%
(% for various income ranges: 57.2% for AGIs below $10k, 64.2% for AGIs $10k-25k, 58.3% for AGIs $25k-50k, 60.3% for AGIs $50k-75k, 57.9% for AGIs $75k-100k, 63.2% for AGIs over 100k)
Likely homosexual households (counted as self-reported same-sex unmarried-partner households)
Lesbian couples: 0.4% of all households
Gay men: 0.0% of all households
Household received Food Stamps/SNAP in the past 12 months: 3,882 Household did not receive Food Stamps/SNAP in the past 12 months: 12,709
Women who had a birth in the past 12 months: 741 (457 now married, 280 unmarried) Women who did not have a birth in the past 12 months: 11,680 (4,253 now married, 7,425 unmarried)
Housing units in zip code 33461 with a mortgage: 4,646 (469 second mortgage, 11 home equity loan, 401 both second mortgage and home equity loan) Houses without a mortgage: 90
Median monthly owner costs for units with a mortgage: $1,675 Median monthly owner costs for units without a mortgage: $527
Residents with income below the poverty level in 2022:
This zip code:
15.7%
Whole state:
12.7%
Residents with income below 50% of the poverty level in 2022:
This zip code:
7.4%
Whole state:
6.6%
Median number of rooms in houses and condos:
Here:
5.1
State:
5.9
Median number of rooms in apartments:
Here:
4.2
State:
4.2
Notable locations in this zip code not listed on our city pages
Notable locations in zip code 33461: Palm Beach County Campgrounds (A), Lake Worth Drive-In (B), Palm Springs Plaza (C), Worth Plaza (D), Lake Worth West Community Center (E), Library Cooperative of the Palm Beaches Palm Springs Public Library (F), Palm Springs Department of Public Safety (G), Palm Beach County Fire Rescue Station 31 (H), American Medical Response (I), Palm Springs Public Safety Department (J), Palm Springs Department of Public Safety (K), Lake Worth Fire Rescue Station 93 (L), Palm Beach County Sheriff's Office District 9 Parks Enforcement (M). Display/hide their locations on the map
Shopping Centers: Market Place Shopping Center (1), Greenwood Shopping Centre (2), Englewood Manor Shopping Center (3), Town and Country Shopping Center (4). Display/hide their locations on the map
4,549 married couples with children.
4,699 single-parent households (1,893 men, 2,806 women).
33.9% of residents of 33461 zip code speak English at home.
51.8% of residents speak Spanish at home (36% very well, 16% well, 27% not well, 22% not at all).
13.9% of residents speak other Indo-European language at home (55% very well, 29% well, 13% not well, 3% not at all).
0.8% of residents speak Asian or Pacific Island language at home (36% very well, 34% well, 29% not well).
1.4% of residents speak other language at home (41% very well, 5% well, 24% not well, 30% not at all).
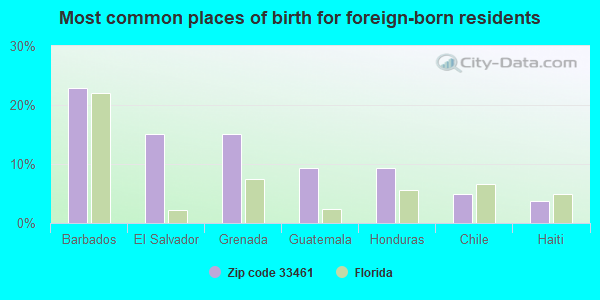
Foreign born population: 25,230 (50.5%) (40.9% of them are naturalized citizens)
This zip code:
50.5%
Whole state:
21.7%
23%Barbados
15%El Salvador
15%Grenada
9%Guatemala
9%Honduras
5%Chile
4%Haiti
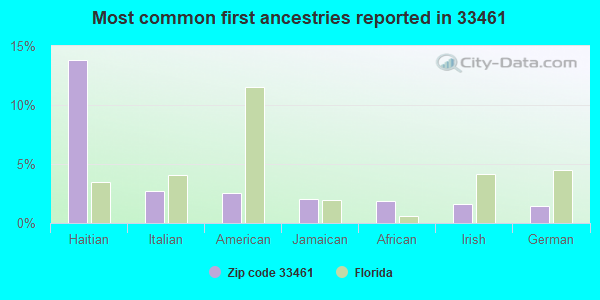
14%Haitian
3%Italian
3%American
2%Jamaican
2%African
2%Irish
1%German
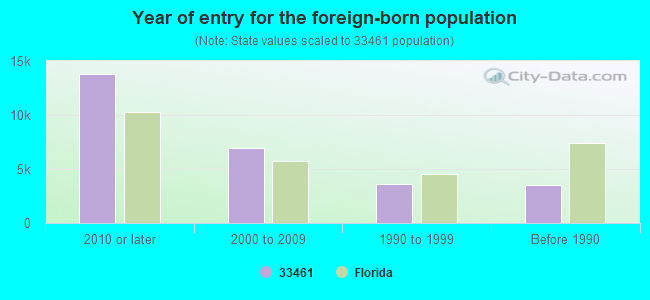
Year of entry for the foreign-born population
13,7772010 or later
6,9532000 to 2009
3,6211990 to 1999
3,557Before 1990
Major facilities with environmental interests located in this zip code:
PALM SPRINGS ELEMENTARY SCHOOL (101 DAVIS RD in LAKE WORTH, FL)
(Geographic Names Information System) (National Center for Education Statistics) - STATE ID-0651 Organizations: PALM BEACH COUNTY SCHOOL DISTRICT (SCHOOL DISTRICT)
AREA 2 ELEMENTARY TRANSITION (101 DAVIS ROAD in LAKE WORTH, FL)
(National Center for Education Statistics) - STATE ID-3111 Organizations: PALM BEACH COUNTY SCHOOL DISTRICT (SCHOOL DISTRICT)
LAKE WORTH COMMUNITY MIDDLE SCHOOL (1300 BARNETT DR in LAKE WORTH, FL)
(National Center for Education Statistics) - STATE ID-2131 Organizations: PALM BEACH COUNTY SCHOOL DISTRICT (SCHOOL DISTRICT)
CLIFFORD O. TAYLOR/KIRKLAND ELEMENTARY SCHOOL (4200 PURDY LN in PALM SPRINGS, FL)
(National Center for Education Statistics) - STATE ID-1531 Organizations: PALM BEACH COUNTY SCHOOL DISTRICT (SCHOOL DISTRICT)
10TH AVENUE NORTH (95504) (MILITARY TRAIL TO CONGRESS AVE in PALM SPRINGS, UNINCORPO, FL)
National Pollutant Discharge Elimination System NON-MAJOR (Tracking pollutant discharge elimination systems) - permit Organizations: OMELIO FERNANDEZ (CONTACT/OWNER)
CUMBERLAND FARMS #0938 (3980 10TH AVENUE, NORTH in LAKE WORTH, FL)
National Pollutant Discharge Elimination System NON-MAJOR (Tracking pollutant discharge elimination systems) - permit Small Quantity Generators, between 100 kg and 1000 kg of hazardous waste/month (Resource Conservation and Recovery Act (tracking hazardous waste)) - notification Business SIC classification: GASOLINE SERVICE STATIONS Organizations: JOYCE SCHULTZ, UST COORD (CONTACT/OWNER)
LAKE WORTH RD & CONGRESS AVE (INTERSECTION IMPROVEMENT in UNINCORPORATED PALM BEA, FL)
National Pollutant Discharge Elimination System NON-MAJOR (Tracking pollutant discharge elimination systems) - permit Organizations: OMELIO A FERNANDEZ (CONTACT/OWNER)
Alternative names: PALM BEACH COUNTY BOARD OF COU
COUNTRY DRY CLEANERS (2495F 1OTH AVE N in LAKE WORTH, FL)
AIR MINOR (AIRS/AFS) Small Quantity Generators, between 100 kg and 1000 kg of hazardous waste/month (Resource Conservation and Recovery Act (tracking hazardous waste)) - notification Business SIC classification: DRYCLEANING PLANTS, EXCEPT RUG CLEANING Organizations: EDWARD TURNER (CONTACT/OWNER)
Alternative names: COUNTRY DRY CLEANERS EAST
PALM BEACH COUNTY PARKS & RECR (2700 6TH AVE S in LAKE WORTH, FL)
National Pollutant Discharge Elimination System NON-MAJOR (Tracking pollutant discharge elimination systems) - permit Organizations: JOE HEDGES (CONTACT/OWNER)
OCEAN CLEANERS (2763 S CONGRESS in LAKE WORTH, FL)
AIR MINOR (AIRS/AFS) Small Quantity Generators, between 100 kg and 1000 kg of hazardous waste/month (Resource Conservation and Recovery Act (tracking hazardous waste)) Business SIC classification: DRYCLEANING PLANTS, EXCEPT RUG CLEANING Organizations: AILHUA DICKSON, OWNER (CONTACT/OWNER)
COLONIAL PRODUCTS INC (1830 10TH AVENUE NORTH in LAKE WORTH, FL)
COMPLIANCE ACTIVITY (Tracking inspections of insecticide, fungicide, and rodenticide, and toxic substances) (Resource Conservation and Recovery Act (tracking hazardous waste)) Organizations: H DUANE HOLSAPPLE, PRESIDENT (CONTACT/OWNER)
PALM BEACH COMMUNITY COLLEGE D (4200 S. CONGRESS AVENUE in LAKE WORTH, FL)
National Pollutant Discharge Elimination System NON-MAJOR (Tracking pollutant discharge elimination systems) - permit Small Quantity Generators, between 100 kg and 1000 kg of hazardous waste/month (Resource Conservation and Recovery Act (tracking hazardous waste)) - notification Organizations: BILL TIANELLO, SECURITY CHIEF (CONTACT/OWNER)
Housing units lacking complete plumbing facilities: 0.2% Housing units lacking complete kitchen facilities: 1.0%
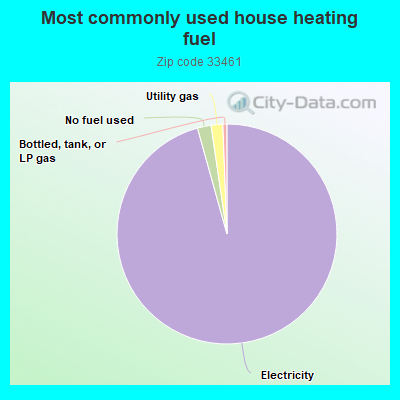
95.2%Electricity
2.0%No fuel used
1.7%Utility gas
0.6%Bottled, tank, or LP gas
Population in 1990: 30,905. Population change in the 1990s: +4,849 (+15.7%).
Place of birth for U.S.-born residents:
This state: 14,778
Northeast: 3,626
Midwest: 1,673
South: 2,408
West: 766
46% of the 33461 zip code residents lived in the same house 5 years ago. Out of people who lived in different houses, 71% lived in this county. Out of people who lived in different counties, 50% lived in Florida.
88% of the 33461 zip code residents lived in the same house 1 year ago. Out of people who lived in different houses, 61% moved from this county. Out of people who lived in different houses, 12% moved from different county within same state. Out of people who lived in different houses, 8% moved from different state. Out of people who lived in different houses, 15% moved from abroad.
Private vs. public school enrollment:
Students in private schools in grades 1 to 8 (elementary and middle school): 644
Here:
12.8%
Florida:
15.8%
Students in private schools in grades 9 to 12 (high school): 253
Here:
12.1%
Florida:
12.9%
Students in private undergraduate colleges: 262
Here:
11.4%
Florida:
23.6%
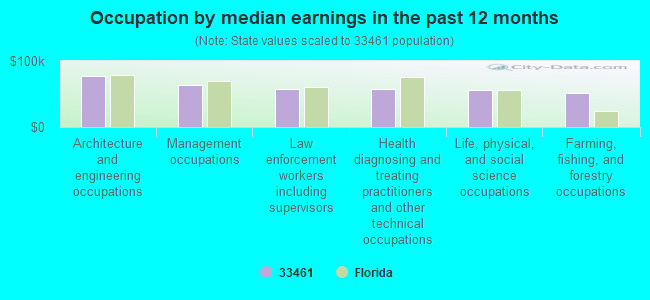
Occupation by median earnings in the past 12 months ($)
77,098Architecture and engineering occupations
63,346Management occupations
58,002Law enforcement workers including supervisors
57,889Health diagnosing and treating practitioners and other technical occupations
56,419Life, physical, and social science occupations
51,357Farming, fishing, and forestry occupations
Companies with federal contracts located in this zip code (LAKE WORTH, FL):
PATTEN CO , INC (1803 MADRID AVE; small business) : $15,658,724 in 114 contractsfrom 1999 to 2006
Contracts for Marine Lifesaving and Diving Equipment, Training Aids, Radio and Television Communication Equipment, Except Airborne, Marine Hardware and Hull Items, and moreby Defense Logistics Agency, Air Force, Navy Signed by year:2000: $2,971,531; 2001: $4,102,777; 2002: $1,453,409; 2003: $1,609,655; 2004: $1,661,359; 2005: $2,513,265; 2006: $441,564.
Biggest contracts:
$1,696,640 with Defense Logistics Agency for Marine Lifesaving and Diving Equipment. Signed on 2001-03-21. Completion date: 2001-12-15.
$1,385,018, same as above.Signed on 2001-11-15. Completion date: 2003-04-30.
$1,169,548 with Air Force for Marine Lifesaving and Diving Equipment. Signed on 2000-09-01. Completion date: 2002-03-29.
$856,250 with Defense Logistics Agency for Marine Lifesaving and Diving Equipment. Signed on 2005-06-23. Completion date: 2006-01-25.
MILCOM SERVICES INC (1963 10TH AVE N; small business) : $354,899 in 9 contractsfrom 2000 to 2006
Contracts for Cable, Cord, and Wire Assemblies: Communications Equipment, Miscellaneous Electric Power and Distribution Equipment, Aircraft Maintenance and Repair Shop Specialized Equipment by Defense Logistics Agency, Army Signed by year:2000: $207,933; 2001: $59,486; 2002: $39,721; 2003: $0; 2004: $0; 2005: $40,780; 2006: $6,979.
Biggest contracts:
$64,672 with Defense Logistics Agency for Cable, Cord, and Wire Assemblies: Communications Equipment. Signed on 2000-02-18. Completion date: 2000-09-15.
$59,486 with Defense Logistics Agency for Miscellaneous Electric Power and Distribution Equipment. Signed on 2001-12-06. Completion date: 2002-07-04.
$58,937 with Army for Miscellaneous Electric Power and Distribution Equipment. Signed on 2000-06-21. Completion date: 2001-02-14.
$45,195 with Defense Logistics Agency for Miscellaneous Electric Power and Distribution Equipment. Signed on 2000-11-03. Completion date: 2001-05-02.
MOHAWK TECHNOLOGIES, LLC (1951 10TH AVE N; small business)
$175,000 with Army for Air Transportation -- Applied Research and Exploratory Development (R&D). Signed on 2005-01-05. Completion date: 2005-01-17.
M Q P ENTERPRISES, INC. (3281 LAKE WORTH RD; small business)
$114,977 with Navy for Air Passenger Service. Signed on 2000-08-30. Completion date: 2001-03-31.
BOBS AUTO SERVICE (3530 LAKE WORTH RD)
$34,174 with Department of Defense for Food Items For Resale. Taking place in VA. Signed on 1999-12-31. Completion date: 2000-02-28.
LETHAL PC (4446 WILKINSON DR; small business)
$21,474 with Army for ADPE System Configuration. Signed on 2003-03-13. Completion date: 2003-03-31.
Top industries in this zip code by the number of employees in 2005:
Construction: Poured Concrete Foundation and Structure Contractors (over 1000 employees: 1 establishment, 5-9 employees: 1 establishment)
2003 - 2018 National Fire Incident Reporting System (NFIRS) incidents
According to the data from the years 2003 - 2018 the average number of fire incidents per year is 117. The highest number of fire incidents - 286 took place in 2004, and the least - 51 in 2010. The data has a declining trend.
When looking into fire subcategories, the most reports belonged to: Outside Fires (48.1%), and Mobile Property/Vehicle Fires (20.9%).
Fire incident types reported to NFIRS in Zip Code 33461


 Nearest zip codes: 33460, 33406, 33462, 33463, 33415, 33405.


 According to the data from the years 2003 - 2018 the average number of fire incidents per year is 117. The highest number of fire incidents - 286 took place in 2004, and the least - 51 in 2010. The data has a declining trend.
 When looking into fire subcategories, the most reports belonged to: Outside Fires (48.1%), and Mobile Property/Vehicle Fires (20.9%).