Estimated zip code population in 2022: 20,951 Zip code population in 2010: 19,155 Zip code population in 2000: 19,840
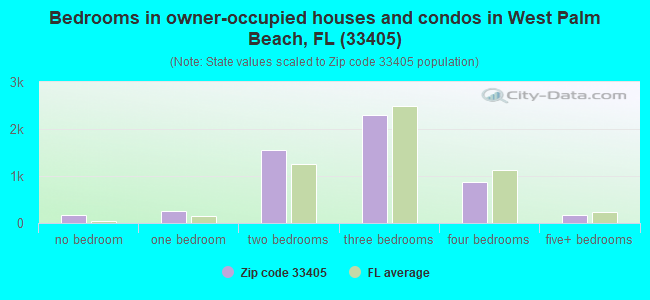
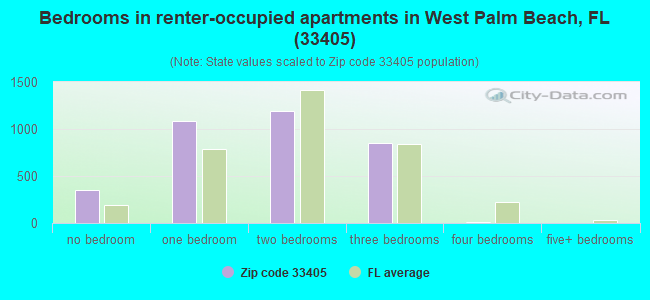
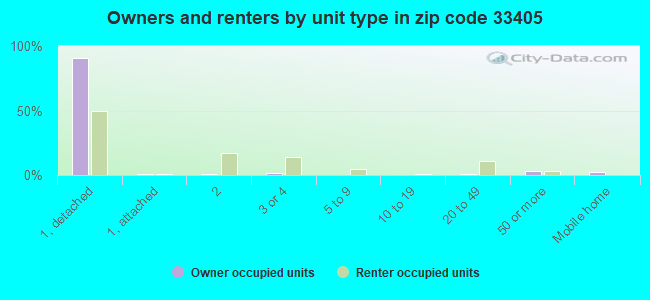
Houses and condos: 9,619 Renter-occupied apartments: 3,474
% of renters here:
39%
State:
33%
March 2022 cost of living index in zip code 33405: 99.6 (near average, U.S. average is 100)
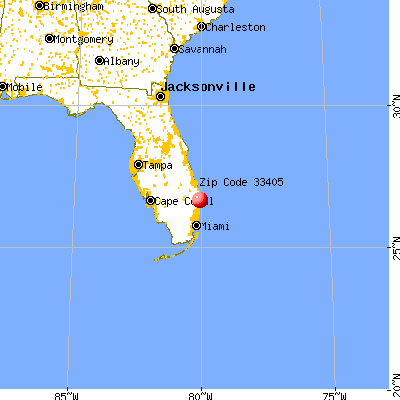
Land area: 4.5 sq. mi. Water area: 0.5 sq. mi.
Population density: 4,657 people per square mile
(average).
OSM Map
General Map
Google Map
MSN Map
OSM Map
General Map
Google Map
MSN Map
OSM Map
General Map
Google Map
MSN Map
OSM Map
General Map
Google Map
MSN Map
Please wait while loading the map...
Real estate property taxes paid for housing units in 2022:
This zip code:
0.6% ($2,557)
Florida:
0.7% ($2,529)
Median real estate property taxes paid for housing units with mortgages in 2022: $2,475 (0.6%) Median real estate property taxes paid for housing units with no mortgage in 2022: $2,676 (0.6%)
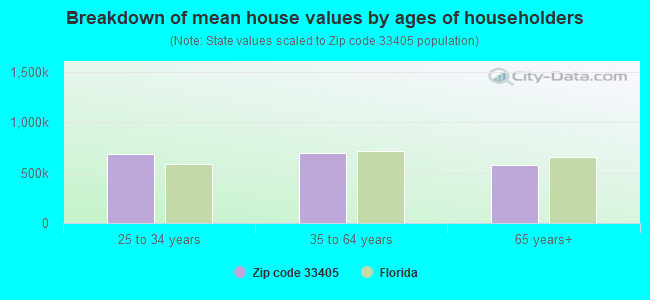
Estimated median house/condo value in 2022: $419,782
33405:
$419,782
Florida:
$354,100
According to our research of Florida and other state lists, there were 16 registered sex offenders living in 33405 zip code as of April 27, 2024. The ratio of all residents to sex offenders in zip code 33405 is 1,330 to 1. The ratio of registered sex offenders to all residents in this zip code is lower than the state average.
Median resident age:
This zip code:
43.3 years
Florida median age:
42.7 years
Average household size:
This zip code:
2.4 people
Florida:
2.5 people
Averages for the 2020 tax year for zip code 33405, filed in 2021:
Average Adjusted Gross Income (AGI) in 2020: $92,167 (Individual Income Tax Returns)
Here:
$92,167
State:
$82,200
Salary/wage: $67,947 (reported on 77.0% of returns)
Here:
$67,947
State:
$58,347
(% of AGI for various income ranges: 1328.7% for AGIs below $25k, 4021.1% for AGIs $25k-50k, 7133.0% for AGIs $50k-75k, 10555.5% for AGIs $75k-100k, 20455.8% for AGIs $100k-200k, 143956.5% for AGIs over 200k)
Taxable interest for individuals: $5,736 (reported on 21.0% of returns)
This zip code:
$5,736
Florida:
$4,272
(% of AGI for various income ranges: 9.0% for AGIs below $25k, 12.6% for AGIs $25k-50k, 41.8% for AGIs $50k-75k, 145.2% for AGIs $75k-100k, 218.4% for AGIs $100k-200k, 5900.0% for AGIs over 200k)
Ordinary dividends: $23,672 (reported on 17.5% of returns)
Here:
$23,672
State:
$15,863
(% of AGI for various income ranges: 26.1% for AGIs below $25k, 79.1% for AGIs $25k-50k, 222.7% for AGIs $50k-75k, 447.6% for AGIs $75k-100k, 1267.9% for AGIs $100k-200k, 18588.8% for AGIs over 200k)
Net capital gain/loss in AGI: +$72,651 (reported on 17.1% of returns)
Here:
+$72,651
State:
+$62,983
(% of AGI for various income ranges: 12.5% for AGIs below $25k, 47.8% for AGIs $25k-50k, 146.5% for AGIs $50k-75k, 451.5% for AGIs $75k-100k, 2107.4% for AGIs $100k-200k, 66924.1% for AGIs over 200k)
Profit/loss from business: +$12,666 (reported on 30.9% of returns)
Here:
+$12,666
State:
+$9,719
(% of AGI for various income ranges: 270.4% for AGIs below $25k, 208.8% for AGIs $25k-50k, 356.6% for AGIs $50k-75k, 567.6% for AGIs $75k-100k, 1534.7% for AGIs $100k-200k, 10188.8% for AGIs over 200k)
Taxable individual retirement arrangement distribution: $25,644 (reported on 4.9% of returns)
33405:
$25,644
Florida:
$24,823
(% of AGI for various income ranges: 25.4% for AGIs below $25k, 36.2% for AGIs $25k-50k, 111.9% for AGIs $50k-75k, 232.1% for AGIs $75k-100k, 927.1% for AGIs $100k-200k, 3671.2% for AGIs over 200k)
Self-employed (Keogh) retirement plans: $39,343 (reported on 0.7% of returns)
33405:
$39,343
Florida:
$29,694
(% of AGI for various income ranges: 39.1% for AGIs $50k-75k, 1442.9% for AGIs over 200k)
Total itemized deductions: $43,507 (reported on 9.4% of returns)
Here:
$43,507
State:
$45,393
(% of AGI for various income ranges: 36.6% for AGIs below $25k, 126.3% for AGIs $25k-50k, 376.4% for AGIs $50k-75k, 838.2% for AGIs $75k-100k, 1505.0% for AGIs $100k-200k, 15551.8% for AGIs over 200k)
Charity contributions: $15,860 (reported on 7.4% of returns)
Here:
$15,860
State:
$20,178
(% of AGI for various income ranges: 0.8% for AGIs below $25k, 12.3% for AGIs $25k-50k, 63.4% for AGIs $50k-75k, 130.3% for AGIs $75k-100k, 266.1% for AGIs $100k-200k, 5705.9% for AGIs over 200k)
Taxes paid: $7,414 (reported on 9.3% of returns)
33405:
$7,414
State:
$6,967
(% of AGI for various income ranges: 7.4% for AGIs below $25k, 18.3% for AGIs $25k-50k, 76.8% for AGIs $50k-75k, 178.2% for AGIs $75k-100k, 404.7% for AGIs $100k-200k, 2167.6% for AGIs over 200k)
Earned income credit: $2,180 (reported on 22.8% of returns)
Here:
$2,180
State:
$2,306
(% of AGI for various income ranges: 132.3% for AGIs below $25k, 65.9% for AGIs $25k-50k)
Percentage of individuals using paid preparers for their 2020 taxes: 89.6%
Here:
90%
State:
92%
(% for various income ranges: 86.4% for AGIs below $25k, 90.9% for AGIs $25k-50k, 92.2% for AGIs $50k-75k, 91.1% for AGIs $75k-100k, 93.0% for AGIs $100k-200k, 94.4% for AGIs over 200k)
Averages for the 2012 tax year for zip code 33405, filed in 2013:
Average Adjusted Gross Income (AGI) in 2012: $53,791 (Individual Income Tax Returns)
Here:
$53,791
State:
$60,316
Salary/wage: $41,889 (reported on 80.0% of returns)
Here:
$41,889
State:
$45,277
(% of AGI for various income ranges: 77.7% for AGIs below $25k, 85.0% for AGIs $25k-50k, 76.3% for AGIs $50k-75k, 73.2% for AGIs $75k-100k, 64.5% for AGIs $100k-200k, 43.1% for AGIs over 200k)
Taxable interest for individuals: $3,947 (reported on 20.0% of returns)
This zip code:
$3,947
Florida:
$3,587
(% of AGI for various income ranges: 0.9% for AGIs below $25k, 0.7% for AGIs $25k-50k, 1.0% for AGIs $50k-75k, 1.1% for AGIs $75k-100k, 2.2% for AGIs $100k-200k, 1.9% for AGIs over 200k)
Ordinary dividends: $14,239 (reported on 15.6% of returns)
Here:
$14,239
State:
$12,831
(% of AGI for various income ranges: 2.6% for AGIs below $25k, 1.9% for AGIs $25k-50k, 3.9% for AGIs $50k-75k, 2.7% for AGIs $75k-100k, 4.0% for AGIs $100k-200k, 5.7% for AGIs over 200k)
Net capital gain/loss in AGI: +$28,969 (reported on 13.4% of returns)
Here:
+$28,969
State:
+$33,493
(% of AGI for various income ranges: 0.3% for AGIs $25k-50k, 1.2% for AGIs $50k-75k, 2.6% for AGIs $75k-100k, 3.5% for AGIs $100k-200k, 15.6% for AGIs over 200k)
Profit/loss from business: +$9,410 (reported on 24.8% of returns)
Here:
+$9,410
State:
+$10,012
(% of AGI for various income ranges: 11.4% for AGIs below $25k, 3.7% for AGIs $25k-50k, 3.4% for AGIs $50k-75k, 5.5% for AGIs $75k-100k, 3.3% for AGIs $100k-200k, 2.7% for AGIs over 200k)
Taxable individual retirement arrangement distribution: $21,476 (reported on 5.7% of returns)
33405:
$21,476
Florida:
$21,544
(% of AGI for various income ranges: 1.3% for AGIs below $25k, 0.9% for AGIs $25k-50k, 2.4% for AGIs $50k-75k, 2.8% for AGIs $75k-100k, 4.4% for AGIs $100k-200k, 2.3% for AGIs over 200k)
Self-employment retirement plans: $22,325 (reported on 0.4% of returns)
33405:
$22,325
Florida:
$20,611
(% of AGI for various income ranges: 0.4% for AGIs $50k-75k, 0.3% for AGIs over 200k)
Total itemized deductions: $25,739 (17% of AGI, reported on 22.0% of returns)
Here:
$25,739
State:
$25,533
Here:
17.2% of AGI
State:
18.0% of AGI
(% of AGI for various income ranges: 6.6% for AGIs below $25k, 11.5% for AGIs $25k-50k, 13.4% for AGIs $50k-75k, 12.8% for AGIs $75k-100k, 14.5% for AGIs $100k-200k, 9.0% for AGIs over 200k)
Charity contributions: $5,161 (reported on 16.6% of returns)
Here:
$5,161
State:
$5,698
(% of AGI for various income ranges: 0.4% for AGIs below $25k, 0.9% for AGIs $25k-50k, 1.4% for AGIs $50k-75k, 1.5% for AGIs $75k-100k, 2.0% for AGIs $100k-200k, 2.1% for AGIs over 200k)
Taxes paid: $6,651 (reported on 20.9% of returns)
33405:
$6,651
State:
$6,203
(% of AGI for various income ranges: 1.3% for AGIs below $25k, 1.8% for AGIs $25k-50k, 2.3% for AGIs $50k-75k, 3.2% for AGIs $75k-100k, 3.5% for AGIs $100k-200k, 2.9% for AGIs over 200k)
Earned income credit: $2,224 (reported on 27.9% of returns)
Here:
$2,224
State:
$2,372
(% of AGI for various income ranges: 7.7% for AGIs below $25k, 1.2% for AGIs $25k-50k)
Percentage of individuals using paid preparers for their 2012 taxes: 64.1%
Here:
64%
State:
54%
(% for various income ranges: 62.4% for AGIs below $25k, 62.6% for AGIs $25k-50k, 62.2% for AGIs $50k-75k, 67.5% for AGIs $75k-100k, 73.1% for AGIs $100k-200k, 86.5% for AGIs over 200k)
Averages for the 2004 tax year for zip code 33405, filed in 2005:
Average Adjusted Gross Income (AGI) in 2004: $48,737 (Individual Income Tax Returns)
Here:
$48,737
State:
$50,523
Salary/wage: $37,883 (reported on 82.1% of returns)
Here:
$37,883
State:
$39,563
(% of AGI for various income ranges: 124.9% for AGIs below $10k, 81.2% for AGIs $10k-25k, 87.7% for AGIs $25k-50k, 79.6% for AGIs $50k-75k, 73.0% for AGIs $75k-100k, 44.8% for AGIs over 100k)
Taxable interest for individuals: $3,533 (reported on 32.6% of returns)
This zip code:
$3,533
Florida:
$3,211
(% of AGI for various income ranges: 7.6% for AGIs below $10k, 1.4% for AGIs $10k-25k, 0.8% for AGIs $25k-50k, 1.6% for AGIs $50k-75k, 1.7% for AGIs $75k-100k, 3.3% for AGIs over 100k)
Taxable dividends: $6,884 (reported on 19.1% of returns)
Here:
$6,884
State:
$6,129
(% of AGI for various income ranges: 6.6% for AGIs below $10k, 1.4% for AGIs $10k-25k, 1.1% for AGIs $25k-50k, 2.0% for AGIs $50k-75k, 3.4% for AGIs $75k-100k, 3.5% for AGIs over 100k)
Net capital gain/loss: +$27,920 (reported on 16.9% of returns)
Here:
+$27,920
State:
+$27,205
(% of AGI for various income ranges: 7.6% for AGIs below $10k, 0.3% for AGIs $10k-25k, 0.9% for AGIs $25k-50k, 1.8% for AGIs $50k-75k, 3.8% for AGIs $75k-100k, 17.6% for AGIs over 100k)
Profit/loss from business: +$12,118 (reported on 19.5% of returns)
Here:
+$12,118
State:
+$10,634
(% of AGI for various income ranges: 26.8% for AGIs below $10k, 9.8% for AGIs $10k-25k, 3.9% for AGIs $25k-50k, 3.9% for AGIs $50k-75k, 3.7% for AGIs $75k-100k, 3.9% for AGIs over 100k)
IRA payment deduction: $2,968 (reported on 2.4% of returns)
33405:
$2,968
Florida:
$3,082
(% of AGI for various income ranges: 0.5% for AGIs below $10k, 0.2% for AGIs $10k-25k, 0.2% for AGIs $25k-50k, 0.2% for AGIs $50k-75k, 0.2% for AGIs $75k-100k, 0.1% for AGIs over 100k)
Self-employed pension: $16,151 (reported on 0.6% of returns)
Here:
$16,151
Florida:
$15,857
(% of AGI for various income ranges: 0.1% for AGIs $10k-25k, 0.2% for AGIs $50k-75k, 0.3% for AGIs over 100k)
Total itemized deductions: $20,815 (22% of AGI, reported on 33.0% of returns)
Here:
$20,815
State:
$20,370
Here:
21.7% of AGI
State:
20.7% of AGI
(% of AGI for various income ranges: 20.4% for AGIs below $10k, 14.2% for AGIs $10k-25k, 18.0% for AGIs $25k-50k, 17.2% for AGIs $50k-75k, 16.9% for AGIs $75k-100k, 11.4% for AGIs over 100k)
Charity contributions deductions: $4,088 (4% of AGI, reported on 27.8% of returns)
Here:
$4,088
State:
$4,064
Here:
3.9% of AGI
State:
3.8% of AGI
(% of AGI for various income ranges: 1.1% for AGIs below $10k, 1.1% for AGIs $10k-25k, 1.6% for AGIs $25k-50k, 2.1% for AGIs $50k-75k, 2.6% for AGIs $75k-100k, 2.9% for AGIs over 100k)
Total tax: $10,107 (reported on 71.0% of returns)
33405:
$10,107
State:
$9,431
(% of AGI for various income ranges: 6.3% for AGIs below $10k, 4.1% for AGIs $10k-25k, 6.8% for AGIs $25k-50k, 10.0% for AGIs $50k-75k, 11.5% for AGIs $75k-100k, 21.7% for AGIs over 100k)
Earned income credit: $1,743 (reported on 24.0% of returns)
Here:
$1,743
State:
$1,808
Percentage of individuals using paid preparers for their 2004 taxes: 64.0%
Here:
64%
State:
60%
(% for various income ranges: 62.8% for AGIs below $10k, 65.2% for AGIs $10k-25k, 59.9% for AGIs $25k-50k, 61.2% for AGIs $50k-75k, 64.7% for AGIs $75k-100k, 78.6% for AGIs over 100k)
Likely homosexual households (counted as self-reported same-sex unmarried-partner households)
Lesbian couples: 0.0% of all households
Gay men: 0.2% of all households
Household received Food Stamps/SNAP in the past 12 months: 1,215 Household did not receive Food Stamps/SNAP in the past 12 months: 7,588
Women who had a birth in the past 12 months: 274 (260 now married, 24 unmarried) Women who did not have a birth in the past 12 months: 4,562 (1,607 now married, 2,954 unmarried)
Housing units in zip code 33405 with a mortgage: 2,795 (204 second mortgage, 154 both second mortgage and home equity loan) Houses without a mortgage: 15
Median monthly owner costs for units with a mortgage: $2,035 Median monthly owner costs for units without a mortgage: $745
Residents with income below the poverty level in 2022:
This zip code:
13.5%
Whole state:
12.7%
Residents with income below 50% of the poverty level in 2022:
This zip code:
9.5%
Whole state:
6.6%
Median number of rooms in houses and condos:
Here:
5.5
State:
5.9
Median number of rooms in apartments:
Here:
3.9
State:
4.2
Notable locations in this zip code not listed on our city pages
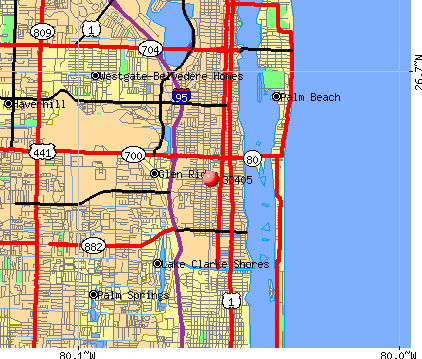
Notable locations in zip code 33405: Whisper Lakes Golf Course (A), Palm Beach Zoo at Dreher Park (B), Palm Coast Plaza (C), Belmart Shopping Plaza (D), South Florida Science Museum (E), West Palm Beach Fire Rescue Station 2 (F). Display/hide their locations on the map
Churches in zip code 33405 include: Belvedere Baptist Church (A), Gold Coast Baptist Church (B), Victory Baptist Church (C), Church of the Holy Apostles (D), Saint Anns Catholic Church (E), Trinity Temple (F), Holy Spirit Catholic Church (G), Family Worship Center (H), United Pentecostal Church of West Palm Beach (I). Display/hide their locations on the map
2,049 married couples with children.
1,043 single-parent households (497 men, 546 women).
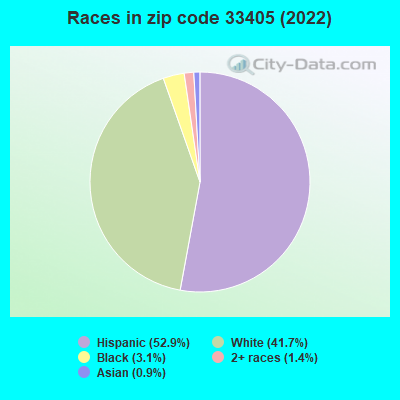
47.9% of residents of 33405 zip code speak English at home.
46.5% of residents speak Spanish at home (45% very well, 20% well, 23% not well, 12% not at all).
4.6% of residents speak other Indo-European language at home (76% very well, 14% well, 9% not well).
0.8% of residents speak Asian or Pacific Island language at home (61% very well, 18% well, 21% not well).
0.2% of residents speak other language at home (33% very well, 67% well).
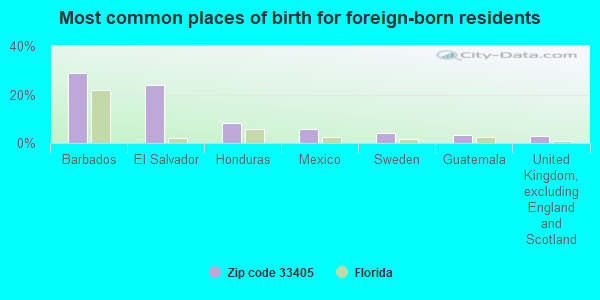
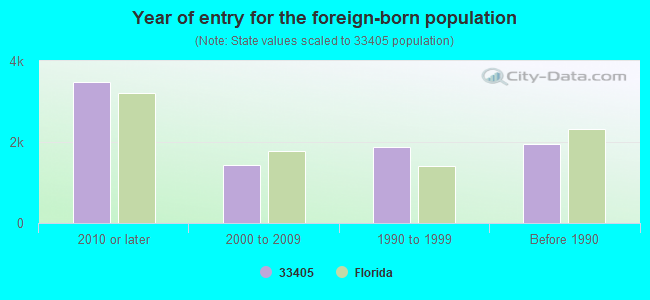
Foreign born population: 8,071 (38.5%) (45.0% of them are naturalized citizens)
Major facilities with environmental interests located in this zip code:
MIRROR IMAGE PLATING INC (1400 ALLENDALE RD #4 in WEST PALM BEACH, FL)
STATE MASTER (FDM) - CHAZ-FLR000070433, HAZARDOUS WASTE REGULATION PROGRAM (Resource Conservation and Recovery Act (tracking hazardous waste)) Business SIC and NAICS classification: ELECTROPLATING, PLATING, POLISHING, ANODIZING, AND COLORING Organizations: ERNEST RICH (CONTACT/OWNER)
Alternative names: MIROR IMAGE PLATING INC
SOUTH OLIVE ELEMENTARY SCHOOL (7101 S OLIVE AVE in WEST PALM BEACH, FL)
(Geographic Names Information System) (National Center for Education Statistics) - STATE ID-0572 Small Quantity Generators, between 100 kg and 1000 kg of hazardous waste/month (Resource Conservation and Recovery Act (tracking hazardous waste)) - notification Organizations: SNYDER MICHAEL ENV (CONTACT/OWNER)
, PALM BEACH COUNTY SCHOOL DISTRICT (SCHOOL DISTRICT)
Alternative names: PALM BEACH CO S OLIVE ELEM
PALM BEACH MARITIME ACADEMY (7719 SOUTH DIXIE HIGHWAY in WEST PALM BEACH, FL)
ENFORCEMENT/COMPLIANCE ACTIVITY (Integrated Compliance Information System) COMPLIANCE ACTIVITY (Tracking inspections of insecticide, fungicide, and rodenticide, and toxic substances) (National Center for Education Statistics) - STATE ID-2801 Organizations: PALM BEACH COUNTY SCHOOL DISTRICT (SCHOOL DISTRICT)
PALMETTO ELEMENTARY SCHOOL (5801 PARKER AVENUE in WEST PALM BEACH, FL)
(Geographic Names Information System) (National Center for Education Statistics) - STATE ID-0561 Organizations: PALM BEACH COUNTY SCHOOL DISTRICT (SCHOOL DISTRICT)
CUMBERLAND FARMS #0921 (3515 S DIXIE HWY in WEST PALM BEACH, FL)
National Pollutant Discharge Elimination System NON-MAJOR (Tracking pollutant discharge elimination systems) - permit National Pollutant Discharge Elimination System NON-MAJOR (Tracking pollutant discharge elimination systems) - permit Small Quantity Generators, between 100 kg and 1000 kg of hazardous waste/month (Resource Conservation and Recovery Act (tracking hazardous waste)) - notification Organizations: JOYCE SCHULTZ, UST COORD (CONTACT/OWNER)
Alternative names: CUMBERLAND FARMS, INC., CUMBERLAND FARMS STORE #0921
CONNISTON MIDDLE SCHOOL (673 CONNISTON RD in WEST PALM BEACH, FL)
(National Center for Education Statistics) - STATE ID-0541 Organizations: PALM BEACH COUNTY SCHOOL DISTRICT (SCHOOL DISTRICT)
MAINTENANCE DEPOT, INC. (516 MONCEAUX RD in WEST PALM BEACH, FL)
(Integrated Compliance Information System) - ICIS-04-2001-3020, FORMAL ENFORCEMENT ACTION
NORCROSS INDUSTRIES INC (6606 GEORGIA AVE in WEST PALM BEACH, FL)
Small Quantity Generators, between 100 kg and 1000 kg of hazardous waste/month (Resource Conservation and Recovery Act (tracking hazardous waste)) - notification (Resource Conservation and Recovery Act (tracking hazardous waste)) Organizations: CHARLES NORCROSS, PRES (CONTACT/OWNER)
, NON NOTIFIED (CONTACT/OWNER)
RAINY DAY INC (801 BELVEDERE ROAD in WEST PALM BEACH, FL)
AIR MINOR (AIRS/AFS) Small Quantity Generators, between 100 kg and 1000 kg of hazardous waste/month (Resource Conservation and Recovery Act (tracking hazardous waste)) - notification Business SIC classification: DRYCLEANING PLANTS, EXCEPT RUG CLEANING Organizations: JOSEPH C SMITH (CONTACT/OWNER)
Alternative names: BELVEDERE CLEANERS
SPARTAN CLEANERS OF THE PALM BEACHES INC (5500 S DIXIE HWY in WEST PALM BEACH, FL)
AIR MINOR (AIRS/AFS) Small Quantity Generators, between 100 kg and 1000 kg of hazardous waste/month (Resource Conservation and Recovery Act (tracking hazardous waste)) - notification Business SIC classification: DRYCLEANING PLANTS, EXCEPT RUG CLEANING Organizations: KENT MARTINDALE (CONTACT/OWNER)
Alternative names: SPARTAN DRY CLEANERS
ARTISTIC FINISHES INC (5325 GEORGIA AVE in WEST PALM BEACH, FL)
(Resource Conservation and Recovery Act (tracking hazardous waste)) Organizations: JACK LOWEN (CONTACT/OWNER)
ACANTHUS INTERNATIONAL (4901 GEORGIA AVE in WEST PALM BEACH, FL)
(Resource Conservation and Recovery Act (tracking hazardous waste)) Organizations: MARK BILLANE (CONTACT/OWNER)
Housing units lacking complete plumbing facilities: 0.7% Housing units lacking complete kitchen facilities: 1.3%
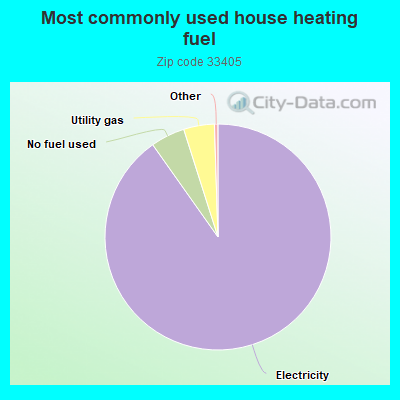
90.2%Electricity
4.9%No fuel used
4.4%Utility gas
Population in 1990: 18,164. Population change in the 1990s: +1,676 (+9.2%).
Place of birth for U.S.-born residents:
This state: 7,048
Northeast: 2,670
Midwest: 898
South: 1,220
West: 528
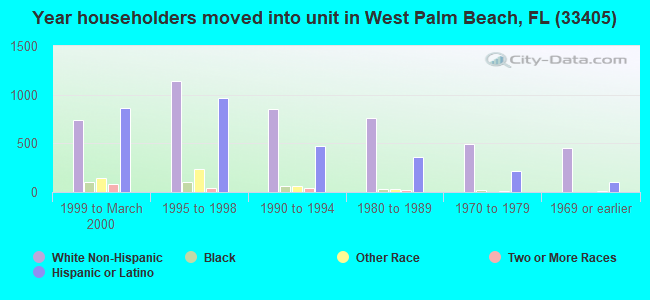
58% of the 33405 zip code residents lived in the same house 5 years ago. Out of people who lived in different houses, 69% lived in this county. Out of people who lived in different counties, 50% lived in Florida.
93% of the 33405 zip code residents lived in the same house 1 year ago. Out of people who lived in different houses, 68% moved from this county. Out of people who lived in different houses, 11% moved from different county within same state. Out of people who lived in different houses, 13% moved from different state. Out of people who lived in different houses, 5% moved from abroad.
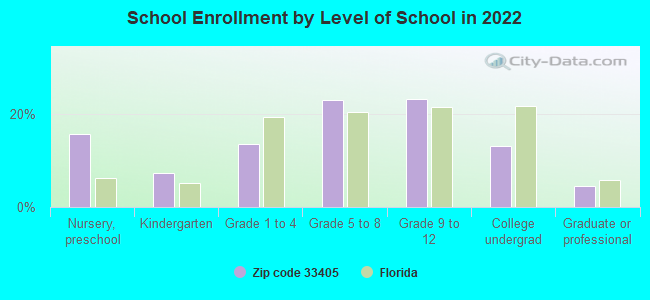
Private vs. public school enrollment:
Students in private schools in grades 1 to 8 (elementary and middle school): 367
Here:
27.6%
Florida:
15.8%
Students in private schools in grades 9 to 12 (high school): 115
Here:
13.8%
Florida:
12.9%
Students in private undergraduate colleges: 84
Here:
18.2%
Florida:
23.6%
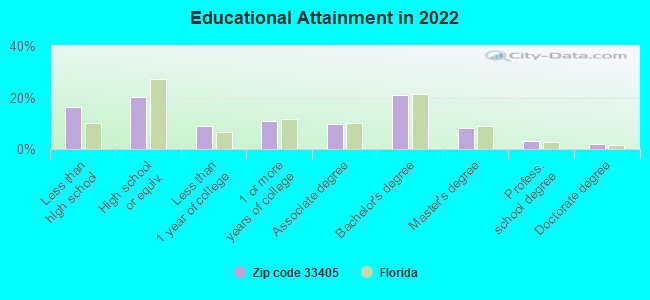
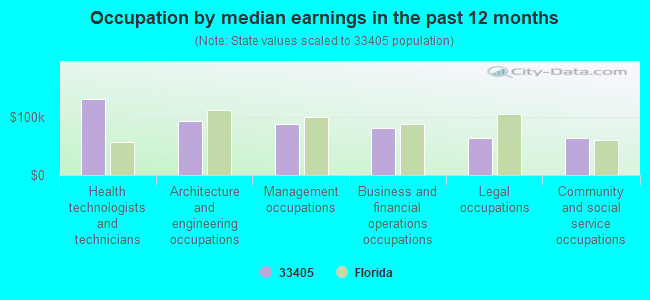
Occupation by median earnings in the past 12 months ($)
131,284Health technologists and technicians
93,940Architecture and engineering occupations
88,247Management occupations
80,845Business and financial operations occupations
63,972Legal occupations
63,795Community and social service occupations
Companies with federal contracts located in this zip code:
ERNESTON & SONS PRODUCE INC (1220 ORTEGA RD in WEST PALM BEAC, FL; small business) : $281,697 in 11 contractsfrom 2004 to 2005
Contracts for Fruits and Vegetables by Defense Logistics Agency Signed by year:2000: $0; 2001: $0; 2002: $0; 2003: $0; 2004: $36,165; 2005: $245,532; 2006: $0.
Biggest contracts:
$33,428 with Defense Logistics Agency for Fruits and Vegetables. Signed on 2005-09-29. Completion date: 2005-09-29.
$32,595, same as above.Signed on 2005-09-23. Completion date: 2005-09-23.
$31,883, same as above.Signed on 2005-10-05. Completion date: 2005-10-05.
$30,406, same as above.Signed on 2005-09-15. Completion date: 2005-09-15.
LANTROPIC, INC (220 WALTON BLVD APT 7 in WEST PALM BEAC, FL; small business) : $139,016 in 5 contractsin 2004
Contracts for Launchers, Rocket and Pyrotechnic, Centrifugals, Separators, and Pressure and Vacuum Filters, Valves, Nonpowered, Switches by Defense Logistics Agency Signed by year:2000: $0; 2001: $0; 2002: $0; 2003: $0; 2004: $139,016; 2005: $0; 2006: $0.
Biggest contracts:
$46,874 with Defense Logistics Agency for Launchers, Rocket and Pyrotechnic. Signed on 2004-04-22. Completion date: 2004-11-03.
$46,225 with Defense Logistics Agency for Centrifugals, Separators, and Pressure and Vacuum Filters. Signed on 2004-11-01. Completion date: 2005-07-04.
$29,477 with Defense Logistics Agency for Valves, Nonpowered. Signed on 2004-09-04. Completion date: 2005-02-11.
$8,220 with Defense Logistics Agency for Switches. Signed on 2004-11-08. Completion date: 2005-05-11.
PHILLIPS PALM BEACH, INC (1301 BELVEDERE ROAD in WEST PALM BEAC, FL; small business) : $28,342 in 5 contractsfrom 2003 to 2004
Contracts for Lodging - Hotel/Motel by Army Signed by year:2000: $0; 2001: $0; 2002: $0; 2003: $9,027; 2004: $19,315; 2005: $0; 2006: $0.
Biggest contracts:
$9,300 with Army for Lodging - Hotel/Motel. Signed on 2004-03-09. Completion date: 2004-03-10.
$9,027, same as above.Signed on 2003-01-10. Completion date: 2003-01-12.
$7,800, same as above.Signed on 2004-03-10. Completion date: 2004-03-14.
$1,495, same as above.Signed on 2004-03-11. Completion date: 2004-03-11.
U S COMPOSITES INC (5101 GEORGIA AVE in WEST PALM BEAC, FL; small business) : $9,336 in 4 contractsfrom 2004 to 2005
$5,361 with Army for Wallboard, Building Paper, and Thermal Insulation Materials. Signed on 2005-12-29. Completion date: 2006-01-09.
$1,898 with Navy for Textile Fabrics. Signed on 2004-12-22. Completion date: 2005-01-10.
$1,708 with Navy for Glass Fabricated Materials. Signed on 2005-06-03. Completion date: 2005-06-17.
$369 with Navy for Plastics Fabricated Materials. Signed on 2004-04-06. Completion date: 2004-04-06.
TOMASELLO INCOROPORATED (5311 GEORGIA AVE in WEST PALM BEAC, FL; small business) : $8,642 in 4 contractsfrom 2002 to 2004
$2,882 with Navy for Insect and Rodent Control Services. Signed on 2003-07-07. Completion date: 2003-08-10.
$2,880, same as above.Signed on 2004-07-29. Completion date: 2003-08-10.
$2,880, same as above.Signed on 2002-07-31. Completion date: 2003-08-10.
$0, same as above.Signed on 2002-07-31. Completion date: 2003-08-10.
ED SUSMAN (206 GREYMON DRIVE in WEST PALM BEACH, FL; small business) : $8,000 in 2 contractsin 2003
$8,000 with National Institutes of Health for Technical Writing Services. Signed on 2003-10-31. Effective on 2003-10-01. Completion date: 2004-09-30.
$0, same as above.Signed on 2003-10-31. Effective on 2003-10-01. Completion date: 2004-09-30.
SMITHCO WEST PALM BEACH, INC (4420 GEORGIA AVE in WEST PALM BEAC, FL; small business)
$5,358 with Army for Air Conditioning Equipment. Signed on 2006-06-23. Completion date: 2006-07-21.
PALM BEACH NEWSPAPERS, INC (2751 S DIXIE HWY in WEST PALM BEAC, FL)
$911 with Navy for Newspapers and Periodicals. Signed on 2004-07-06. Completion date: 2004-07-12.
Top industries in this zip code by the number of employees in 2005:
2003 - 2018 National Fire Incident Reporting System (NFIRS) incidents
Based on the data from the years 2003 - 2018 the average number of fire incidents per year is 46. The highest number of reported fire incidents - 78 took place in 2015, and the least - 0 in 2005. The data has a decreasing trend.
When looking into fire subcategories, the most reports belonged to: Structure Fires (41.8%), and Outside Fires (32.0%).
Fire incident types reported to NFIRS in Zip Code 33405


 Nearest zip codes: 33480, 33406, 33401, 33460, 33461, 33409.


 Based on the data from the years 2003 - 2018 the average number of fire incidents per year is 46. The highest number of reported fire incidents - 78 took place in 2015, and the least - 0 in 2005. The data has a decreasing trend.
 When looking into fire subcategories, the most reports belonged to: Structure Fires (41.8%), and Outside Fires (32.0%).