Estimated zip code population in 2022: 11,159 Zip code population in 2010: 9,549 Zip code population in 2000: 11,200
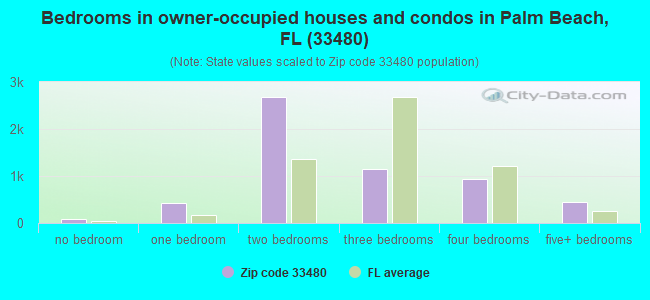
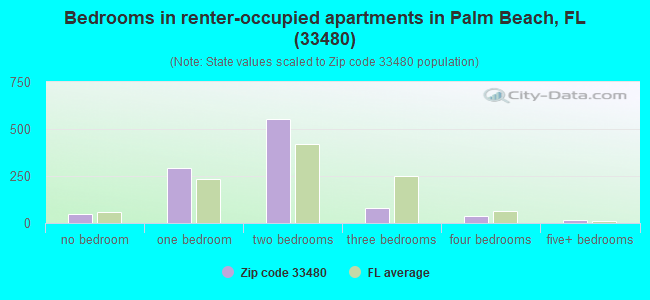
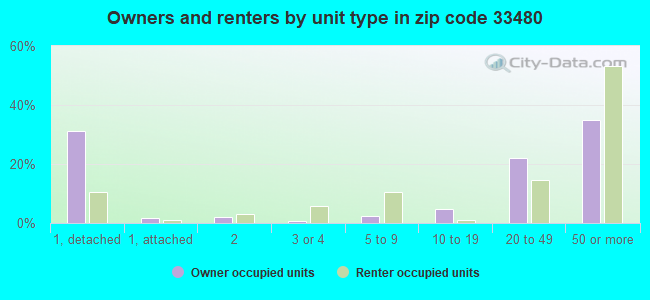
Houses and condos: 12,680 Renter-occupied apartments: 1,024
% of renters here:
15%
State:
33%
March 2022 cost of living index in zip code 33480: 104.1 (near average, U.S. average is 100)
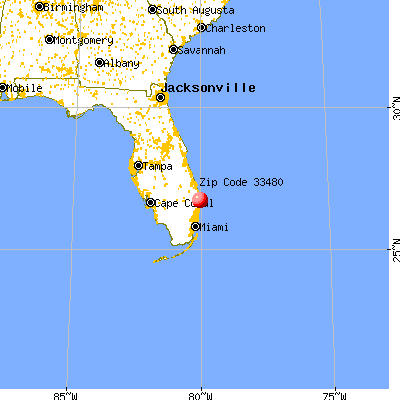
Land area: 4.4 sq. mi. Water area: 7.2 sq. mi.
Population density: 2,537 people per square mile
(average).
OSM Map
General Map
Google Map
MSN Map
OSM Map
General Map
Google Map
MSN Map
OSM Map
General Map
Google Map
MSN Map
OSM Map
General Map
Google Map
MSN Map
Please wait while loading the map...
Real estate property taxes paid for housing units in 2022:
This zip code:
0.7% ($10,425)
Florida:
0.7% ($2,529)
Median real estate property taxes paid for housing units with mortgages in 2022: $10,570 (0.7%) Median real estate property taxes paid for housing units with no mortgage in 2022: $10,318 (0.7%)
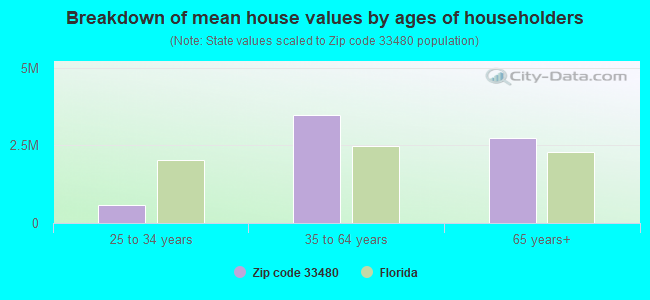
Estimated median house/condo value in 2022: $1,422,338
33480:
$1,422,338
Florida:
$354,100
According to our research of Florida and other state lists, there was 1 registered sex offender living in 33480 zip code as of April 27, 2024. The ratio of all residents to sex offenders in zip code 33480 is 9,985 to 1. The ratio of registered sex offenders to all residents in this zip code is much lower than the state average.
Median resident age:
This zip code:
70.5 years
Florida median age:
42.7 years
Average household size:
This zip code:
1.7 people
Florida:
2.5 people
Averages for the 2020 tax year for zip code 33480, filed in 2021:
Average Adjusted Gross Income (AGI) in 2020: $2,431,939 (Individual Income Tax Returns)
Here:
$2,431,939
State:
$82,200
Salary/wage: $514,536 (reported on 44.3% of returns)
Here:
$514,536
State:
$58,347
(% of AGI for various income ranges: 1050.0% for AGIs below $25k, 3710.6% for AGIs $25k-50k, 5938.2% for AGIs $50k-75k, 7785.3% for AGIs $75k-100k, 15176.5% for AGIs $100k-200k, 477065.6% for AGIs over 200k)
Taxable interest for individuals: $142,497 (reported on 71.5% of returns)
This zip code:
$142,497
Florida:
$4,272
(% of AGI for various income ranges: 147.9% for AGIs below $25k, 230.0% for AGIs $25k-50k, 480.0% for AGIs $50k-75k, 881.3% for AGIs $75k-100k, 2529.2% for AGIs $100k-200k, 223115.6% for AGIs over 200k)
Ordinary dividends: $424,691 (reported on 69.2% of returns)
Here:
$424,691
State:
$15,863
(% of AGI for various income ranges: 728.1% for AGIs below $25k, 906.9% for AGIs $25k-50k, 2610.5% for AGIs $50k-75k, 3726.0% for AGIs $75k-100k, 9739.2% for AGIs $100k-200k, 638528.1% for AGIs over 200k)
Net capital gain/loss in AGI: +$1,945,841 (reported on 68.9% of returns)
Here:
+$1,945,841
State:
+$62,983
(% of AGI for various income ranges: 228.4% for AGIs below $25k, 440.6% for AGIs $25k-50k, 1146.8% for AGIs $50k-75k, 2362.0% for AGIs $75k-100k, 6415.8% for AGIs $100k-200k, 2974311.5% for AGIs over 200k)
Profit/loss from business: +$103,888 (reported on 23.8% of returns)
Here:
+$103,888
State:
+$9,719
(% of AGI for various income ranges: 434.4% for AGIs below $25k, 658.1% for AGIs $25k-50k, 656.4% for AGIs $50k-75k, 728.7% for AGIs $75k-100k, 2410.4% for AGIs $100k-200k, 50289.6% for AGIs over 200k)
Taxable individual retirement arrangement distribution: $136,790 (reported on 19.5% of returns)
33480:
$136,790
Florida:
$24,823
(% of AGI for various income ranges: 188.4% for AGIs below $25k, 314.7% for AGIs $25k-50k, 1013.6% for AGIs $50k-75k, 1281.3% for AGIs $75k-100k, 4360.8% for AGIs $100k-200k, 52865.6% for AGIs over 200k)
Self-employed (Keogh) retirement plans: $55,583 (reported on 3.8% of returns)
33480:
$55,583
Florida:
$29,694
(% of AGI for various income ranges: 296.2% for AGIs $100k-200k, 4449.6% for AGIs over 200k)
Total itemized deductions: $539,109 (reported on 42.3% of returns)
Here:
$539,109
State:
$45,393
(% of AGI for various income ranges: 659.5% for AGIs below $25k, 1052.8% for AGIs $25k-50k, 1905.0% for AGIs $50k-75k, 2932.0% for AGIs $75k-100k, 6073.8% for AGIs $100k-200k, 495833.7% for AGIs over 200k)
Charity contributions: $475,575 (reported on 38.3% of returns)
Here:
$475,575
State:
$20,178
(% of AGI for various income ranges: 43.0% for AGIs below $25k, 155.6% for AGIs $25k-50k, 309.5% for AGIs $50k-75k, 536.0% for AGIs $75k-100k, 1263.1% for AGIs $100k-200k, 403100.0% for AGIs over 200k)
Taxes paid: $9,743 (reported on 42.1% of returns)
33480:
$9,743
State:
$6,967
(% of AGI for various income ranges: 125.1% for AGIs below $25k, 207.2% for AGIs $25k-50k, 368.6% for AGIs $50k-75k, 596.7% for AGIs $75k-100k, 1073.8% for AGIs $100k-200k, 7019.3% for AGIs over 200k)
Earned income credit: $1,206 (reported on 3.0% of returns)
Here:
$1,206
State:
$2,306
(% of AGI for various income ranges: 50.5% for AGIs below $25k)
Percentage of individuals using paid preparers for their 2020 taxes: 91.3%
Here:
91%
State:
92%
(% for various income ranges: 86.9% for AGIs below $25k, 92.1% for AGIs $25k-50k, 92.3% for AGIs $50k-75k, 92.5% for AGIs $75k-100k, 90.5% for AGIs $100k-200k, 93.0% for AGIs over 200k)
Averages for the 2012 tax year for zip code 33480, filed in 2013:
Average Adjusted Gross Income (AGI) in 2012: $966,673 (Individual Income Tax Returns)
Here:
$966,673
State:
$60,316
Salary/wage: $284,996 (reported on 45.7% of returns)
Here:
$284,996
State:
$45,277
(% of AGI for various income ranges: 47.6% for AGIs below $25k, 52.7% for AGIs $25k-50k, 36.3% for AGIs $50k-75k, 34.4% for AGIs $75k-100k, 24.2% for AGIs $100k-200k, 12.6% for AGIs over 200k)
Taxable interest for individuals: $82,779 (reported on 69.7% of returns)
This zip code:
$82,779
Florida:
$3,587
(% of AGI for various income ranges: 8.0% for AGIs below $25k, 8.8% for AGIs $25k-50k, 5.6% for AGIs $50k-75k, 6.1% for AGIs $75k-100k, 6.4% for AGIs $100k-200k, 5.9% for AGIs over 200k)
Ordinary dividends: $228,229 (reported on 65.2% of returns)
Here:
$228,229
State:
$12,831
(% of AGI for various income ranges: 20.1% for AGIs below $25k, 14.4% for AGIs $25k-50k, 14.3% for AGIs $50k-75k, 16.3% for AGIs $75k-100k, 18.2% for AGIs $100k-200k, 15.3% for AGIs over 200k)
Net capital gain/loss in AGI: +$719,638 (reported on 64.3% of returns)
Here:
+$719,638
State:
+$33,493
(% of AGI for various income ranges: 1.4% for AGIs $25k-50k, 2.3% for AGIs $50k-75k, 3.6% for AGIs $75k-100k, 8.1% for AGIs $100k-200k, 49.7% for AGIs over 200k)
Profit/loss from business: +$51,163 (reported on 20.6% of returns)
Here:
+$51,163
State:
+$10,012
(% of AGI for various income ranges: 9.7% for AGIs below $25k, 4.6% for AGIs $25k-50k, 4.8% for AGIs $50k-75k, 3.6% for AGIs $75k-100k, 3.5% for AGIs $100k-200k, 1.0% for AGIs over 200k)
Taxable individual retirement arrangement distribution: $151,549 (reported on 29.0% of returns)
33480:
$151,549
Florida:
$21,544
(% of AGI for various income ranges: 7.3% for AGIs below $25k, 6.3% for AGIs $25k-50k, 8.0% for AGIs $50k-75k, 9.2% for AGIs $75k-100k, 12.1% for AGIs $100k-200k, 4.3% for AGIs over 200k)
Self-employment retirement plans: $44,300 (reported on 2.0% of returns)
33480:
$44,300
Florida:
$20,611
(% of AGI for various income ranges: 2.2% for AGIs below $25k)
Total itemized deductions: $219,355 (14% of AGI, reported on 62.2% of returns)
Here:
$219,355
State:
$25,533
Here:
14.4% of AGI
State:
18.0% of AGI
(% of AGI for various income ranges: 45.7% for AGIs below $25k, 27.6% for AGIs $25k-50k, 24.9% for AGIs $50k-75k, 27.5% for AGIs $75k-100k, 27.3% for AGIs $100k-200k, 13.5% for AGIs over 200k)
Charity contributions: $94,448 (reported on 56.1% of returns)
Here:
$94,448
State:
$5,698
(% of AGI for various income ranges: 2.5% for AGIs below $25k, 3.0% for AGIs $25k-50k, 2.8% for AGIs $50k-75k, 3.3% for AGIs $75k-100k, 4.2% for AGIs $100k-200k, 5.6% for AGIs over 200k)
Taxes paid: $66,196 (reported on 61.5% of returns)
33480:
$66,196
State:
$6,203
(% of AGI for various income ranges: 13.3% for AGIs below $25k, 7.4% for AGIs $25k-50k, 7.7% for AGIs $50k-75k, 9.3% for AGIs $75k-100k, 9.6% for AGIs $100k-200k, 4.0% for AGIs over 200k)
Earned income credit: $1,362 (reported on 4.3% of returns)
Here:
$1,362
State:
$2,372
(% of AGI for various income ranges: 1.9% for AGIs below $25k, 0.1% for AGIs $25k-50k)
Percentage of individuals using paid preparers for their 2012 taxes: 81.5%
Here:
82%
State:
54%
(% for various income ranges: 69.9% for AGIs below $25k, 68.4% for AGIs $25k-50k, 75.5% for AGIs $50k-75k, 81.6% for AGIs $75k-100k, 88.3% for AGIs $100k-200k, 95.4% for AGIs over 200k)
Averages for the 2004 tax year for zip code 33480, filed in 2005:
Average Adjusted Gross Income (AGI) in 2004: $512,703 (Individual Income Tax Returns)
Here:
$512,703
State:
$50,523
Salary/wage: $180,172 (reported on 40.3% of returns)
Here:
$180,172
State:
$39,563
(% of AGI for various income ranges: 39.3% for AGIs $10k-25k, 46.4% for AGIs $25k-50k, 31.9% for AGIs $50k-75k, 27.9% for AGIs $75k-100k, 12.4% for AGIs over 100k)
Taxable interest for individuals: $68,520 (reported on 80.3% of returns)
This zip code:
$68,520
Florida:
$3,211
(% of AGI for various income ranges: 14.0% for AGIs $10k-25k, 11.0% for AGIs $25k-50k, 9.3% for AGIs $50k-75k, 10.7% for AGIs $75k-100k, 9.7% for AGIs over 100k)
Taxable dividends: $95,197 (reported on 71.9% of returns)
Here:
$95,197
State:
$6,129
(% of AGI for various income ranges: 19.8% for AGIs $10k-25k, 13.6% for AGIs $25k-50k, 16.1% for AGIs $50k-75k, 14.1% for AGIs $75k-100k, 12.1% for AGIs over 100k)
Net capital gain/loss: +$403,105 (reported on 70.8% of returns)
Here:
+$403,105
State:
+$27,205
(% of AGI for various income ranges: -0.0% for AGIs $10k-25k, 7.2% for AGIs $25k-50k, 6.0% for AGIs $50k-75k, 7.3% for AGIs $75k-100k, 53.4% for AGIs over 100k)
Profit/loss from business: +$38,852 (reported on 20.6% of returns)
Here:
+$38,852
State:
+$10,634
(% of AGI for various income ranges: 10.5% for AGIs $10k-25k, 3.4% for AGIs $25k-50k, 3.1% for AGIs $50k-75k, 5.0% for AGIs $75k-100k, 1.3% for AGIs over 100k)
IRA payment deduction: $3,941 (reported on 3.4% of returns)
33480:
$3,941
Florida:
$3,082
(% of AGI for various income ranges: 0.5% for AGIs $10k-25k, 0.5% for AGIs $25k-50k, 0.3% for AGIs $50k-75k, 0.2% for AGIs $75k-100k, 0.0% for AGIs over 100k)
Self-employed pension: $25,810 (reported on 2.5% of returns)
Here:
$25,810
Florida:
$15,857
(% of AGI for various income ranges: 0.5% for AGIs $10k-25k, 0.3% for AGIs $50k-75k, 0.1% for AGIs over 100k)
Total itemized deductions: $137,666 (17% of AGI, reported on 63.9% of returns)
Here:
$137,666
State:
$20,370
Here:
17.0% of AGI
State:
20.7% of AGI
(% of AGI for various income ranges: 47.0% for AGIs $10k-25k, 36.3% for AGIs $25k-50k, 32.3% for AGIs $50k-75k, 33.1% for AGIs $75k-100k, 15.4% for AGIs over 100k)
Charity contributions deductions: $55,408 (6% of AGI, reported on 58.1% of returns)
Here:
$55,408
State:
$4,064
Here:
6.5% of AGI
State:
3.8% of AGI
(% of AGI for various income ranges: 4.0% for AGIs $10k-25k, 3.2% for AGIs $25k-50k, 4.5% for AGIs $50k-75k, 4.8% for AGIs $75k-100k, 6.0% for AGIs over 100k)
Total tax: $124,653 (reported on 82.9% of returns)
33480:
$124,653
State:
$9,431
(% of AGI for various income ranges: 4.9% for AGIs $10k-25k, 8.1% for AGIs $25k-50k, 9.7% for AGIs $50k-75k, 11.3% for AGIs $75k-100k, 19.4% for AGIs over 100k)
Earned income credit: $811 (reported on 2.7% of returns)
Here:
$811
State:
$1,808
Percentage of individuals using paid preparers for their 2004 taxes: 83.8%
Here:
84%
State:
60%
(% for various income ranges: 78.1% for AGIs below $10k, 75.6% for AGIs $10k-25k, 75.8% for AGIs $25k-50k, 81.9% for AGIs $50k-75k, 82.3% for AGIs $75k-100k, 92.5% for AGIs over 100k)
Likely homosexual households (counted as self-reported same-sex unmarried-partner households)
Lesbian couples: 0.0% of all households
Gay men: 0.6% of all households
Household received Food Stamps/SNAP in the past 12 months: 103 Household did not receive Food Stamps/SNAP in the past 12 months: 6,669
Women who had a birth in the past 12 months: 12 (13 now married, 0 unmarried) Women who did not have a birth in the past 12 months: 565 (276 now married, 289 unmarried)
Housing units in zip code 33480 with a mortgage: 1,422 (192 second mortgage, 184 both second mortgage and home equity loan) Houses without a mortgage: 10
Median monthly owner costs for units with a mortgage: $3,987 Median monthly owner costs for units without a mortgage: $1,523
Residents with income below the poverty level in 2022:
This zip code:
5.9%
Whole state:
12.7%
Residents with income below 50% of the poverty level in 2022:
This zip code:
2.6%
Whole state:
6.6%
Median number of rooms in houses and condos:
Here:
5.2
State:
5.9
Median number of rooms in apartments:
Here:
4.0
State:
4.2
Notable locations in this zip code not listed on our city pages
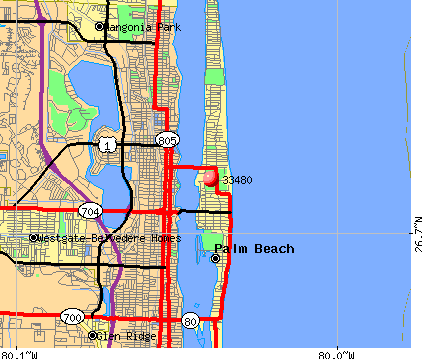
Notable locations in zip code 33480: Lake Worth Pier Obstruction Lights (A), Breakers Ocean Golf Course (B), Everglades Golf Course (C), Historical Society of Palm Beach County Library (D), Mar-A-Lago Building (E), South Palm Beach Fire Department (closed) (F), Palm Beach Fire Rescue Administration Office (G), Palm Beach Fire Rescue Station 2 (H), Palm Beach Fire Rescue Station 3 (I), Palm Beach Fire Rescue Station 1 Headquarters (J), Palm Beach Police Department (K), Palm Beach Police Department - Beach Patrol (L), Palm Beach Police Department (M), South Palm Beach Public Safety Department (N). Display/hide their locations on the map
Churches in zip code 33480 include: Lighthouse Baptist Church (A), Grace Evangelical Free Church (B), Nativity Lutheran Church (C). Display/hide their locations on the map
In group quarters: 1 (-1 institutionalized population)
Size of family households: 2,893 2-persons, 329 3-persons, 81 4-persons, 32 5-persons, 40 6-persons
Size of nonfamily households: 2,983 1-person, 358 2-persons
403 married couples with children.
141 single-parent households (62 men, 79 women).
85.6% of residents of 33480 zip code speak English at home.
6.5% of residents speak Spanish at home (88% very well, 5% well, 1% not well, 7% not at all).
7.3% of residents speak other Indo-European language at home (80% very well, 13% well, 8% not well).
1.5% of residents speak Asian or Pacific Island language at home (44% very well, 44% well, 12% not well).
0.5% of residents speak other language at home (27% very well, 43% well, 30% not well).
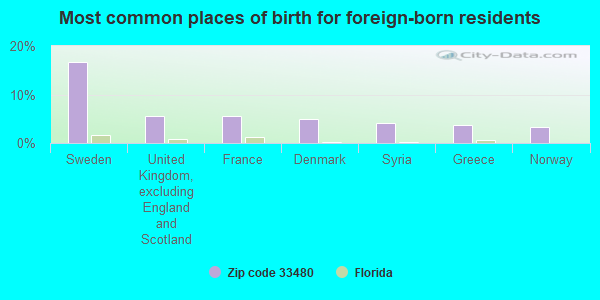
Foreign born population: 2,384 (21.4%) (66.0% of them are naturalized citizens)
This zip code:
21.4%
Whole state:
21.7%
17%Sweden
6%United Kingdom, excluding England and Scotland
6%France
5%Denmark
4%Syria
4%Greece
3%Norway
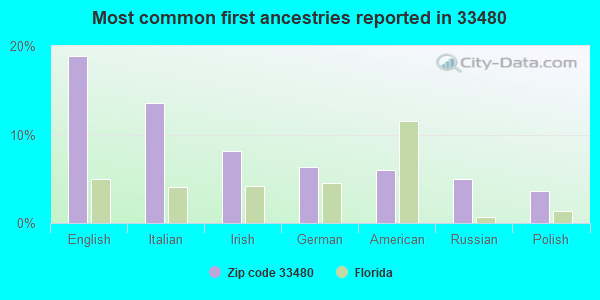
19%English
14%Italian
8%Irish
6%German
6%American
5%Russian
4%Polish
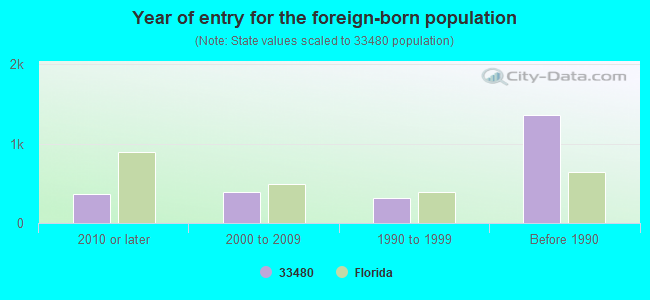
Year of entry for the foreign-born population
3642010 or later
3952000 to 2009
3131990 to 1999
1,360Before 1990
Major facilities with environmental interests located in this zip code:
PALM BEACH PUBLIC SCHOOL (240 COCONUT ROW in PALM BEACH, FL)
(Geographic Names Information System) (National Center for Education Statistics) - STATE ID-0421 Organizations: PALM BEACH COUNTY SCHOOL DISTRICT (SCHOOL DISTRICT)
PROJECT RESPECT (N/A in PALM BEACH COUNTY, FL)
(National Center for Education Statistics) - STATE ID-5355 Organizations: PALM BEACH COUNTY SCHOOL DISTRICT (SCHOOL DISTRICT)
PALM BEACH AIRCRAFT PAINTING, INC (1515 PERIMETER RD HANGAR 2 in PALM BEACH, FL)
AIR SYNTHETIC MINOR (AIRS/AFS) Small Quantity Generators, between 100 kg and 1000 kg of hazardous waste/month (Resource Conservation and Recovery Act (tracking hazardous waste)) - notification (Resource Conservation and Recovery Act (tracking hazardous waste)) Business SIC classification: AIRPORTS, FLYING FIELDS, AND AIRPORT TERMINAL SERVICES Organizations: GILLES PAQUET, PRES (CONTACT/OWNER)
, BILL STINSON (CONTACT/OWNER)
Alternative names: JET AVIATION ASSOC LTD
SCOTTSGLADES (LOTS 1-4) (138TH TERRACE S in PALM BEACH, FL)
(Integrated Compliance Information System) - ICIS-04-1999-0009, FORMAL ENFORCEMENT ACTION, ICIS-04-1999-0163,
229858-1-52-01 (SR A1A FROM SR 802 TO SLOAN'S in CITY OF LAKE WORTH, FL)
National Pollutant Discharge Elimination System NON-MAJOR (Tracking pollutant discharge elimination systems) - permit Organizations: DANIEL WEEKLEY (CONTACT/OWNER)
HAGAN RANCH ROAD (UNINCORPORATED PALM in PALM BEACH, FL)
National Pollutant Discharge Elimination System NON-MAJOR (Tracking pollutant discharge elimination systems) - permit Business SIC classification: SEWERAGE SYSTEMS Organizations: SOUTHERN REGION WWTP (CONTACT/OPERATOR)
, PALM BEACH CNTY WTR UTIL DEPT (CONTACT/OWNER)
Alternative names: PALM BCH CNTY WTR UTIL DEPT
L-8 SEEPAGE BARRIER (20 MILES SE OF STRUCTURE S-76 in PALM BEACH, FL)
National Pollutant Discharge Elimination System NON-MAJOR (Tracking pollutant discharge elimination systems) - permit Organizations: RICHARD EVANS (CONTACT/OWNER)
QUANTUM BUILDING 8 & 9 (HIGH RIDGE RD. in PALM BEACH, FL)
National Pollutant Discharge Elimination System NON-MAJOR (Tracking pollutant discharge elimination systems) - permit Organizations: ANDY PRIBYL (CONTACT/OWNER)
D-8 STORM WATER PUMP STATION (COUNTRY CLUB RD/SLOPE TRAIL in PALM BEACH, FL)
National Pollutant Discharge Elimination System NON-MAJOR (Tracking pollutant discharge elimination systems) - permit Organizations: DAVID LOGAN (CONTACT/OWNER)
SEACOAST UTILITIES (11498 NURSERY LANE in PALM BEACH, FL)
National Pollutant Discharge Elimination System NON-MAJOR (Tracking pollutant discharge elimination systems) - permit Business SIC classification: SEWERAGE SYSTEMS Organizations: SEACOAST UTILITY AUTHORITY (CONTACT/OPERATOR)
, RIM BISHOP (CONTACT/OWNER)
Alternative names: SEACOAST UTILITY AUTHORITY
LAKE VIEW RESIDENCE (1900 SOUTH OCEAN BLVD in PALM BEACH, FL)
National Pollutant Discharge Elimination System NON-MAJOR (Tracking pollutant discharge elimination systems) - permit Organizations: DAVID FESSLER (CONTACT/OWNER)
Alternative names: TULSA DRIVE STORMWATER RETROFI
MAR A LAGO CLUB INC (1100 S OCEAN BLVD in PALM BEACH, FL)
(Resource Conservation and Recovery Act (tracking hazardous waste)) Organizations: DONALD TRUMP (CONTACT/OWNER)
MAR-A-LAGO GRAND BALLROOM (1100 S OCEAN BLVD in PALM BEACH, FL)
National Pollutant Discharge Elimination System NON-MAJOR (Tracking pollutant discharge elimination systems) - permit Organizations: TOM EASTWOOD (CONTACT/OWNER)
Housing units lacking complete plumbing facilities: 0.4% Housing units lacking complete kitchen facilities: 0.6%
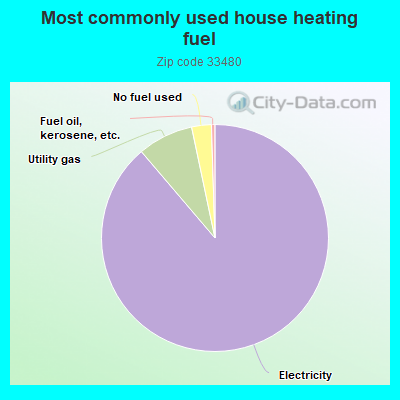
88.6%Electricity
7.9%Utility gas
2.8%No fuel used
0.5%Fuel oil, kerosene, etc.
Population in 1990: 6,588. Population change in the 1990s: +4,612 (+70.0%).
Place of birth for U.S.-born residents:
This state: 987
Northeast: 4,399
Midwest: 1,520
South: 1,280
West: 457
62% of the 33480 zip code residents lived in the same house 5 years ago. Out of people who lived in different houses, 48% lived in this county. Out of people who lived in different counties, 50% lived in Florida.
88% of the 33480 zip code residents lived in the same house 1 year ago. Out of people who lived in different houses, 58% moved from this county. Out of people who lived in different houses, 4% moved from different county within same state. Out of people who lived in different houses, 24% moved from different state. Out of people who lived in different houses, 13% moved from abroad.
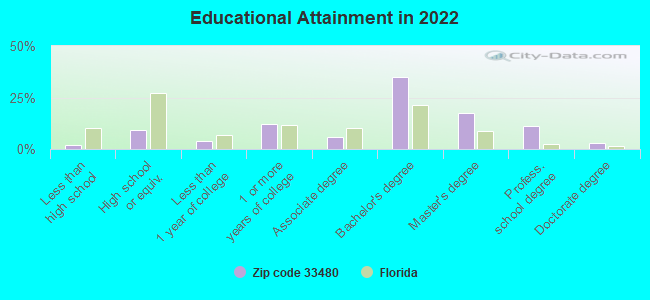
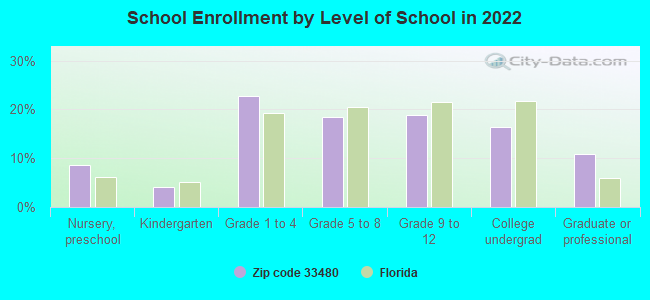
Private vs. public school enrollment:
Students in private schools in grades 1 to 8 (elementary and middle school): 204
Here:
74.9%
Florida:
15.8%
Students in private schools in grades 9 to 12 (high school): 111
Here:
89.5%
Florida:
12.9%
Students in private undergraduate colleges: 52
Here:
47.9%
Florida:
23.6%
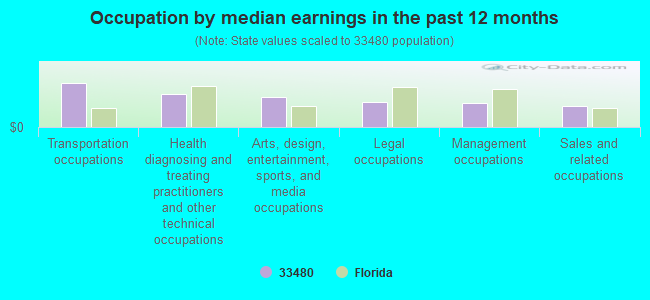
Occupation by median earnings in the past 12 months ($)
251,922Transportation occupations
186,716Health diagnosing and treating practitioners and other technical occupations
173,177Arts, design, entertainment, sports, and media occupations
145,740Legal occupations
135,717Management occupations
118,424Sales and related occupations
Companies with federal contracts located in this zip code (PALM BEACH, FL):
ARCHITECT PLANNERS (901 N POINT PKWY STE 101; small business) 2 employees, $100000 revenue. Woman Owned Business: $258,140 in 2 contractsfrom 2002 to 2003
$223,140 with Department of Veterans Affairs for Hospital Buildings. Signed on 2003-07-15. Completion date: 2004-09-15.
$35,000 with Department of Veterans Affairs for Architect - Engineer Services (including landscaping, interior layout, and designing). Signed on 2002-10-15. Completion date: 2003-03-15.
AT&T WIRELESS SERVICES OF FLOR (255 SUNRISE AVE) : $101,091 in 5 contractsin 2001
Contracts for Lease or Rental of Equipment -- Communication, Detection, and Coherent Radiation Equipment by Air Force Signed by year:2000: $0; 2001: $101,091; 2002: $0; 2003: $0; 2004: $0; 2005: $0; 2006: $0.
Biggest contracts:
$33,697 with Air Force for Lease or Rental of Equipment -- Communication, Detection, and Coherent Radiation Equipment. Signed on 2001-09-30. Completion date: 2001-08-31.
$33,697, same as above.Signed on 2001-09-04. Completion date: 2001-08-31.
$33,697, same as above.Signed on 2001-09-05. Completion date: 2001-08-31.
$0, same as above.Signed on 2001-09-05. Completion date: 2001-08-31.
INNKEEPERS HOSPITALITY (302 ROYAL POCINCIANA PLAZA)
$8,162 with Army for Miscellaneous Items. Taking place in WA. Signed on 2004-05-03. Completion date: 2004-04-30.
MASONWAYS INDESTRUCTIBLE PLAST (189 BRADLEY PL STE 1; small business)
$7,728 with Defense Commissary Agency for Miscellaneous Furniture and Fixtures. Signed on 2005-03-24. Completion date: 2005-04-27.
Top industries in this zip code by the number of employees in 2005:
Arts, Entertainment, and Recreation: Golf Courses and Country Clubs (250-499: 2, 100-249: 2, 50-99: 1, 10-19: 1, 5-9: 1)
Other Services (except Public Administration): Other Similar Organizations (except Business, Professional, Labor, and Political Organizations) (50-99: 1, 20-49: 9, 10-19: 34, 5-9: 17, 1-4: 24)
2002 - 2018 National Fire Incident Reporting System (NFIRS) incidents
According to the data from the years 2002 - 2018 the average number of fire incidents per year is 21. The highest number of fire incidents - 43 took place in 2015, and the least - 0 in 2003. The data has a rising trend.
When looking into fire subcategories, the most reports belonged to: Structure Fires (47.8%), and Outside Fires (42.8%).
Fire incident types reported to NFIRS in Zip Code 33480


 Nearest zip codes: 33405, 33401, 33406, 33409, 33460, 33461.


 According to the data from the years 2002 - 2018 the average number of fire incidents per year is 21. The highest number of fire incidents - 43 took place in 2015, and the least - 0 in 2003. The data has a rising trend.
 When looking into fire subcategories, the most reports belonged to: Structure Fires (47.8%), and Outside Fires (42.8%).