Estimated zip code population in 2022: 53,337 Zip code population in 2010: 44,963 Zip code population in 2000: 39,584
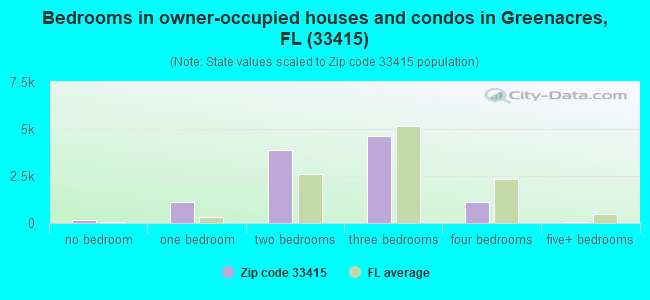
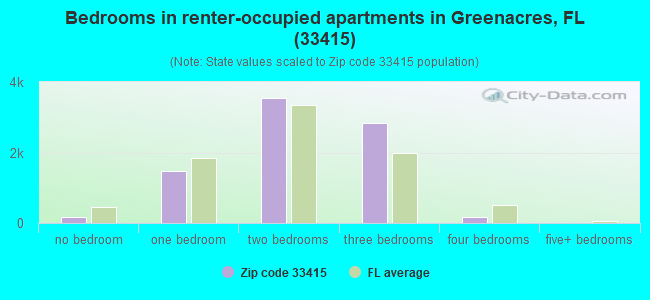
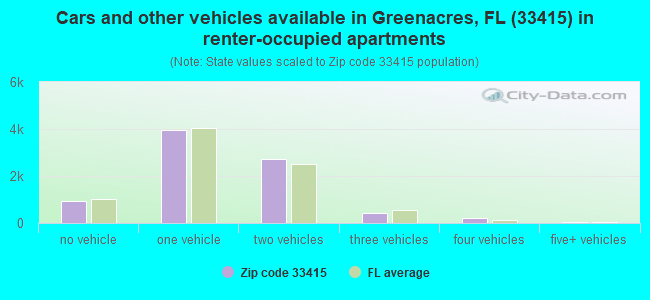
Houses and condos: 20,992 Renter-occupied apartments: 8,312
% of renters here:
43%
State:
33%
March 2022 cost of living index in zip code 33415: 99.4 (near average, U.S. average is 100)
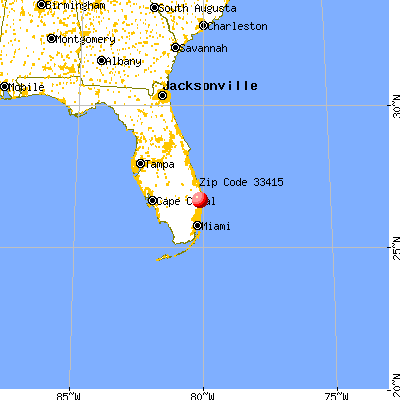
Land area: 7.4 sq. mi. Water area: 0.0 sq. mi.
Population density: 7,210 people per square mile
(high).
OSM Map
General Map
Google Map
MSN Map
OSM Map
General Map
Google Map
MSN Map
OSM Map
General Map
Google Map
MSN Map
OSM Map
General Map
Google Map
MSN Map
Please wait while loading the map...
Real estate property taxes paid for housing units in 2022:
This zip code:
0.6% ($1,427)
Florida:
0.7% ($2,529)
Median real estate property taxes paid for housing units with mortgages in 2022: $1,680 (0.6%) Median real estate property taxes paid for housing units with no mortgage in 2022: $1,193 (0.6%)
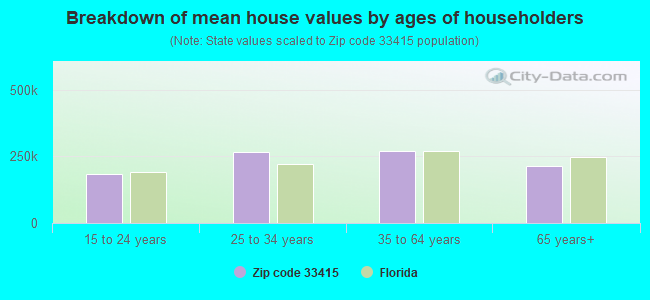
Estimated median house/condo value in 2022: $247,216
33415:
$247,216
Florida:
$354,100
According to our research of Florida and other state lists, there were 51 registered sex offenders living in 33415 zip code as of April 27, 2024. The ratio of all residents to sex offenders in zip code 33415 is 993 to 1. The ratio of registered sex offenders to all residents in this zip code is lower than the state average.
Median resident age:
This zip code:
39.8 years
Florida median age:
42.7 years
Average household size:
This zip code:
2.7 people
Florida:
2.5 people
Averages for the 2020 tax year for zip code 33415, filed in 2021:
Average Adjusted Gross Income (AGI) in 2020: $35,118 (Individual Income Tax Returns)
Here:
$35,118
State:
$82,200
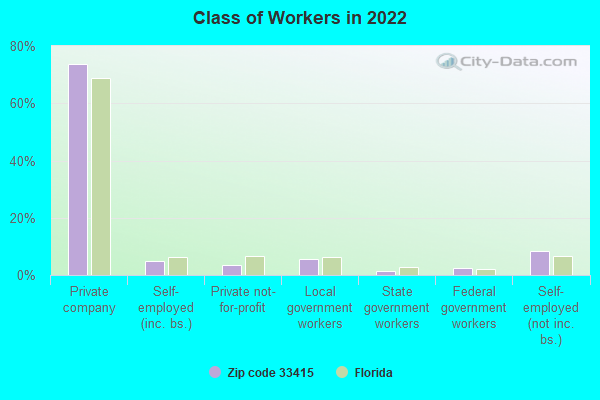
Salary/wage: $34,647 (reported on 79.4% of returns)
Here:
$34,647
State:
$58,347
(% of AGI for various income ranges: 1247.4% for AGIs below $25k, 3826.4% for AGIs $25k-50k, 6948.8% for AGIs $50k-75k, 9742.5% for AGIs $75k-100k, 16277.3% for AGIs $100k-200k, 65620.0% for AGIs over 200k)
Taxable interest for individuals: $881 (reported on 9.8% of returns)
This zip code:
$881
Florida:
$4,272
(% of AGI for various income ranges: 4.5% for AGIs below $25k, 6.2% for AGIs $25k-50k, 15.7% for AGIs $50k-75k, 13.2% for AGIs $75k-100k, 112.1% for AGIs $100k-200k, 1126.7% for AGIs over 200k)
Ordinary dividends: $2,486 (reported on 6.1% of returns)
Here:
$2,486
State:
$15,863
(% of AGI for various income ranges: 6.3% for AGIs below $25k, 12.0% for AGIs $25k-50k, 30.6% for AGIs $50k-75k, 79.6% for AGIs $75k-100k, 166.2% for AGIs $100k-200k, 886.7% for AGIs over 200k)
Net capital gain/loss in AGI: +$8,760 (reported on 6.0% of returns)
Here:
+$8,760
State:
+$62,983
(% of AGI for various income ranges: 1.2% for AGIs below $25k, 14.9% for AGIs $25k-50k, 50.6% for AGIs $50k-75k, 173.3% for AGIs $75k-100k, 616.9% for AGIs $100k-200k, 21553.3% for AGIs over 200k)
Profit/loss from business: +$5,313 (reported on 33.9% of returns)
Here:
+$5,313
State:
+$9,719
(% of AGI for various income ranges: 281.8% for AGIs below $25k, 156.2% for AGIs $25k-50k, 206.0% for AGIs $50k-75k, 208.5% for AGIs $75k-100k, 638.3% for AGIs $100k-200k)
Taxable individual retirement arrangement distribution: $12,123 (reported on 3.1% of returns)
33415:
$12,123
Florida:
$24,823
(% of AGI for various income ranges: 16.5% for AGIs below $25k, 30.6% for AGIs $25k-50k, 94.4% for AGIs $50k-75k, 146.3% for AGIs $75k-100k, 533.1% for AGIs $100k-200k)
Total itemized deductions: $26,985 (reported on 3.1% of returns)
Here:
$26,985
State:
$45,393
(% of AGI for various income ranges: 19.8% for AGIs below $25k, 104.3% for AGIs $25k-50k, 227.2% for AGIs $50k-75k, 378.8% for AGIs $75k-100k, 526.5% for AGIs $100k-200k, 7173.3% for AGIs over 200k)
Charity contributions: $8,432 (reported on 2.1% of returns)
Here:
$8,432
State:
$20,178
(% of AGI for various income ranges: 1.4% for AGIs below $25k, 14.2% for AGIs $25k-50k, 42.9% for AGIs $50k-75k, 78.1% for AGIs $75k-100k, 167.7% for AGIs $100k-200k, 3353.3% for AGIs over 200k)
Taxes paid: $5,029 (reported on 3.0% of returns)
33415:
$5,029
State:
$6,967
(% of AGI for various income ranges: 3.0% for AGIs below $25k, 18.5% for AGIs $25k-50k, 46.2% for AGIs $50k-75k, 66.2% for AGIs $75k-100k, 102.3% for AGIs $100k-200k, 856.7% for AGIs over 200k)
Earned income credit: $2,483 (reported on 32.1% of returns)
Here:
$2,483
State:
$2,306
(% of AGI for various income ranges: 158.9% for AGIs below $25k, 85.1% for AGIs $25k-50k, 1.5% for AGIs $50k-75k)
Percentage of individuals using paid preparers for their 2020 taxes: 90.1%
Here:
90%
State:
92%
(% for various income ranges: 88.1% for AGIs below $25k, 92.1% for AGIs $25k-50k, 92.4% for AGIs $50k-75k, 92.1% for AGIs $75k-100k, 91.0% for AGIs $100k-200k, 91.7% for AGIs over 200k)
Averages for the 2012 tax year for zip code 33415, filed in 2013:
Average Adjusted Gross Income (AGI) in 2012: $28,549 (Individual Income Tax Returns)
Here:
$28,549
State:
$60,316
Salary/wage: $27,851 (reported on 83.5% of returns)
Here:
$27,851
State:
$45,277
(% of AGI for various income ranges: 79.9% for AGIs below $25k, 89.3% for AGIs $25k-50k, 84.3% for AGIs $50k-75k, 82.5% for AGIs $75k-100k, 72.8% for AGIs $100k-200k, 31.4% for AGIs over 200k)
Taxable interest for individuals: $1,206 (reported on 12.5% of returns)
This zip code:
$1,206
Florida:
$3,587
(% of AGI for various income ranges: 0.6% for AGIs below $25k, 0.5% for AGIs $25k-50k, 0.6% for AGIs $50k-75k, 0.3% for AGIs $75k-100k, 0.3% for AGIs $100k-200k, 0.7% for AGIs over 200k)
Ordinary dividends: $3,384 (reported on 7.0% of returns)
Here:
$3,384
State:
$12,831
(% of AGI for various income ranges: 0.7% for AGIs below $25k, 0.5% for AGIs $25k-50k, 1.0% for AGIs $50k-75k, 0.5% for AGIs $75k-100k, 1.7% for AGIs $100k-200k, 2.1% for AGIs over 200k)
Net capital gain/loss in AGI: +$3,905 (reported on 4.6% of returns)
Here:
+$3,905
State:
+$33,493
(% of AGI for various income ranges: 0.1% for AGIs $25k-50k, 0.2% for AGIs $50k-75k, 0.6% for AGIs $75k-100k, 1.5% for AGIs $100k-200k, 10.4% for AGIs over 200k)
Profit/loss from business: +$5,045 (reported on 23.5% of returns)
Here:
+$5,045
State:
+$10,012
(% of AGI for various income ranges: 11.6% for AGIs below $25k, 1.8% for AGIs $25k-50k, 0.9% for AGIs $50k-75k, 1.5% for AGIs $75k-100k, 1.3% for AGIs $100k-200k)
Taxable individual retirement arrangement distribution: $9,669 (reported on 4.2% of returns)
33415:
$9,669
Florida:
$21,544
(% of AGI for various income ranges: 1.1% for AGIs below $25k, 1.0% for AGIs $25k-50k, 1.7% for AGIs $50k-75k, 1.7% for AGIs $75k-100k, 3.8% for AGIs $100k-200k)
Total itemized deductions: $17,160 (31% of AGI, reported on 15.1% of returns)
Here:
$17,160
State:
$25,533
Here:
31.2% of AGI
State:
18.0% of AGI
(% of AGI for various income ranges: 5.3% for AGIs below $25k, 10.2% for AGIs $25k-50k, 12.3% for AGIs $50k-75k, 9.6% for AGIs $75k-100k, 9.9% for AGIs $100k-200k, 8.2% for AGIs over 200k)
Charity contributions: $2,768 (reported on 10.5% of returns)
Here:
$2,768
State:
$5,698
(% of AGI for various income ranges: 0.4% for AGIs below $25k, 1.0% for AGIs $25k-50k, 1.4% for AGIs $50k-75k, 1.5% for AGIs $75k-100k, 1.7% for AGIs $100k-200k, 1.3% for AGIs over 200k)
Taxes paid: $2,567 (reported on 14.0% of returns)
33415:
$2,567
State:
$6,203
(% of AGI for various income ranges: 0.9% for AGIs below $25k, 1.2% for AGIs $25k-50k, 1.4% for AGIs $50k-75k, 1.5% for AGIs $75k-100k, 1.9% for AGIs $100k-200k, 1.3% for AGIs over 200k)
Earned income credit: $2,543 (reported on 37.7% of returns)
Here:
$2,543
State:
$2,372
(% of AGI for various income ranges: 10.5% for AGIs below $25k, 1.5% for AGIs $25k-50k)
Percentage of individuals using paid preparers for their 2012 taxes: 62.5%
Here:
63%
State:
54%
(% for various income ranges: 64.9% for AGIs below $25k, 59.4% for AGIs $25k-50k, 60.2% for AGIs $50k-75k, 53.0% for AGIs $75k-100k, 58.1% for AGIs $100k-200k, 80.0% for AGIs over 200k)
Averages for the 2004 tax year for zip code 33415, filed in 2005:
Average Adjusted Gross Income (AGI) in 2004: $28,452 (Individual Income Tax Returns)
Here:
$28,452
State:
$50,523
Salary/wage: $28,233 (reported on 84.5% of returns)
Here:
$28,233
State:
$39,563
(% of AGI for various income ranges: 81.3% for AGIs below $10k, 81.0% for AGIs $10k-25k, 89.4% for AGIs $25k-50k, 85.6% for AGIs $50k-75k, 84.7% for AGIs $75k-100k, 63.6% for AGIs over 100k)
Taxable interest for individuals: $1,328 (reported on 25.7% of returns)
This zip code:
$1,328
Florida:
$3,211
(% of AGI for various income ranges: 3.5% for AGIs below $10k, 1.5% for AGIs $10k-25k, 0.8% for AGIs $25k-50k, 1.0% for AGIs $50k-75k, 1.2% for AGIs $75k-100k, 1.6% for AGIs over 100k)
Taxable dividends: $1,785 (reported on 11.4% of returns)
Here:
$1,785
State:
$6,129
(% of AGI for various income ranges: 2.2% for AGIs below $10k, 0.8% for AGIs $10k-25k, 0.4% for AGIs $25k-50k, 0.6% for AGIs $50k-75k, 0.7% for AGIs $75k-100k, 1.3% for AGIs over 100k)
Net capital gain/loss: +$4,490 (reported on 8.7% of returns)
Here:
+$4,490
State:
+$27,205
(% of AGI for various income ranges: -1.6% for AGIs below $10k, -0.2% for AGIs $10k-25k, 0.2% for AGIs $25k-50k, 1.3% for AGIs $50k-75k, 1.9% for AGIs $75k-100k, 10.6% for AGIs over 100k)
Profit/loss from business: +$6,861 (reported on 15.9% of returns)
Here:
+$6,861
State:
+$10,634
(% of AGI for various income ranges: 22.1% for AGIs below $10k, 8.2% for AGIs $10k-25k, 1.8% for AGIs $25k-50k, 1.5% for AGIs $50k-75k, 1.3% for AGIs $75k-100k, 3.3% for AGIs over 100k)
IRA payment deduction: $2,490 (reported on 1.6% of returns)
33415:
$2,490
Florida:
$3,082
(% of AGI for various income ranges: 0.2% for AGIs below $10k, 0.1% for AGIs $10k-25k, 0.1% for AGIs $25k-50k, 0.2% for AGIs $50k-75k, 0.1% for AGIs $75k-100k, 0.2% for AGIs over 100k)
Self-employed pension: $7,909 (reported on 0.1% of returns)
Here:
$7,909
Florida:
$15,857
Total itemized deductions: $14,232 (32% of AGI, reported on 24.7% of returns)
Here:
$14,232
State:
$20,370
Here:
32.0% of AGI
State:
20.7% of AGI
(% of AGI for various income ranges: 9.4% for AGIs below $10k, 9.7% for AGIs $10k-25k, 14.1% for AGIs $25k-50k, 13.9% for AGIs $50k-75k, 11.7% for AGIs $75k-100k, 9.4% for AGIs over 100k)
Charity contributions deductions: $2,163 (5% of AGI, reported on 20.4% of returns)
Here:
$2,163
State:
$4,064
Here:
4.7% of AGI
State:
3.8% of AGI
(% of AGI for various income ranges: 0.4% for AGIs below $10k, 1.0% for AGIs $10k-25k, 1.7% for AGIs $25k-50k, 1.8% for AGIs $50k-75k, 1.9% for AGIs $75k-100k, 1.9% for AGIs over 100k)
Total tax: $3,138 (reported on 68.2% of returns)
33415:
$3,138
State:
$9,431
(% of AGI for various income ranges: 4.2% for AGIs below $10k, 3.8% for AGIs $10k-25k, 6.1% for AGIs $25k-50k, 8.7% for AGIs $50k-75k, 11.0% for AGIs $75k-100k, 17.1% for AGIs over 100k)
Earned income credit: $1,894 (reported on 27.8% of returns)
Here:
$1,894
State:
$1,808
Percentage of individuals using paid preparers for their 2004 taxes: 60.6%
Here:
61%
State:
60%
(% for various income ranges: 57.9% for AGIs below $10k, 64.1% for AGIs $10k-25k, 59.1% for AGIs $25k-50k, 58.7% for AGIs $50k-75k, 58.0% for AGIs $75k-100k, 65.9% for AGIs over 100k)
Likely homosexual households (counted as self-reported same-sex unmarried-partner households)
Lesbian couples: 0.2% of all households
Gay men: 0.1% of all households
Household received Food Stamps/SNAP in the past 12 months: 4,099 Household did not receive Food Stamps/SNAP in the past 12 months: 15,155
Women who had a birth in the past 12 months: 546 (488 now married, 75 unmarried) Women who did not have a birth in the past 12 months: 11,615 (4,099 now married, 7,513 unmarried)
Housing units in zip code 33415 with a mortgage: 5,966 (284 second mortgage, 183 both second mortgage and home equity loan) Houses without a mortgage: 40
Median monthly owner costs for units with a mortgage: $1,448 Median monthly owner costs for units without a mortgage: $503
Residents with income below the poverty level in 2022:
This zip code:
15.3%
Whole state:
12.7%
Residents with income below 50% of the poverty level in 2022:
This zip code:
8.5%
Whole state:
6.6%
Median number of rooms in houses and condos:
Here:
4.9
State:
5.9
Median number of rooms in apartments:
Here:
4.3
State:
4.2
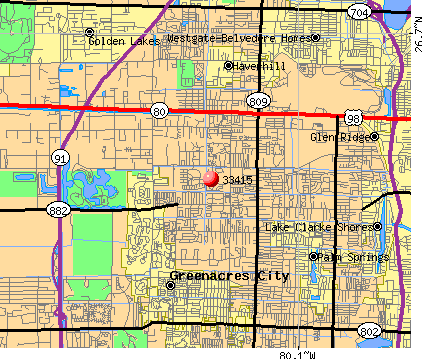
Notable locations in this zip code not listed on our city pages
Notable locations in zip code 33415: Luria Plaza (A), Southern Plaza (B), Fire Station Number 36 (C), Palm Beach County Fire Rescue Station 36 (D), Palm Beach County Sheriff's Office (E). Display/hide their locations on the map
Shopping Centers: Gulfstream Mall (1), Polo Grounds Mall (2), Palm Beach Market Place Shopping Center (3), Polo Market Place Shopping Center (4). Display/hide their locations on the map
Tourist attraction (not listed on the city page) : Apollo Game Room (Amusement & Theme Parks; 1995 South Military Trail).
4,826 married couples with children.
5,547 single-parent households (2,405 men, 3,142 women).
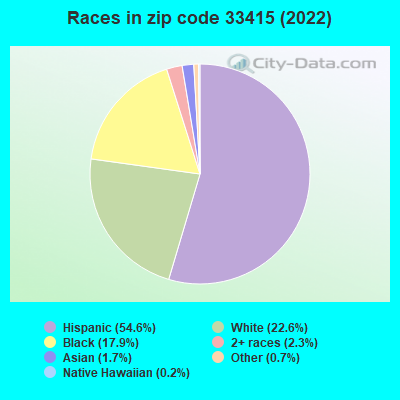
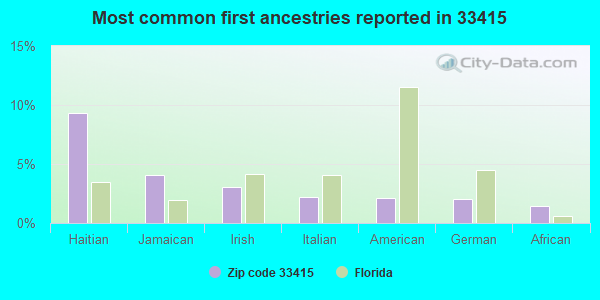
40.9% of residents of 33415 zip code speak English at home.
50.6% of residents speak Spanish at home (47% very well, 21% well, 23% not well, 10% not at all).
7.6% of residents speak other Indo-European language at home (53% very well, 22% well, 16% not well, 9% not at all).
0.8% of residents speak Asian or Pacific Island language at home (62% very well, 26% well, 9% not well, 4% not at all).
0.3% of residents speak other language at home (93% very well, 7% well).
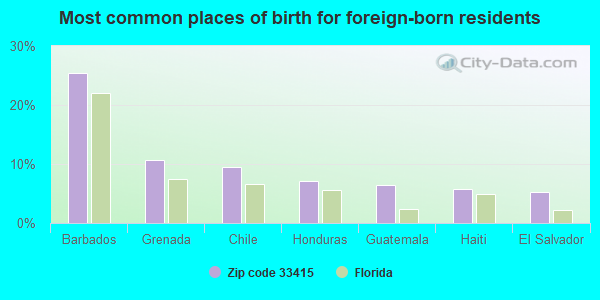
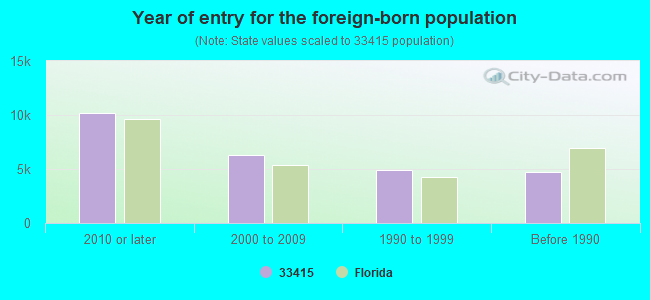
Foreign born population: 23,732 (44.5%) (47.1% of them are naturalized citizens)
Major facilities with environmental interests located in this zip code:
MELALEUCA ELEMENTARY SCHOOL (5759 W GUN CLUB RD in WEST PALM BEACH, FL)
(Geographic Names Information System) (National Center for Education Statistics) - STATE ID-1441 Small Quantity Generators, between 100 kg and 1000 kg of hazardous waste/month (Resource Conservation and Recovery Act (tracking hazardous waste)) - notification Organizations: SNYDER MICHAEL ENV (CONTACT/OWNER)
, PALM BEACH COUNTY SCHOOL DISTRICT (SCHOOL DISTRICT)
Alternative names: PALM BEACH CO MELALEUCA ELEM
NORTH AMERICAN TRANSMISSIONS (2450 S MILITARY TR BAY 7 in WEST PALM BEACH, FL)
STATE MASTER (FDM) - CHAZ-FLD981749278, HAZARDOUS WASTE REGULATION PROGRAM Small Quantity Generators, between 100 kg and 1000 kg of hazardous waste/month (Resource Conservation and Recovery Act (tracking hazardous waste)) - notification Business SIC classification: AUTOMOTIVE TRANSMISSION REPAIR SHOPS Organizations: STAN COOPER (CONTACT/OWNER)
Alternative names: AUTOMATIC TRANSMISSION OUTLET
5 STAR DRY CLEANERS (4558 CRESTHAVEN BOULEVARD in WEST PALM BEACH, FL)
AIR MINOR (AIRS/AFS) Small Quantity Generators, between 100 kg and 1000 kg of hazardous waste/month (Resource Conservation and Recovery Act (tracking hazardous waste)) - notification Business SIC classification: DRYCLEANING PLANTS, EXCEPT RUG CLEANING Organizations: JERRY BILIGNIO (CONTACT/OWNER)
Alternative names: 5 STAR CLEANER
PACE CENTER FOR GIRLS (1225D S. MILITARY TRAIL in WEST PALM BEACH, FL)
(National Center for Education Statistics) - STATE ID-3010 Organizations: PALM BEACH COUNTY SCHOOL DISTRICT (SCHOOL DISTRICT)
ADVANCED TRUCK EQUIPMENT, INC. (5141 SUMMIT BLVD in WEST PALM BEACH, FL)
AIR SYNTHETIC MINOR (AIRS/AFS) CRITERIA AND HAZARDOUS AIR POLLUTANT INVENTORY (Inventory of air pollution sources) (Resource Conservation and Recovery Act (tracking hazardous waste)) Business SIC classification: TRUCK AND BUS BODIES Organizations: RATHBUN TOM MANAGER (CONTACT/OWNER)
Alternative names: ADVANCED FABRICATORS
PINEWOOD LAKE (SW CORNER OF RANCHETTE RD AND in LAKE WORTH, FL)
National Pollutant Discharge Elimination System NON-MAJOR (Tracking pollutant discharge elimination systems) - permit Organizations: STEVE KEMPTON (CONTACT/OWNER)
CUMBERLAND FARMS #0919 (4556 CRESTHAVEN BLVD MILITA TR in WEST PALM BEACH, FL)
National Pollutant Discharge Elimination System NON-MAJOR (Tracking pollutant discharge elimination systems) - permit Small Quantity Generators, between 100 kg and 1000 kg of hazardous waste/month (Resource Conservation and Recovery Act (tracking hazardous waste)) - notification Organizations: JOYCE SCHULTZ, DEALER (CONTACT/OWNER)
PURDY LANE (FOREST HILL ELEMENTARY SCHOOL in UNINCORPORATED PALM BEA, FL)
National Pollutant Discharge Elimination System NON-MAJOR (Tracking pollutant discharge elimination systems) - permit Organizations: OMELIO FERNANDEZ (CONTACT/OWNER)
RAYSIDE TRUCK & TRAILER (2983 S MILITARY TR in WEST PALM BEACH, FL)
(Resource Conservation and Recovery Act (tracking hazardous waste)) Organizations: CHARLES RAYSIDE (CONTACT/OWNER)
GILBERTS COMET CLEANERS (900 SOUTH MILITARY TRAIL in WEST PALM BEACH, FL)
AUTO LIQUIDATION CENTER INC (225 N MILITARY TR in WEST PALM BEACH, FL)
(Resource Conservation and Recovery Act (tracking hazardous waste)) Organizations: NON NOTIFIER (CONTACT/OWNER)
GENERAL GMC TRUCK SALES INC (360 SOUTH MILITARY TRAIL in WEST PALM BEACH, FL)
(Resource Conservation and Recovery Act (tracking hazardous waste)) Business NAICS classification: ALL OTHER AUTOMOTIVE REPAIR AND MAINTENANCE. Organizations: MADELINE DESANTI (CONTACT/OWNER)
Housing units lacking complete plumbing facilities: 1.1% Housing units lacking complete kitchen facilities: 2.0%
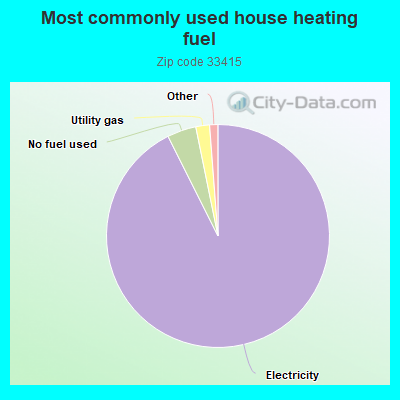
92.7%Electricity
4.2%No fuel used
2.0%Utility gas
Population in 1990: 35,663. Population change in the 1990s: +3,921 (+11.0%).
Place of birth for U.S.-born residents:
This state: 16,407
Northeast: 6,395
Midwest: 2,041
South: 2,208
West: 603
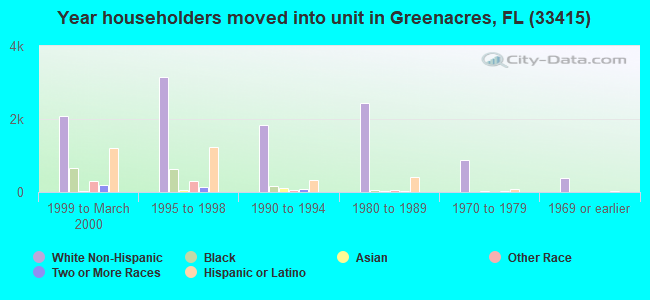
46% of the 33415 zip code residents lived in the same house 5 years ago. Out of people who lived in different houses, 72% lived in this county. Out of people who lived in different counties, 50% lived in Florida.
86% of the 33415 zip code residents lived in the same house 1 year ago. Out of people who lived in different houses, 54% moved from this county. Out of people who lived in different houses, 12% moved from different county within same state. Out of people who lived in different houses, 8% moved from different state. Out of people who lived in different houses, 27% moved from abroad.
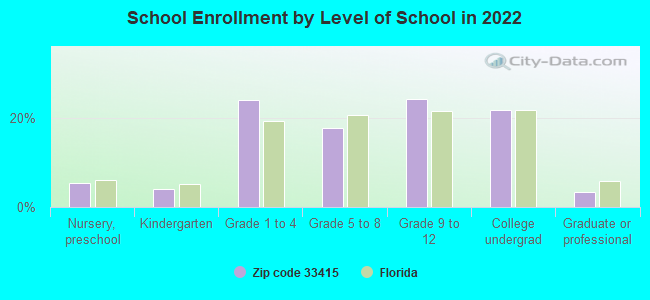
Private vs. public school enrollment:
Students in private schools in grades 1 to 8 (elementary and middle school): 535
Here:
10.0%
Florida:
15.8%
Students in private schools in grades 9 to 12 (high school): 189
Here:
6.1%
Florida:
12.9%
Students in private undergraduate colleges: 731
Here:
25.9%
Florida:
23.6%
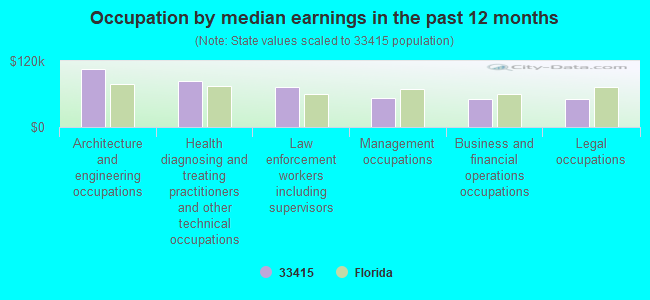
Occupation by median earnings in the past 12 months ($)
104,610Architecture and engineering occupations
83,638Health diagnosing and treating practitioners and other technical occupations
72,272Law enforcement workers including supervisors
52,543Management occupations
51,313Business and financial operations occupations
51,143Legal occupations
Companies with federal contracts located in this zip code:
BRITTON SERVICES (4771 ORLEANS CT SUITE B in WEST PALM BEAC, FL; small business) : $8,460 in 4 contractsin 2000
$4,620 with Army for Custodial Janitorial Services. Signed on 2000-10-27. Completion date: 2001-09-30.
$3,840, same as above.Signed on 2000-10-31. Completion date: 2001-09-30.
$0, same as above.Signed on 2000-10-27. Completion date: 2001-09-30.
$0, same as above.Signed on 2000-10-31. Completion date: 2001-09-30.
Top industries in this zip code by the number of employees in 2005:
Health Care and Social Assistance: Nursing Care Facilities (100-249 employees: 3 establishments)
2002 - 2018 National Fire Incident Reporting System (NFIRS) incidents
According to the data from the years 2002 - 2018 the average number of fires per year is 73. The highest number of reported fire incidents - 146 took place in 2007, and the least - 8 in 2002. The data has a rising trend.
When looking into fire subcategories, the most reports belonged to: Outside Fires (44.2%), and Structure Fires (27.7%).
Fire incident types reported to NFIRS in Zip Code 33415


 Nearest zip codes: 33413, 33406, 33461, 33417, 33409, 33463.


 According to the data from the years 2002 - 2018 the average number of fires per year is 73. The highest number of reported fire incidents - 146 took place in 2007, and the least - 8 in 2002. The data has a rising trend.
 When looking into fire subcategories, the most reports belonged to: Outside Fires (44.2%), and Structure Fires (27.7%).