Estimated zip code population in 2022: 67,621 Zip code population in 2010: 53,766 Zip code population in 2000: 41,043
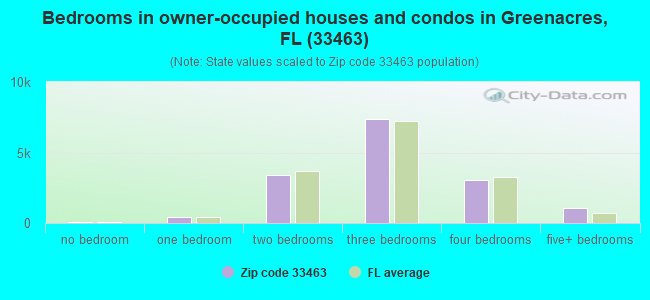
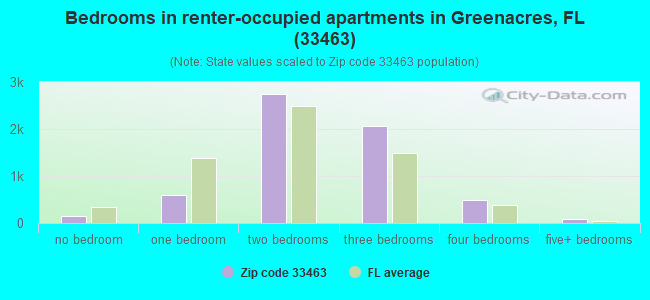
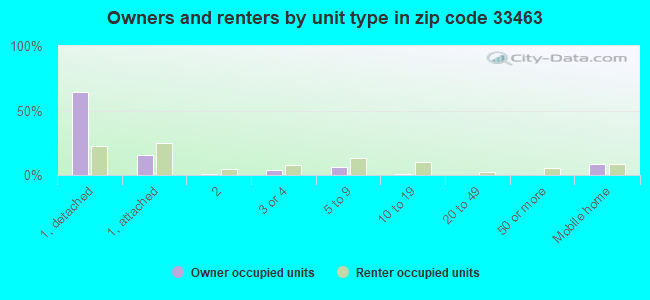
Houses and condos: 23,460 Renter-occupied apartments: 6,190
% of renters here:
29%
State:
33%
March 2022 cost of living index in zip code 33463: 100.4 (near average, U.S. average is 100)
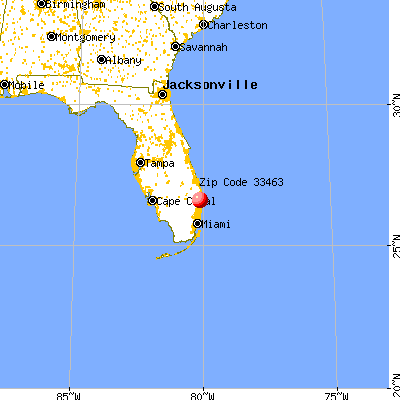
Land area: 10.8 sq. mi. Water area: 0.0 sq. mi.
Population density: 6,273 people per square mile
(high).
OSM Map
General Map
Google Map
MSN Map
OSM Map
General Map
Google Map
MSN Map
OSM Map
General Map
Google Map
MSN Map
OSM Map
General Map
Google Map
MSN Map
Please wait while loading the map...
Real estate property taxes paid for housing units in 2022:
This zip code:
0.8% ($2,604)
Florida:
0.7% ($2,529)
Median real estate property taxes paid for housing units with mortgages in 2022: $2,936 (0.8%) Median real estate property taxes paid for housing units with no mortgage in 2022: $1,659 (0.7%)
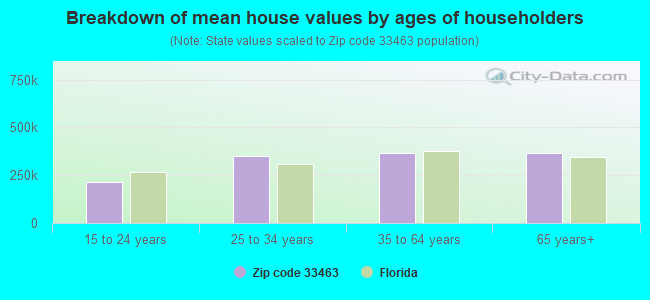
Estimated median house/condo value in 2022: $345,011
33463:
$345,011
Florida:
$354,100
According to our research of Florida and other state lists, there were 38 registered sex offenders living in 33463 zip code as of April 27, 2024. The ratio of all residents to sex offenders in zip code 33463 is 1,583 to 1. The ratio of registered sex offenders to all residents in this zip code is much lower than the state average.
Median resident age:
This zip code:
37.0 years
Florida median age:
42.7 years
Average household size:
This zip code:
3.1 people
Florida:
2.5 people
Averages for the 2020 tax year for zip code 33463, filed in 2021:
Average Adjusted Gross Income (AGI) in 2020: $46,108 (Individual Income Tax Returns)
Here:
$46,108
State:
$82,200
Salary/wage: $45,008 (reported on 82.2% of returns)
Here:
$45,008
State:
$58,347
(% of AGI for various income ranges: 1343.6% for AGIs below $25k, 3852.2% for AGIs $25k-50k, 7025.9% for AGIs $50k-75k, 9918.3% for AGIs $75k-100k, 18293.8% for AGIs $100k-200k, 56735.7% for AGIs over 200k)
Taxable interest for individuals: $1,115 (reported on 13.6% of returns)
This zip code:
$1,115
Florida:
$4,272
(% of AGI for various income ranges: 8.5% for AGIs below $25k, 10.0% for AGIs $25k-50k, 22.4% for AGIs $50k-75k, 42.2% for AGIs $75k-100k, 71.4% for AGIs $100k-200k, 377.0% for AGIs over 200k)
Ordinary dividends: $3,297 (reported on 10.5% of returns)
Here:
$3,297
State:
$15,863
(% of AGI for various income ranges: 11.8% for AGIs below $25k, 19.3% for AGIs $25k-50k, 57.3% for AGIs $50k-75k, 92.6% for AGIs $75k-100k, 174.1% for AGIs $100k-200k, 1167.4% for AGIs over 200k)
Net capital gain/loss in AGI: +$9,044 (reported on 10.2% of returns)
Here:
+$9,044
State:
+$62,983
(% of AGI for various income ranges: 6.9% for AGIs below $25k, 13.9% for AGIs $25k-50k, 66.9% for AGIs $50k-75k, 131.3% for AGIs $75k-100k, 499.0% for AGIs $100k-200k, 6952.6% for AGIs over 200k)
Profit/loss from business: +$4,474 (reported on 30.9% of returns)
Here:
+$4,474
State:
+$9,719
(% of AGI for various income ranges: 219.3% for AGIs below $25k, 80.6% for AGIs $25k-50k, 130.6% for AGIs $50k-75k, 179.8% for AGIs $75k-100k, 340.6% for AGIs $100k-200k, 1855.7% for AGIs over 200k)
Taxable individual retirement arrangement distribution: $16,341 (reported on 4.0% of returns)
33463:
$16,341
Florida:
$24,823
(% of AGI for various income ranges: 19.1% for AGIs below $25k, 32.2% for AGIs $25k-50k, 111.9% for AGIs $50k-75k, 224.2% for AGIs $75k-100k, 441.5% for AGIs $100k-200k, 1456.5% for AGIs over 200k)
Self-employed (Keogh) retirement plans: $17,550 (reported on 0.1% of returns)
33463:
$17,550
Florida:
$29,694
(% of AGI for various income ranges: 44.7% for AGIs $100k-200k)
Total itemized deductions: $28,613 (reported on 6.0% of returns)
Here:
$28,613
State:
$45,393
(% of AGI for various income ranges: 29.6% for AGIs below $25k, 149.5% for AGIs $25k-50k, 353.7% for AGIs $50k-75k, 602.2% for AGIs $75k-100k, 970.6% for AGIs $100k-200k, 2810.0% for AGIs over 200k)
Charity contributions: $6,975 (reported on 4.4% of returns)
Here:
$6,975
State:
$20,178
(% of AGI for various income ranges: 2.4% for AGIs below $25k, 15.9% for AGIs $25k-50k, 55.2% for AGIs $50k-75k, 114.6% for AGIs $75k-100k, 215.2% for AGIs $100k-200k, 779.6% for AGIs over 200k)
Taxes paid: $6,328 (reported on 5.7% of returns)
33463:
$6,328
State:
$6,967
(% of AGI for various income ranges: 5.9% for AGIs below $25k, 30.4% for AGIs $25k-50k, 75.2% for AGIs $50k-75k, 128.1% for AGIs $75k-100k, 209.9% for AGIs $100k-200k, 613.9% for AGIs over 200k)
Earned income credit: $2,599 (reported on 27.8% of returns)
Here:
$2,599
State:
$2,306
(% of AGI for various income ranges: 157.5% for AGIs below $25k, 97.3% for AGIs $25k-50k, 1.5% for AGIs $50k-75k)
Percentage of individuals using paid preparers for their 2020 taxes: 90.9%
Here:
91%
State:
92%
(% for various income ranges: 88.3% for AGIs below $25k, 92.4% for AGIs $25k-50k, 94.1% for AGIs $50k-75k, 92.6% for AGIs $75k-100k, 92.9% for AGIs $100k-200k, 93.5% for AGIs over 200k)
Averages for the 2012 tax year for zip code 33463, filed in 2013:
Average Adjusted Gross Income (AGI) in 2012: $37,213 (Individual Income Tax Returns)
Here:
$37,213
State:
$60,316
Salary/wage: $35,958 (reported on 84.8% of returns)
Here:
$35,958
State:
$45,277
(% of AGI for various income ranges: 79.9% for AGIs below $25k, 88.3% for AGIs $25k-50k, 83.9% for AGIs $50k-75k, 82.2% for AGIs $75k-100k, 83.2% for AGIs $100k-200k, 60.7% for AGIs over 200k)
Taxable interest for individuals: $1,476 (reported on 17.2% of returns)
This zip code:
$1,476
Florida:
$3,587
(% of AGI for various income ranges: 0.8% for AGIs below $25k, 0.6% for AGIs $25k-50k, 0.6% for AGIs $50k-75k, 0.8% for AGIs $75k-100k, 0.5% for AGIs $100k-200k, 1.1% for AGIs over 200k)
Ordinary dividends: $3,759 (reported on 10.7% of returns)
Here:
$3,759
State:
$12,831
(% of AGI for various income ranges: 1.0% for AGIs below $25k, 0.7% for AGIs $25k-50k, 1.0% for AGIs $50k-75k, 1.4% for AGIs $75k-100k, 1.0% for AGIs $100k-200k, 2.5% for AGIs over 200k)
Net capital gain/loss in AGI: +$2,766 (reported on 8.1% of returns)
Here:
+$2,766
State:
+$33,493
(% of AGI for various income ranges: 0.1% for AGIs $50k-75k, 0.2% for AGIs $75k-100k, 0.7% for AGIs $100k-200k, 5.4% for AGIs over 200k)
Profit/loss from business: +$5,093 (reported on 22.0% of returns)
Here:
+$5,093
State:
+$10,012
(% of AGI for various income ranges: 10.6% for AGIs below $25k, 1.5% for AGIs $25k-50k, 1.1% for AGIs $50k-75k, 1.4% for AGIs $75k-100k, 0.9% for AGIs $100k-200k, 1.7% for AGIs over 200k)
Taxable individual retirement arrangement distribution: $11,569 (reported on 5.4% of returns)
33463:
$11,569
Florida:
$21,544
(% of AGI for various income ranges: 1.4% for AGIs below $25k, 1.2% for AGIs $25k-50k, 1.7% for AGIs $50k-75k, 1.9% for AGIs $75k-100k, 2.1% for AGIs $100k-200k, 2.1% for AGIs over 200k)
Self-employment retirement plans: $12,150 (reported on 0.1% of returns)
33463:
$12,150
Florida:
$20,611
Total itemized deductions: $18,796 (25% of AGI, reported on 21.7% of returns)
Here:
$18,796
State:
$25,533
Here:
25.4% of AGI
State:
18.0% of AGI
(% of AGI for various income ranges: 6.6% for AGIs below $25k, 11.6% for AGIs $25k-50k, 13.1% for AGIs $50k-75k, 12.5% for AGIs $75k-100k, 12.7% for AGIs $100k-200k, 7.9% for AGIs over 200k)
Charity contributions: $2,733 (reported on 16.7% of returns)
Here:
$2,733
State:
$5,698
(% of AGI for various income ranges: 0.4% for AGIs below $25k, 1.1% for AGIs $25k-50k, 1.6% for AGIs $50k-75k, 1.4% for AGIs $75k-100k, 1.7% for AGIs $100k-200k, 1.2% for AGIs over 200k)
Taxes paid: $3,541 (reported on 20.7% of returns)
33463:
$3,541
State:
$6,203
(% of AGI for various income ranges: 1.0% for AGIs below $25k, 1.6% for AGIs $25k-50k, 2.2% for AGIs $50k-75k, 2.4% for AGIs $75k-100k, 2.7% for AGIs $100k-200k, 2.2% for AGIs over 200k)
Earned income credit: $2,653 (reported on 33.0% of returns)
Here:
$2,653
State:
$2,372
(% of AGI for various income ranges: 10.5% for AGIs below $25k, 1.7% for AGIs $25k-50k)
Percentage of individuals using paid preparers for their 2012 taxes: 63.3%
Here:
63%
State:
54%
(% for various income ranges: 64.5% for AGIs below $25k, 62.5% for AGIs $25k-50k, 61.5% for AGIs $50k-75k, 62.7% for AGIs $75k-100k, 58.5% for AGIs $100k-200k, 73.9% for AGIs over 200k)
Averages for the 2004 tax year for zip code 33463, filed in 2005:
Average Adjusted Gross Income (AGI) in 2004: $36,863 (Individual Income Tax Returns)
Here:
$36,863
State:
$50,523
Salary/wage: $35,754 (reported on 85.8% of returns)
Here:
$35,754
State:
$39,563
(% of AGI for various income ranges: 99.0% for AGIs below $10k, 81.9% for AGIs $10k-25k, 87.3% for AGIs $25k-50k, 85.4% for AGIs $50k-75k, 86.3% for AGIs $75k-100k, 74.4% for AGIs over 100k)
Taxable interest for individuals: $1,493 (reported on 31.7% of returns)
This zip code:
$1,493
Florida:
$3,211
(% of AGI for various income ranges: 4.4% for AGIs below $10k, 1.9% for AGIs $10k-25k, 1.2% for AGIs $25k-50k, 1.0% for AGIs $50k-75k, 1.1% for AGIs $75k-100k, 1.0% for AGIs over 100k)
Taxable dividends: $2,109 (reported on 15.8% of returns)
Here:
$2,109
State:
$6,129
(% of AGI for various income ranges: 3.9% for AGIs below $10k, 1.0% for AGIs $10k-25k, 0.7% for AGIs $25k-50k, 0.8% for AGIs $50k-75k, 0.8% for AGIs $75k-100k, 0.9% for AGIs over 100k)
Net capital gain/loss: +$7,075 (reported on 13.8% of returns)
Here:
+$7,075
State:
+$27,205
(% of AGI for various income ranges: -1.1% for AGIs below $10k, 0.2% for AGIs $10k-25k, 0.3% for AGIs $25k-50k, 0.9% for AGIs $50k-75k, 1.7% for AGIs $75k-100k, 9.0% for AGIs over 100k)
Profit/loss from business: +$6,844 (reported on 16.5% of returns)
Here:
+$6,844
State:
+$10,634
(% of AGI for various income ranges: 20.6% for AGIs below $10k, 7.2% for AGIs $10k-25k, 2.4% for AGIs $25k-50k, 1.7% for AGIs $50k-75k, 1.3% for AGIs $75k-100k, 2.0% for AGIs over 100k)
IRA payment deduction: $2,905 (reported on 2.2% of returns)
33463:
$2,905
Florida:
$3,082
(% of AGI for various income ranges: 0.2% for AGIs below $10k, 0.1% for AGIs $10k-25k, 0.2% for AGIs $25k-50k, 0.2% for AGIs $50k-75k, 0.2% for AGIs $75k-100k, 0.2% for AGIs over 100k)
Self-employed pension: $10,103 (reported on 0.2% of returns)
Here:
$10,103
Florida:
$15,857
Total itemized deductions: $17,397 (29% of AGI, reported on 35.3% of returns)
Here:
$17,397
State:
$20,370
Here:
29.0% of AGI
State:
20.7% of AGI
(% of AGI for various income ranges: 13.6% for AGIs below $10k, 14.7% for AGIs $10k-25k, 19.5% for AGIs $25k-50k, 18.1% for AGIs $50k-75k, 17.7% for AGIs $75k-100k, 13.3% for AGIs over 100k)
Charity contributions deductions: $2,404 (4% of AGI, reported on 29.7% of returns)
Here:
$2,404
State:
$4,064
Here:
3.8% of AGI
State:
3.8% of AGI
(% of AGI for various income ranges: 0.7% for AGIs below $10k, 1.4% for AGIs $10k-25k, 2.1% for AGIs $25k-50k, 2.0% for AGIs $50k-75k, 2.0% for AGIs $75k-100k, 2.2% for AGIs over 100k)
Total tax: $4,800 (reported on 68.7% of returns)
33463:
$4,800
State:
$9,431
(% of AGI for various income ranges: 4.8% for AGIs below $10k, 3.5% for AGIs $10k-25k, 5.7% for AGIs $25k-50k, 8.1% for AGIs $50k-75k, 9.8% for AGIs $75k-100k, 16.1% for AGIs over 100k)
Earned income credit: $1,890 (reported on 23.6% of returns)
Here:
$1,890
State:
$1,808
Percentage of individuals using paid preparers for their 2004 taxes: 61.0%
Here:
61%
State:
60%
(% for various income ranges: 56.7% for AGIs below $10k, 64.4% for AGIs $10k-25k, 60.9% for AGIs $25k-50k, 59.8% for AGIs $50k-75k, 58.5% for AGIs $75k-100k, 63.2% for AGIs over 100k)
Likely homosexual households (counted as self-reported same-sex unmarried-partner households)
Lesbian couples: 0.0% of all households
Gay men: 0.0% of all households
Household received Food Stamps/SNAP in the past 12 months: 3,614 Household did not receive Food Stamps/SNAP in the past 12 months: 17,940
Women who had a birth in the past 12 months: 935 (512 now married, 409 unmarried) Women who did not have a birth in the past 12 months: 15,303 (6,417 now married, 8,887 unmarried)
Housing units in zip code 33463 with a mortgage: 10,003 (698 second mortgage, 4 home equity loan, 511 both second mortgage and home equity loan) Houses without a mortgage: 260
Median monthly owner costs for units with a mortgage: $1,777 Median monthly owner costs for units without a mortgage: $651
Residents with income below the poverty level in 2022:
This zip code:
13.1%
Whole state:
12.7%
Residents with income below 50% of the poverty level in 2022:
This zip code:
6.7%
Whole state:
6.6%
Median number of rooms in houses and condos:
Here:
5.8
State:
5.9
Median number of rooms in apartments:
Here:
5.1
State:
4.2
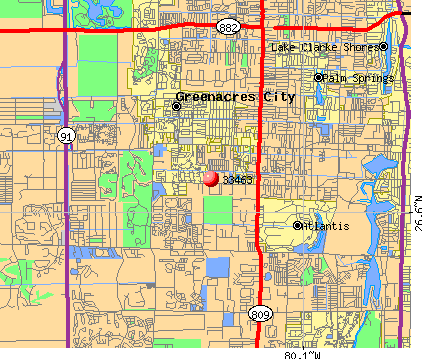
Notable locations in this zip code not listed on our city pages
Notable locations in zip code 33463: Keys Gate Golf and Country Club (A), John Prince Golf Center (B), Aloha Plaza (C), Fire Station Number 43 (D), Greenacres Department of Public Safety Station 2 (E), Palm Beach County Fire Rescue Station 46 (F), Medicas Ambulance Service (G), Palm Beach County Library System Greenacres Branch Library (H). Display/hide their locations on the map
In group quarters: 232 (-1 institutionalized population)
Size of family households: 5,788 2-persons, 3,848 3-persons, 3,508 4-persons, 2,063 5-persons, 824 6-persons, 649 7-or-more-persons
Size of nonfamily households: 3,827 1-person, 1,002 2-persons, 100 3-persons
9,328 married couples with children.
4,575 single-parent households (903 men, 3,672 women).
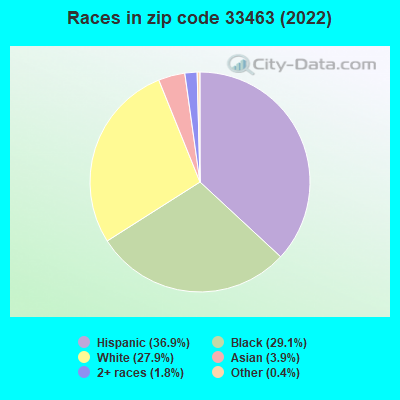
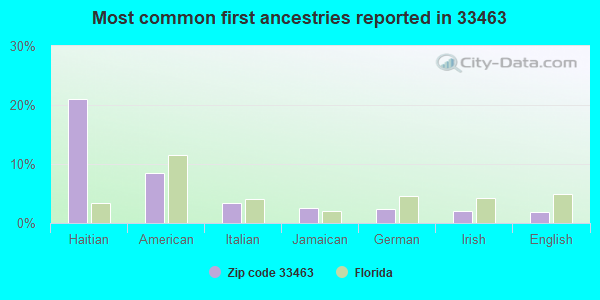
45.1% of residents of 33463 zip code speak English at home.
33.0% of residents speak Spanish at home (49% very well, 17% well, 21% not well, 14% not at all).
20.0% of residents speak other Indo-European language at home (57% very well, 25% well, 15% not well, 3% not at all).
1.7% of residents speak Asian or Pacific Island language at home (38% very well, 36% well, 22% not well, 4% not at all).
0.9% of residents speak other language at home (60% very well, 18% well, 7% not well, 16% not at all).
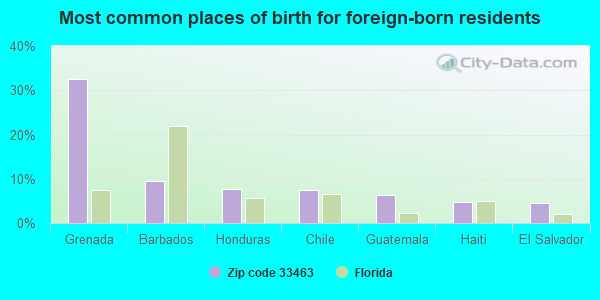
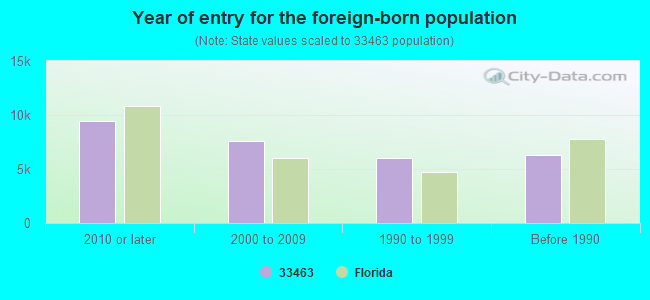
Foreign born population: 27,385 (40.5%) (55.3% of them are naturalized citizens)
Major facilities with environmental interests located in this zip code:
JOHN I LEONARD HIGH SCHOOL (4701 10TH AVENUE NORTH in GREENACRES, FL)
(Geographic Names Information System) (National Center for Education Statistics) - STATE ID-1361 National Pollutant Discharge Elimination System NON-MAJOR (Tracking pollutant discharge elimination systems) - permit Organizations: WARREN HAAN (CONTACT/OWNER)
, PALM BEACH COUNTY SCHOOL DISTRICT (SCHOOL DISTRICT)
GREENACRES ELEMENTARY SCHOOL (405 JACKSON AVE in GREENACRES, FL)
(Geographic Names Information System) (National Center for Education Statistics) - STATE ID-0631 Small Quantity Generators, between 100 kg and 1000 kg of hazardous waste/month (Resource Conservation and Recovery Act (tracking hazardous waste)) - notification Organizations: SNYDER MICHAEL ENV (CONTACT/OWNER)
, PALM BEACH COUNTY SCHOOL DISTRICT (SCHOOL DISTRICT)
Alternative names: PALM BEACH CO GREENACRES ELEM
CUMBERLAND FARMS #0928 (5245 10TH AVE N in GREENACRES, FL)
National Pollutant Discharge Elimination System NON-MAJOR (Tracking pollutant discharge elimination systems) - permit National Pollutant Discharge Elimination System NON-MAJOR (Tracking pollutant discharge elimination systems) - permit Small Quantity Generators, between 100 kg and 1000 kg of hazardous waste/month (Resource Conservation and Recovery Act (tracking hazardous waste)) - notification Business SIC classification: GASOLINE SERVICE STATIONS Organizations: JOYCE SCHULTZ, UST COORD (CONTACT/OWNER)
Alternative names: CUMBERLAND FARMS, INC., CUMBERLAND FARMS STORE #0928
COLONIAL CLEANERS (4641 LAKE WORTH ROAD in LAKE WORTH, FL)
AIR MINOR (AIRS/AFS) Small Quantity Generators, between 100 kg and 1000 kg of hazardous waste/month (Resource Conservation and Recovery Act (tracking hazardous waste)) - notification Business SIC classification: DRYCLEANING PLANTS, EXCEPT RUG CLEANING Organizations: RALPH NUDI (CONTACT/OWNER)
HERITAGE ELEMENTARY SCHOOL (5100 MELALEUCA LANE in GREENACRES, FL)
(National Center for Education Statistics) - STATE ID-2571 Organizations: PALM BEACH COUNTY SCHOOL DISTRICT (SCHOOL DISTRICT)
INDIAN PINES ELEMENTARY SCHOOL (6000 OAK ROYAL DR in LAKE WORTH, FL)
(National Center for Education Statistics) - STATE ID-1861 Organizations: PALM BEACH COUNTY SCHOOL DISTRICT (SCHOOL DISTRICT)
MAGNOLIA BAY (.8 MILE W OF JOG ROAD ON 10TH in G, FL)
National Pollutant Discharge Elimination System NON-MAJOR (Tracking pollutant discharge elimination systems) - permit Organizations: NELSON BENNETT (CONTACT/OWNER)
JOG ROAD (HYPOLUXO ROAD TO MELALEUCA LAN in GREENACRES, FL)
National Pollutant Discharge Elimination System NON-MAJOR (Tracking pollutant discharge elimination systems) - permit Organizations: OMELIO FERNANDEZ (CONTACT/OWNER)
PINE KEY ESTATES (MILITARY TRAIL & LANTANA BLVD in LAKE WORTH, FL)
National Pollutant Discharge Elimination System NON-MAJOR (Tracking pollutant discharge elimination systems) - permit Organizations: DAVID BASELICE (CONTACT/OWNER)
LANTANA ROAD (JOG ROAD TO MILITARY TRAIL in UNICORPORATED PALM BEAC, FL)
National Pollutant Discharge Elimination System NON-MAJOR (Tracking pollutant discharge elimination systems) - permit Organizations: OMELIO FERNANDEZ (CONTACT/OWNER)
CUMBERLAND FARMS STORE #0964 (6701 LAKE WORTH RD in GREENACRES, FL)
National Pollutant Discharge Elimination System NON-MAJOR (Tracking pollutant discharge elimination systems) - permit Small Quantity Generators, between 100 kg and 1000 kg of hazardous waste/month (Resource Conservation and Recovery Act (tracking hazardous waste)) - notification Organizations: JOYCE SCHULTZ, UST COORD (CONTACT/OWNER)
Alternative names: CUMBERLAND FARMS, INC., CUMBERLAND FARMS #0964
SEMINOLE PALMS (SEC 27, TWP 44S, RNG 42E; E OF in GREENACRES, FL)
National Pollutant Discharge Elimination System NON-MAJOR (Tracking pollutant discharge elimination systems) - permit Organizations: ROBERT TRAUTMAN (CONTACT/OWNER)
Housing units lacking complete plumbing facilities: 0.9% Housing units lacking complete kitchen facilities: 0.9%
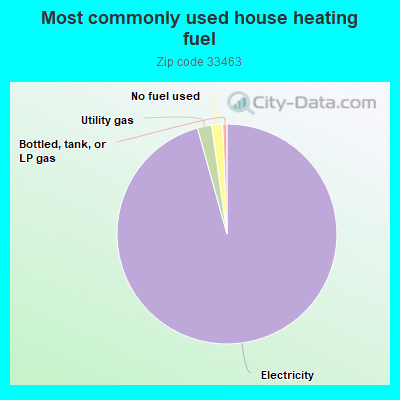
95.1%Electricity
2.1%Utility gas
1.6%No fuel used
0.6%Bottled, tank, or LP gas
Population in 1990: 28,841. Population change in the 1990s: +12,202 (+42.3%).
Place of birth for U.S.-born residents:
This state: 22,948
Northeast: 9,415
Midwest: 2,941
South: 2,268
West: 596
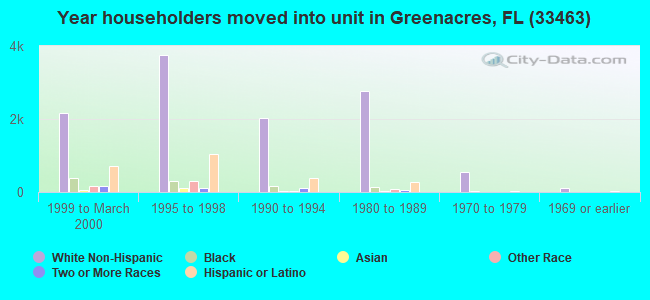
47% of the 33463 zip code residents lived in the same house 5 years ago. Out of people who lived in different houses, 63% lived in this county. Out of people who lived in different counties, 50% lived in Florida.
93% of the 33463 zip code residents lived in the same house 1 year ago. Out of people who lived in different houses, 62% moved from this county. Out of people who lived in different houses, 10% moved from different county within same state. Out of people who lived in different houses, 12% moved from different state. Out of people who lived in different houses, 18% moved from abroad.
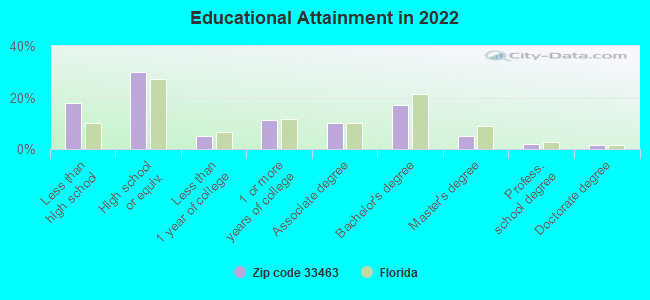
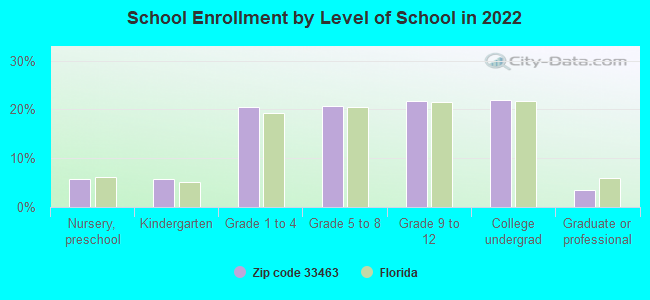
Private vs. public school enrollment:
Students in private schools in grades 1 to 8 (elementary and middle school): 257
Here:
3.6%
Florida:
15.8%
Students in private schools in grades 9 to 12 (high school): 192
Here:
5.1%
Florida:
12.9%
Students in private undergraduate colleges: 986
Here:
25.5%
Florida:
23.6%
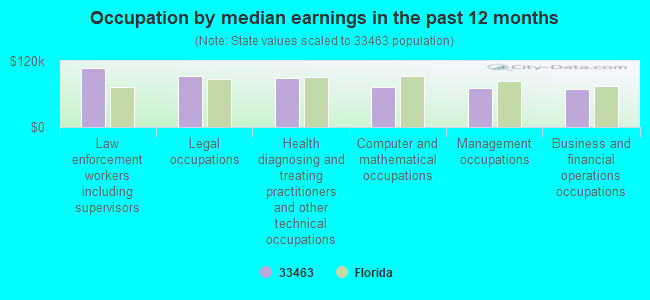
Occupation by median earnings in the past 12 months ($)
106,764Law enforcement workers including supervisors
93,113Legal occupations
89,600Health diagnosing and treating practitioners and other technical occupations
71,870Computer and mathematical occupations
70,991Management occupations
69,814Business and financial operations occupations
Companies with federal contracts located in this zip code:
ARBOR TREE & LAND INC (5796 WESTERN WAY in LAKE WORTH, FL; small business) : $556,241 in 3 contractsfrom 2000 to 2001
$478,000 with U.S. Army Corps of Engineers - civil program financing only for Trash/Garbage Collection Services - Including Portable Sanitation Services. Signed on 2000-07-12. Completion date: 2000-12-29.
$69,166 with U.S. Army Corps of Engineers - civil program financing only for Maintenance, Repair or Alteration of Real Property -- Dams. Signed on 2001-06-13. Completion date: 2001-07-31.
$9,075, same as above.Signed on 2001-07-20. Completion date: 2001-07-31.
john underwood (3044 S. Military Trial in Lake Worth, FL; small business)
$38,391 with Offices, Boards and Divisions (includes Attorney General, Deputy Attorney General, etc.) for Expert Witness. Signed on 2004-08-19. Completion date: 2005-06-04.
MIDWAY INDUSTRIAL ELECTRONICS (5700 LAKEWORTH ROAD in LAKE WORTH, FL; small business)
$35,310 with Defense Logistics Agency for Resistors. Signed on 2002-02-19. Completion date: 2002-04-30.
AERO RESOURCE INC (6346 65 LANTANA RD 20 in LAKE WORTH, FL; small business) : $25,200 in 2 contractsin 2005
$12,600 with Defense Logistics Agency for Circuit Breakers. Signed on 2005-02-24. Completion date: 2005-06-28.
$12,600, same as above.Signed on 2005-02-24. Completion date: 2005-06-28.
MANHATTAN FOODS (7 CRANE WAY in BOYTON BEACH, FL)
$3,115 with Bureau of Prisoners/Federal Prison System for Food Cooking, Baking, and Serving Equipment. Signed on 2005-02-08. Completion date: 2005-02-25.
Top industries in this zip code by the number of employees in 2005:
2002 - 2018 National Fire Incident Reporting System (NFIRS) incidents
According to the data from the years 2002 - 2018 the average number of fire incidents per year is 72. The highest number of fire incidents - 127 took place in 2007, and the least - 41 in 2002. The data has a rising trend.
When looking into fire subcategories, the most reports belonged to: Outside Fires (38.9%), and Structure Fires (35.5%).
Fire incident types reported to NFIRS in Zip Code 33463


 Nearest zip codes: 33467, 33461, 33462, 33415, 33436, 33426.
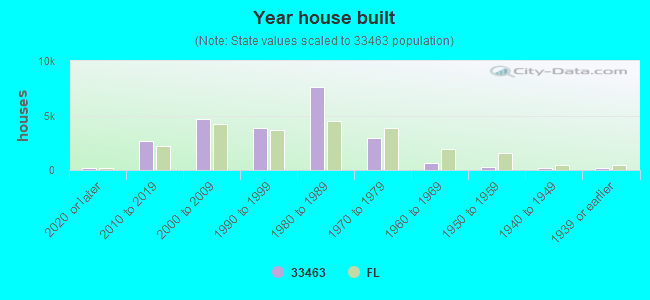


 According to the data from the years 2002 - 2018 the average number of fire incidents per year is 72. The highest number of fire incidents - 127 took place in 2007, and the least - 41 in 2002. The data has a rising trend.
 When looking into fire subcategories, the most reports belonged to: Outside Fires (38.9%), and Structure Fires (35.5%).