Estimated zip code population in 2022: 24,451 Zip code population in 2010: 20,082 Zip code population in 2000: 15,391
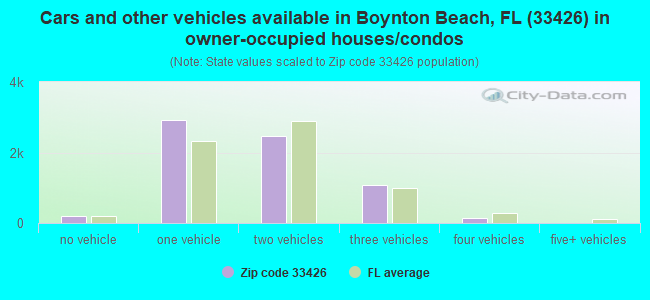
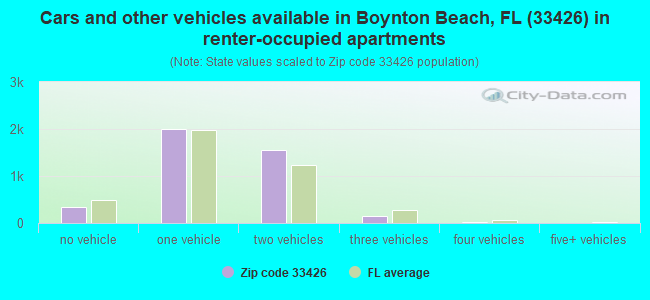
Houses and condos: 12,288 Renter-occupied apartments: 4,071
% of renters here:
37%
State:
33%
March 2022 cost of living index in zip code 33426: 100.4 (near average, U.S. average is 100)
Land area: 6.1 sq. mi. Water area: 0.1 sq. mi.
Population density: 3,985 people per square mile
(average).
OSM Map
General Map
Google Map
MSN Map
OSM Map
General Map
Google Map
MSN Map
OSM Map
General Map
Google Map
MSN Map
OSM Map
General Map
Google Map
MSN Map
Please wait while loading the map...
Real estate property taxes paid for housing units in 2022:
This zip code:
0.7% ($2,471)
Florida:
0.7% ($2,529)
Median real estate property taxes paid for housing units with mortgages in 2022: $3,076 (0.9%) Median real estate property taxes paid for housing units with no mortgage in 2022: $1,802 (0.6%)
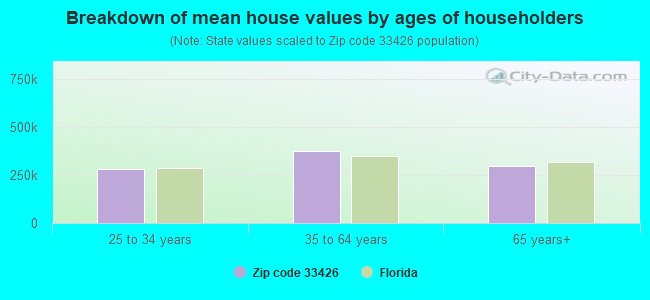
Estimated median house/condo value in 2022: $333,741
33426:
$333,741
Florida:
$354,100
According to our research of Florida and other state lists, there was 1 registered sex offender living in 33426 zip code as of April 27, 2024. The ratio of all residents to sex offenders in zip code 33426 is 22,050 to 1. The ratio of registered sex offenders to all residents in this zip code is much lower than the state average.
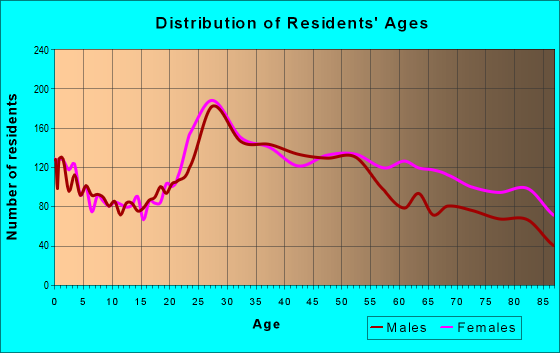
Median resident age:
This zip code:
44.0 years
Florida median age:
42.7 years
Average household size:
This zip code:
2.2 people
Florida:
2.5 people
Averages for the 2020 tax year for zip code 33426, filed in 2021:
Average Adjusted Gross Income (AGI) in 2020: $53,034 (Individual Income Tax Returns)
Here:
$53,034
State:
$82,200
Salary/wage: $48,512 (reported on 78.8% of returns)
Here:
$48,512
State:
$58,347
(% of AGI for various income ranges: 1258.5% for AGIs below $25k, 3793.5% for AGIs $25k-50k, 6725.9% for AGIs $50k-75k, 10100.0% for AGIs $75k-100k, 17930.1% for AGIs $100k-200k, 59271.4% for AGIs over 200k)
Taxable interest for individuals: $1,405 (reported on 21.7% of returns)
This zip code:
$1,405
Florida:
$4,272
(% of AGI for various income ranges: 17.8% for AGIs below $25k, 19.8% for AGIs $25k-50k, 46.1% for AGIs $50k-75k, 59.6% for AGIs $75k-100k, 123.7% for AGIs $100k-200k, 1197.1% for AGIs over 200k)
Ordinary dividends: $5,313 (reported on 18.1% of returns)
Here:
$5,313
State:
$15,863
(% of AGI for various income ranges: 38.0% for AGIs below $25k, 52.6% for AGIs $25k-50k, 108.3% for AGIs $50k-75k, 168.1% for AGIs $75k-100k, 373.5% for AGIs $100k-200k, 6461.4% for AGIs over 200k)
Net capital gain/loss in AGI: +$10,276 (reported on 17.1% of returns)
Here:
+$10,276
State:
+$62,983
(% of AGI for various income ranges: 8.4% for AGIs below $25k, 38.9% for AGIs $25k-50k, 126.2% for AGIs $50k-75k, 242.6% for AGIs $75k-100k, 632.2% for AGIs $100k-200k, 20574.3% for AGIs over 200k)
Profit/loss from business: +$4,761 (reported on 24.4% of returns)
Here:
+$4,761
State:
+$9,719
(% of AGI for various income ranges: 150.9% for AGIs below $25k, 49.3% for AGIs $25k-50k, 117.8% for AGIs $50k-75k, 249.6% for AGIs $75k-100k, 476.3% for AGIs $100k-200k, 2600.0% for AGIs over 200k)
Taxable individual retirement arrangement distribution: $18,394 (reported on 8.4% of returns)
33426:
$18,394
Florida:
$24,823
(% of AGI for various income ranges: 57.5% for AGIs below $25k, 85.5% for AGIs $25k-50k, 207.8% for AGIs $50k-75k, 388.4% for AGIs $75k-100k, 829.4% for AGIs $100k-200k, 5584.3% for AGIs over 200k)
Self-employed (Keogh) retirement plans: $16,050 (reported on 0.1% of returns)
33426:
$16,050
Florida:
$29,694
(% of AGI for various income ranges: 18.0% for AGIs $50k-75k)
Total itemized deductions: $27,951 (reported on 7.2% of returns)
Here:
$27,951
State:
$45,393
(% of AGI for various income ranges: 68.0% for AGIs below $25k, 173.5% for AGIs $25k-50k, 343.2% for AGIs $50k-75k, 566.2% for AGIs $75k-100k, 863.2% for AGIs $100k-200k, 4867.1% for AGIs over 200k)
Charity contributions: $6,262 (reported on 5.3% of returns)
Here:
$6,262
State:
$20,178
(% of AGI for various income ranges: 4.1% for AGIs below $25k, 21.4% for AGIs $25k-50k, 45.1% for AGIs $50k-75k, 100.6% for AGIs $75k-100k, 166.5% for AGIs $100k-200k, 1424.3% for AGIs over 200k)
Taxes paid: $5,605 (reported on 7.0% of returns)
33426:
$5,605
State:
$6,967
(% of AGI for various income ranges: 9.7% for AGIs below $25k, 34.3% for AGIs $25k-50k, 73.3% for AGIs $50k-75k, 119.6% for AGIs $75k-100k, 169.0% for AGIs $100k-200k, 811.4% for AGIs over 200k)
Earned income credit: $2,129 (reported on 17.3% of returns)
Here:
$2,129
State:
$2,306
(% of AGI for various income ranges: 103.8% for AGIs below $25k, 53.5% for AGIs $25k-50k)
Percentage of individuals using paid preparers for their 2020 taxes: 93.2%
Here:
93%
State:
92%
(% for various income ranges: 92.1% for AGIs below $25k, 94.0% for AGIs $25k-50k, 93.5% for AGIs $50k-75k, 94.0% for AGIs $75k-100k, 92.6% for AGIs $100k-200k, 96.2% for AGIs over 200k)
Averages for the 2012 tax year for zip code 33426, filed in 2013:
Average Adjusted Gross Income (AGI) in 2012: $42,336 (Individual Income Tax Returns)
Here:
$42,336
State:
$60,316
Salary/wage: $39,998 (reported on 79.0% of returns)
Here:
$39,998
State:
$45,277
(% of AGI for various income ranges: 72.0% for AGIs below $25k, 81.1% for AGIs $25k-50k, 78.3% for AGIs $50k-75k, 73.9% for AGIs $75k-100k, 75.6% for AGIs $100k-200k, 39.6% for AGIs over 200k)
Taxable interest for individuals: $1,632 (reported on 27.1% of returns)
This zip code:
$1,632
Florida:
$3,587
(% of AGI for various income ranges: 1.6% for AGIs below $25k, 1.1% for AGIs $25k-50k, 0.9% for AGIs $50k-75k, 0.9% for AGIs $75k-100k, 1.0% for AGIs $100k-200k, 0.8% for AGIs over 200k)
Ordinary dividends: $4,897 (reported on 19.0% of returns)
Here:
$4,897
State:
$12,831
(% of AGI for various income ranges: 3.0% for AGIs below $25k, 1.8% for AGIs $25k-50k, 1.8% for AGIs $50k-75k, 2.0% for AGIs $75k-100k, 2.0% for AGIs $100k-200k, 4.7% for AGIs over 200k)
Net capital gain/loss in AGI: +$3,516 (reported on 15.3% of returns)
Here:
+$3,516
State:
+$33,493
(% of AGI for various income ranges: 0.2% for AGIs $25k-50k, 0.1% for AGIs $50k-75k, 1.3% for AGIs $75k-100k, 2.3% for AGIs $100k-200k, 10.3% for AGIs over 200k)
Profit/loss from business: +$5,848 (reported on 17.3% of returns)
Here:
+$5,848
State:
+$10,012
(% of AGI for various income ranges: 7.1% for AGIs below $25k, 1.9% for AGIs $25k-50k, 1.4% for AGIs $50k-75k, 1.9% for AGIs $75k-100k, 2.2% for AGIs $100k-200k)
Taxable individual retirement arrangement distribution: $12,322 (reported on 11.0% of returns)
33426:
$12,322
Florida:
$21,544
(% of AGI for various income ranges: 5.2% for AGIs below $25k, 2.1% for AGIs $25k-50k, 2.4% for AGIs $50k-75k, 3.1% for AGIs $75k-100k, 3.3% for AGIs $100k-200k, 6.6% for AGIs over 200k)
Total itemized deductions: $17,617 (26% of AGI, reported on 25.3% of returns)
Here:
$17,617
State:
$25,533
Here:
26.3% of AGI
State:
18.0% of AGI
(% of AGI for various income ranges: 10.5% for AGIs below $25k, 11.3% for AGIs $25k-50k, 10.5% for AGIs $50k-75k, 10.7% for AGIs $75k-100k, 10.5% for AGIs $100k-200k, 7.2% for AGIs over 200k)
Charity contributions: $2,750 (reported on 19.6% of returns)
Here:
$2,750
State:
$5,698
(% of AGI for various income ranges: 0.8% for AGIs below $25k, 1.2% for AGIs $25k-50k, 1.2% for AGIs $50k-75k, 1.5% for AGIs $75k-100k, 1.5% for AGIs $100k-200k, 1.6% for AGIs over 200k)
Taxes paid: $3,619 (reported on 24.5% of returns)
33426:
$3,619
State:
$6,203
(% of AGI for various income ranges: 1.8% for AGIs below $25k, 2.5% for AGIs $25k-50k, 1.9% for AGIs $50k-75k, 1.8% for AGIs $75k-100k, 2.2% for AGIs $100k-200k, 2.1% for AGIs over 200k)
Earned income credit: $2,098 (reported on 18.5% of returns)
Here:
$2,098
State:
$2,372
(% of AGI for various income ranges: 5.9% for AGIs below $25k, 0.7% for AGIs $25k-50k)
Percentage of individuals using paid preparers for their 2012 taxes: 59.7%
Here:
60%
State:
54%
(% for various income ranges: 61.7% for AGIs below $25k, 56.9% for AGIs $25k-50k, 58.8% for AGIs $50k-75k, 59.5% for AGIs $75k-100k, 60.6% for AGIs $100k-200k, 77.8% for AGIs over 200k)
Averages for the 2004 tax year for zip code 33426, filed in 2005:
Average Adjusted Gross Income (AGI) in 2004: $40,112 (Individual Income Tax Returns)
Here:
$40,112
State:
$50,523
Salary/wage: $37,548 (reported on 73.0% of returns)
Here:
$37,548
State:
$39,563
(% of AGI for various income ranges: 96.1% for AGIs below $10k, 64.8% for AGIs $10k-25k, 73.1% for AGIs $25k-50k, 73.4% for AGIs $50k-75k, 77.0% for AGIs $75k-100k, 52.6% for AGIs over 100k)
Taxable interest for individuals: $2,561 (reported on 46.6% of returns)
This zip code:
$2,561
Florida:
$3,211
(% of AGI for various income ranges: 14.0% for AGIs below $10k, 5.3% for AGIs $10k-25k, 3.0% for AGIs $25k-50k, 2.6% for AGIs $50k-75k, 1.8% for AGIs $75k-100k, 2.2% for AGIs over 100k)
Taxable dividends: $3,963 (reported on 28.4% of returns)
Here:
$3,963
State:
$6,129
(% of AGI for various income ranges: 11.9% for AGIs below $10k, 4.6% for AGIs $10k-25k, 2.4% for AGIs $25k-50k, 2.1% for AGIs $50k-75k, 1.5% for AGIs $75k-100k, 3.4% for AGIs over 100k)
Net capital gain/loss: +$7,600 (reported on 24.8% of returns)
Here:
+$7,600
State:
+$27,205
(% of AGI for various income ranges: -7.6% for AGIs below $10k, -0.2% for AGIs $10k-25k, 0.6% for AGIs $25k-50k, 1.3% for AGIs $50k-75k, 2.7% for AGIs $75k-100k, 17.2% for AGIs over 100k)
Profit/loss from business: +$6,923 (reported on 13.3% of returns)
Here:
+$6,923
State:
+$10,634
(% of AGI for various income ranges: 12.5% for AGIs below $10k, 4.7% for AGIs $10k-25k, 2.3% for AGIs $25k-50k, 0.9% for AGIs $50k-75k, 1.2% for AGIs $75k-100k, 2.4% for AGIs over 100k)
IRA payment deduction: $2,696 (reported on 2.6% of returns)
33426:
$2,696
Florida:
$3,082
(% of AGI for various income ranges: 0.5% for AGIs below $10k, 0.2% for AGIs $10k-25k, 0.2% for AGIs $25k-50k, 0.2% for AGIs $50k-75k, 0.2% for AGIs $75k-100k, 0.1% for AGIs over 100k)
Self-employed pension: $10,476 (reported on 0.2% of returns)
Here:
$10,476
Florida:
$15,857
Total itemized deductions: $15,804 (26% of AGI, reported on 35.2% of returns)
Here:
$15,804
State:
$20,370
Here:
26.3% of AGI
State:
20.7% of AGI
(% of AGI for various income ranges: 23.5% for AGIs below $10k, 15.6% for AGIs $10k-25k, 15.2% for AGIs $25k-50k, 15.2% for AGIs $50k-75k, 14.3% for AGIs $75k-100k, 9.3% for AGIs over 100k)
Charity contributions deductions: $2,245 (4% of AGI, reported on 30.1% of returns)
Here:
$2,245
State:
$4,064
Here:
3.8% of AGI
State:
3.8% of AGI
(% of AGI for various income ranges: 1.3% for AGIs below $10k, 1.6% for AGIs $10k-25k, 1.7% for AGIs $25k-50k, 2.0% for AGIs $50k-75k, 1.9% for AGIs $75k-100k, 1.4% for AGIs over 100k)
Total tax: $5,561 (reported on 76.7% of returns)
33426:
$5,561
State:
$9,431
(% of AGI for various income ranges: 4.1% for AGIs below $10k, 3.9% for AGIs $10k-25k, 7.4% for AGIs $25k-50k, 9.7% for AGIs $50k-75k, 11.3% for AGIs $75k-100k, 18.5% for AGIs over 100k)
Earned income credit: $1,541 (reported on 11.5% of returns)
Here:
$1,541
State:
$1,808
Percentage of individuals using paid preparers for their 2004 taxes: 60.2%
Here:
60%
State:
60%
(% for various income ranges: 56.9% for AGIs below $10k, 61.8% for AGIs $10k-25k, 59.1% for AGIs $25k-50k, 60.0% for AGIs $50k-75k, 59.5% for AGIs $75k-100k, 71.7% for AGIs over 100k)
Likely homosexual households (counted as self-reported same-sex unmarried-partner households)
Lesbian couples: 0.0% of all households
Gay men: 0.2% of all households
Household received Food Stamps/SNAP in the past 12 months: 756 Household did not receive Food Stamps/SNAP in the past 12 months: 10,167
Women who had a birth in the past 12 months: 250 (117 now married, 126 unmarried) Women who did not have a birth in the past 12 months: 5,559 (1,557 now married, 3,999 unmarried)
Housing units in zip code 33426 with a mortgage: 4,261 (248 second mortgage, 251 both second mortgage and home equity loan) Houses without a mortgage: 38
Median monthly owner costs for units with a mortgage: $1,732 Median monthly owner costs for units without a mortgage: $533
Residents with income below the poverty level in 2022:
This zip code:
8.7%
Whole state:
12.7%
Residents with income below 50% of the poverty level in 2022:
This zip code:
4.6%
Whole state:
6.6%
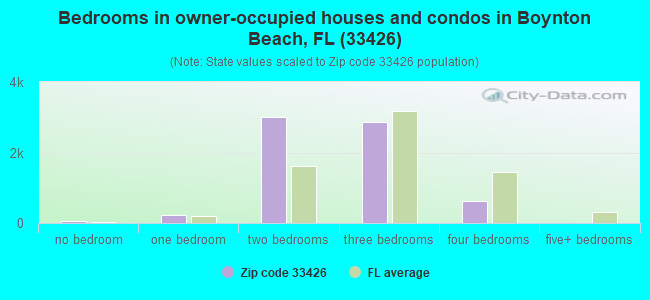
Median number of rooms in houses and condos:
Here:
5.3
State:
5.9
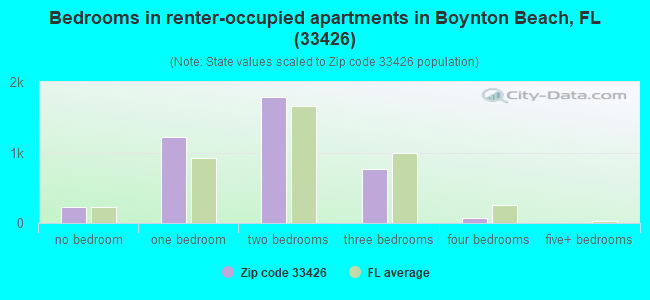
Median number of rooms in apartments:
Here:
4.1
State:
4.2
Notable locations in this zip code not listed on our city pages
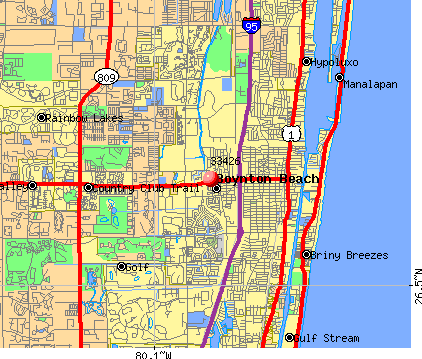
Notable locations in zip code 33426: Boggy Creek Golf Club (A), Boynton Plaza (B), Boynton Lakes Plaza (C), Boynton Beach Fashion Square (D), Leisure Plaza (E), Lake Country Golf and Country Club (F), Gheha Recreation Hall (G). Display/hide their locations on the map
1,664 married couples with children.
1,462 single-parent households (808 men, 654 women).
64.6% of residents of 33426 zip code speak English at home.
16.2% of residents speak Spanish at home (58% very well, 11% well, 28% not well, 3% not at all).
17.6% of residents speak other Indo-European language at home (74% very well, 12% well, 10% not well, 4% not at all).
1.1% of residents speak Asian or Pacific Island language at home (53% very well, 34% well, 13% not at all).
1.0% of residents speak other language at home (99% very well, 1% well).
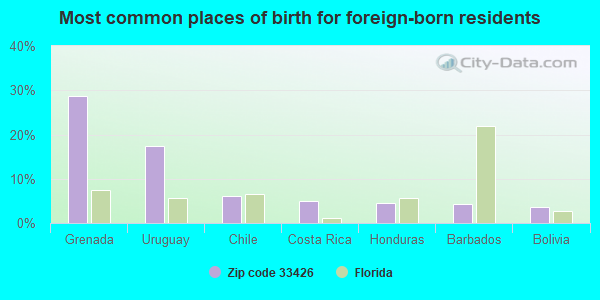
Foreign born population: 7,162 (29.3%) (65.0% of them are naturalized citizens)
Major facilities with environmental interests located in this zip code:
SAFETY KLEEN SYSTEMS 309701 (5610 ALPHA DRIVE in BOYNTON BEACH, FL)
CRITERIA AND HAZARDOUS AIR POLLUTANT INVENTORY (Inventory of air pollution sources) National Pollutant Discharge Elimination System NON-MAJOR (Tracking pollutant discharge elimination systems) - permit National Pollutant Discharge Elimination System NON-MAJOR (Tracking pollutant discharge elimination systems) - permit HAZARDOUS WASTE BIENNIAL REPORTER (Resource Conservation and Recovery Act (tracking hazardous waste)) Large Quantity Generators, more that 1000 kg of hazardous waste/month (Resource Conservation and Recovery Act (tracking hazardous waste)) TRANSPORTER (Resource Conservation and Recovery Act (tracking hazardous waste)) TSD (Resource Conservation and Recovery Act (tracking hazardous waste)) USED OIL PROGRAM (Resource Conservation and Recovery Act (tracking hazardous waste)) TRI REPORTER (Tracking of toxic chemicals releasing facilities) Business SIC classification: BUSINESS SERVICES Organizations: MARC MASON (CONTACT/OWNER)
, JOE HARTLINE (CONTACT/OWNER)
Alternative names: SAFETY-KLEEN, SAFETY KLEEN CORP 3-097-01, SAFETY-KLEEN SYSTEMS INC
SERMATECH INTERNATIONAL INC (507 INDUSTRIAL WAY in BOYNTON BEACH, FL)
AIR MINOR (AIRS/AFS) CRITERIA AND HAZARDOUS AIR POLLUTANT INVENTORY (Inventory of air pollution sources) HAZARDOUS WASTE BIENNIAL REPORTER (Resource Conservation and Recovery Act (tracking hazardous waste)) (Resource Conservation and Recovery Act (tracking hazardous waste)) TRI REPORTER (Tracking of toxic chemicals releasing facilities) Business SIC classification: COATING, ENGRAVING, AND ALLIED SERVICES; AIRCRAFT PARTS AND AUXILIARY EQUIPMENT Organizations: CARLOS CAGGIANI (CONTACT/OWNER)
Alternative names: AIRFOIL TECHNOLOGIES FLORIDA INC
SOUTH TECHNICAL EDUCATION CENTER (1300 SW 30TH AVE in BOYNTON BEACH, FL)
(Geographic Names Information System) (National Center for Education Statistics) - STATE ID-1571 Organizations: PALM BEACH COUNTY SCHOOL DISTRICT (SCHOOL DISTRICT)
CONGRESS COMMUNITY MIDDLE SCHOOL (101 S CONGRESS AVE in BOYNTON BEACH, FL)
(Geographic Names Information System) (National Center for Education Statistics) - STATE ID-1581 Organizations: PALM BEACH COUNTY SCHOOL DISTRICT (SCHOOL DISTRICT)
PRECISION AUTO BODY WORKS (400 WEST INDUSTRIAL AVENUE in BOYNTON BEACH, FL)
(Resource Conservation and Recovery Act (tracking hazardous waste)) Business NAICS classification: AUTOMOTIVE BODY, PAINT, AND INTERIOR REPAIR AND MAINTENANCE. Organizations: ED ABRAMCZYK (CONTACT/OWNER)
, FRANKLIN DAVE OWNER (CONTACT/OWNER)
Alternative names: MR D AUTO BODY & PAINTING
CROSSPOINTE ELEMENTARY SCHOOL (3015 SOUTH CONGRESS AVE. in BOYNTON BEACH, FL)
(National Center for Education Statistics) - STATE ID-2731 Organizations: PALM BEACH COUNTY SCHOOL DISTRICT (SCHOOL DISTRICT)
MOTOROLA INC BOYNTON BEACH (1500 GATEWAY BOULEVARD in BOYNTON BEACH, FL)
HAZARDOUS WASTE BIENNIAL REPORTER (Resource Conservation and Recovery Act (tracking hazardous waste)) (Resource Conservation and Recovery Act (tracking hazardous waste)) TRI REPORTER (Tracking of toxic chemicals releasing facilities) Business SIC classification: RADIO AND TELEVISION BROADCASTING AND COMMUNICATIONS EQUIPMENT Alternative names: MOTOROLA INC., PAGING & TELEPOINT SYS., MOTOROLA INC PAGING PRODUCTS DIV, MOTOROLA - BOYNTON BEACH
AMERICAN MARBLE INC (1420 NEPTUNE DR. #E in BOYNTON BEACH, FL)
AIR MINOR (AIRS/AFS) CRITERIA AND HAZARDOUS AIR POLLUTANT INVENTORY (Inventory of air pollution sources) TRI REPORTER (Tracking of toxic chemicals releasing facilities) Business SIC classification: PLASTICS PRODUCTS
LECLEAN CORP (1899-7 N CONGRESS AVE in BOYNTON BEACH, FL)
AIR MINOR (AIRS/AFS) Small Quantity Generators, between 100 kg and 1000 kg of hazardous waste/month (Resource Conservation and Recovery Act (tracking hazardous waste)) - notification Business SIC classification: DRYCLEANING PLANTS, EXCEPT RUG CLEANING Organizations: ROBERT LEDUC, MGR (CONTACT/OWNER)
Alternative names: DRY CLEANER LECLEAN CORP PALM BEACH
QUANTUM PARK LOT 21 (1425 GATEWAY BLVD N SIDE in BOYNTON BCH, FL)
National Pollutant Discharge Elimination System NON-MAJOR (Tracking pollutant discharge elimination systems) - permit Organizations: DOUGLAS MACDONALD (CONTACT/OWNER)
QUANTUM PARK LOT 50A (4875 PARK RIDGE RD in BOYNTON BCH, FL)
National Pollutant Discharge Elimination System NON-MAJOR (Tracking pollutant discharge elimination systems) - permit Organizations: DOUGLAS MACDONALD (CONTACT/OWNER)
RX AUTOMATION INC (3800 S CONGRESS AVE SUITE 8 in BOYNTON BEACH, FL)
Large Quantity Generators, more that 1000 kg of hazardous waste/month (Resource Conservation and Recovery Act (tracking hazardous waste)) Organizations: RX AUTOMATION INC. (CONTACT/OPERATOR)
, BETHESDA SERVICE CENTER (CONTACT/OWNER)
SAFE & SECURE - BOYNTON (NE CORNER OF CONGRESS AND SW 3 in BOYNTON BEACH, FL)
National Pollutant Discharge Elimination System NON-MAJOR (Tracking pollutant discharge elimination systems) - permit Organizations: ANTHONY PUGLIESE (CONTACT/OWNER)
Housing units lacking complete plumbing facilities: 1.1% Housing units lacking complete kitchen facilities: 3.2%
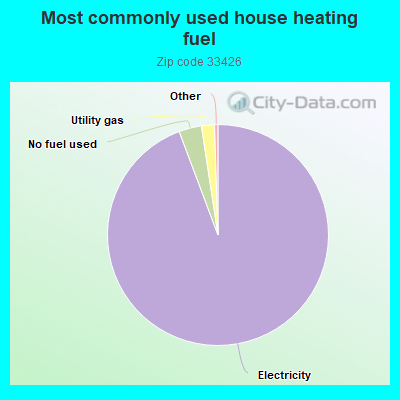
94.3%Electricity
3.3%No fuel used
1.9%Utility gas
Population in 1990: 9,390. Population change in the 1990s: +6,001 (+63.9%).
Place of birth for U.S.-born residents:
This state: 7,034
Northeast: 5,581
Midwest: 2,225
South: 1,398
West: 504
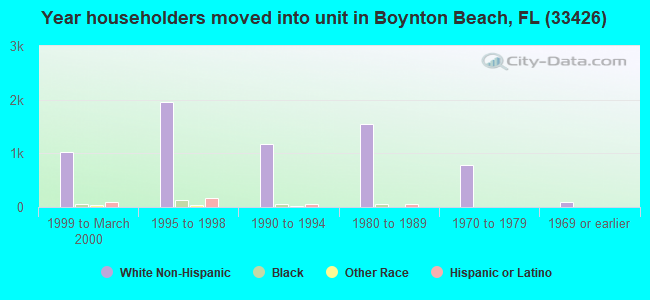
53% of the 33426 zip code residents lived in the same house 5 years ago. Out of people who lived in different houses, 55% lived in this county. Out of people who lived in different counties, 50% lived in Florida.
86% of the 33426 zip code residents lived in the same house 1 year ago. Out of people who lived in different houses, 65% moved from this county. Out of people who lived in different houses, 13% moved from different county within same state. Out of people who lived in different houses, 12% moved from different state. Out of people who lived in different houses, 1% moved from abroad.
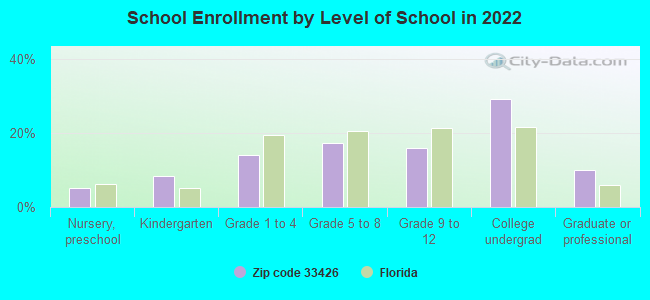
Private vs. public school enrollment:
Students in private schools in grades 1 to 8 (elementary and middle school): 185
Here:
14.4%
Florida:
15.8%
Students in private schools in grades 9 to 12 (high school): 103
Here:
15.7%
Florida:
12.9%
Students in private undergraduate colleges: 365
Here:
30.0%
Florida:
23.6%
Occupation by median earnings in the past 12 months ($)
90,946Law enforcement workers including supervisors
80,702Architecture and engineering occupations
76,507Computer and mathematical occupations
73,736Transportation occupations
72,610Legal occupations
68,900Business and financial operations occupations
Companies with biggest federal contracts located in this zip code (BOYNTON BEACH, FL):
UNIVERSAL INDUSTRIES LIMITED I (3050 SW 14TH PLACE; small business) 50 employees, $0 revenue. : $838,171 in 48 contractsfrom 2001 to 2006
Contracts for Gas Turbines and Jet Engines, Aircraft; Prime Moving, and Components, Studs, Hose, Pipe, Tube, Lubrication, and Railing Fittings, Gears, Pulleys, Sprockets, and Transmission Chain, and moreby Air Force, Defense Logistics Agency, Navy Signed by year:2000: $0; 2001: $72,160; 2002: $243,677; 2003: $0; 2004: $424,347; 2005: $37,812; 2006: $60,175.
Biggest contracts:
$99,871 with Air Force for Gas Turbines and Jet Engines, Aircraft; Prime Moving, and Components. Signed on 2002-02-11. Completion date: 2002-03-11.
$72,160 with Defense Logistics Agency for Gas Turbines and Jet Engines, Aircraft; Prime Moving, and Components. Signed on 2001-11-23. Completion date: 2001-12-23.
$68,463 with Air Force for Gas Turbines and Jet Engines, Aircraft; Prime Moving, and Components. Signed on 2006-04-21. Completion date: 2006-05-05.
$66,950, same as above.Signed on 2002-05-08. Completion date: 2002-06-07.
QUANTACHROME CORPORATION (1900 CORPORATE DRIVE; small business) : $384,516 in 17 contractsfrom 2000 to 2006
Contracts for Laboratory Equipment and Supplies, Medical and Surgical Instruments, Equipment, and Supplies, Electrical and Electronic Properties Measuring and Testing Instruments, Physical Properties Testing and Inspection, and moreby National Institute of Standards and Technology, ENERGY, Department of, Army, Navy, and others Signed by year:2000: $90,820; 2001: $44,778; 2002: $7,390; 2003: $0; 2004: $89,708; 2005: $123,623; 2006: $28,197.
Biggest contracts:
$78,065 with National Institute of Standards and Technology for Laboratory Equipment and Supplies. Taking place in MD. Signed on 2005-04-05. Completion date: 2006-06-30.
$63,341 with ENERGY, Department of for Laboratory Equipment and Supplies. Signed on 2004-09-21. Completion date: 2004-11-12.
$50,820 with Army for Medical and Surgical Instruments, Equipment, and Supplies. Taking place in GA. Signed on 2000-09-20. Completion date: 2000-10-06.
$47,500 with Navy for Electrical and Electronic Properties Measuring and Testing Instruments. Signed on 2005-07-12. Completion date: 2005-08-12.
ERIN ELECTRICAL ENTERPRISES IN (1720 CORPORATE DRIVE; small business) : $160,548 in 12 contractsfrom 2001 to 2005
Contracts for Electrical Hardware and Supplies, Wire and Cable, Electrical, Circuit Breakers, , and moreby NASA, Bureau of Prisoners/Federal Prison System, Department of State, Army, and others Signed by year:2000: $0; 2001: $56,000; 2002: $0; 2003: $0; 2004: $98,061; 2005: $6,487; 2006: $0.
Biggest contracts:
$67,411 with NASA for Electrical Hardware and Supplies. Signed on 2004-12-14. Effective on 2004-12-10. Completion date: 2005-01-24.
$56,000 with Bureau of Prisoners/Federal Prison System for Wire and Cable, Electrical. Signed on 2001-04-15. Completion date: 2004-04-15.
$26,000 with Bureau of Prisoners/Federal Prison System for Circuit Breakers. Signed on 2004-05-27. Completion date: 2009-04-30.
$4,650 with NASA for . Signed on 2004-07-07. Completion date: 2004-08-18.
SPECIAL PRODUCTS GROUP (2116 CORPORATE DR; small business) : $59,817 in 2 contractsin 2000
$34,254 with Army for Armor, Personal. Taking place in GA. Signed on 2000-09-21. Completion date: 2000-11-30.
$25,563, same as above.Signed on 2000-09-22. Completion date: 2000-11-30.
PURADYN FILTER TECHNOLOGIES IN (2017 HIGH RIDGE ROAD; small business) : $47,509 in 3 contractsfrom 2000 to 2006
$40,030 with Navy for Miscellaneous Maintenance and Repair Shop Specialized Equipment. Signed on 2000-08-28. Completion date: 2000-08-31.
$7,478 with Army for Engine Air and Oil Filters, Strainers, and Cleaners, Nonaircraft. Signed on 2006-06-26. Completion date: 2006-08-25.
$1 with Army for Diesel Engines and Components. Signed on 2006-06-30. Completion date: 2006-12-31.
TOWER OPTICAL CORPORATION (3600 S CONGRESS AVE; small business) : $19,166 in 3 contractsfrom 2003 to 2005
$13,275 with Navy for Fiber Optic Accessories And Supplies. Signed on 2005-07-12. Completion date: 2005-08-31.
$4,116 with Navy for Fiber Optic Devices. Signed on 2003-09-15. Completion date: 2003-10-31.
$1,775, same as above.Signed on 2004-04-06. Completion date: 2004-07-07.
HERMANI AG INC (7 RIPLEY WAY; small business)
$12,500 with Army for Specialized Shipping and Storage Containers. Signed on 2005-03-08. Completion date: 2005-04-08.
INTL SOFTWARE SYTMS SOLUTIONS, (109 COMMERCE ROAD; small business)
$5,908 with Army for ADP Software. Signed on 2004-09-16. Completion date: 2004-09-22.
INDUSTRIAL WEBBING CORP (3300 SOUTH CONGRESS AVENUE; small business)
$2,895 with Army for Fastening Device. Signed on 2006-04-19. Completion date: 2006-06-12.
ADVANCED PRECISION MACHINING I (3050 SW 14TH PL UNIT 8&5; small business)
$342 with Navy for Miscellaneous Items. Signed on 2005-06-29. Completion date: 2005-07-30.
Top industries in this zip code by the number of employees in 2005:
Health Care and Social Assistance: Home Health Care Services (500-999 employees: 1 establishment, 100-249 employees: 1 establishment, 50-99 employees: 1 establishment, 20-49 employees: 7 establishments, 5-9 employees: 2 establishments, 1-4 employees: 3 establishments)
2003 - 2018 National Fire Incident Reporting System (NFIRS) incidents
According to the data from the years 2003 - 2018 the average number of fires per year is 28. The highest number of reported fire incidents - 47 took place in 2004, and the least - 1 in 2016. The data has a declining trend.
When looking into fire subcategories, the most reports belonged to: Outside Fires (42.4%), and Structure Fires (26.4%).
Fire incident types reported to NFIRS in Zip Code 33426
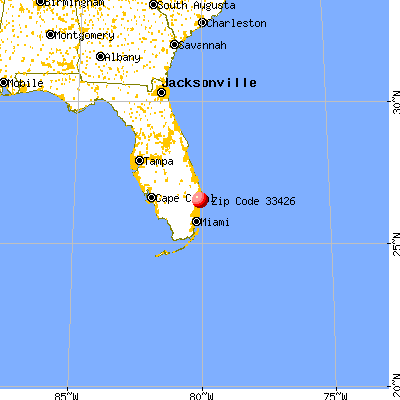


 Nearest zip codes: 33435, 33436, 33462, 33437, 33483, 33463.
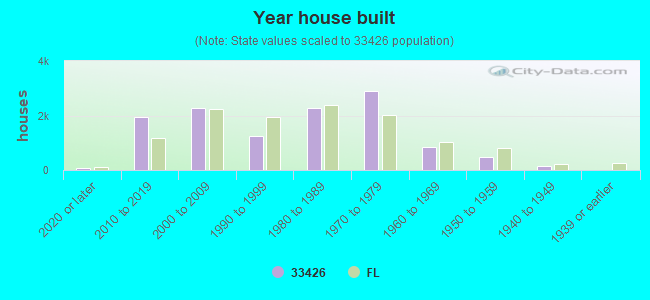


 According to the data from the years 2003 - 2018 the average number of fires per year is 28. The highest number of reported fire incidents - 47 took place in 2004, and the least - 1 in 2016. The data has a declining trend.
 When looking into fire subcategories, the most reports belonged to: Outside Fires (42.4%), and Structure Fires (26.4%).