Estimated zip code population in 2022: 12,995 Zip code population in 2010: 12,093 Zip code population in 2000: 12,729
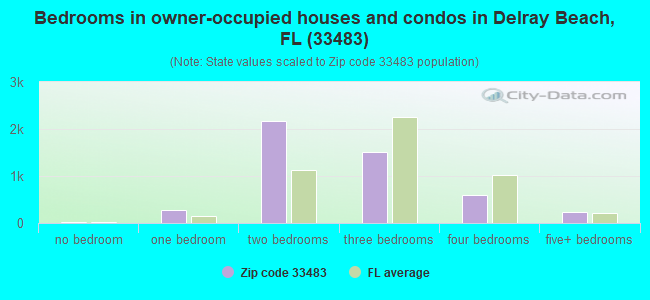
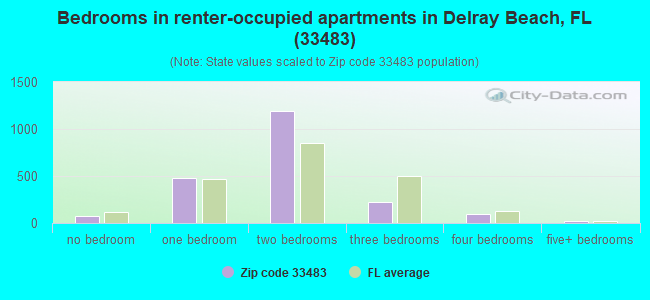
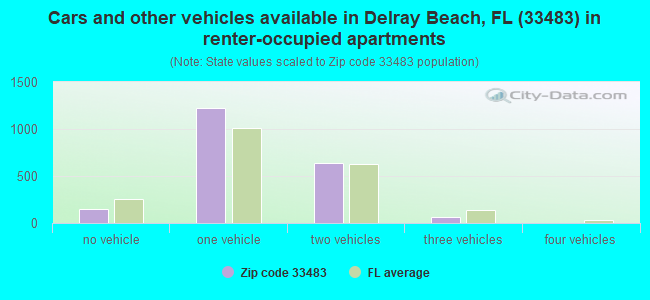
Houses and condos: 9,774 Renter-occupied apartments: 2,079
% of renters here:
30%
State:
33%
March 2022 cost of living index in zip code 33483: 104.7 (near average, U.S. average is 100)
Land area: 3.9 sq. mi. Water area: 1.8 sq. mi.
Population density: 3,298 people per square mile
(average).
OSM Map
General Map
Google Map
MSN Map
OSM Map
General Map
Google Map
MSN Map
OSM Map
General Map
Google Map
MSN Map
OSM Map
General Map
Google Map
MSN Map
Please wait while loading the map...
Real estate property taxes paid for housing units in 2022:
This zip code:
0.7% ($6,386)
Florida:
0.7% ($2,529)
Median real estate property taxes paid for housing units with mortgages in 2022: $5,553 (0.7%) Median real estate property taxes paid for housing units with no mortgage in 2022: $7,092 (0.7%)
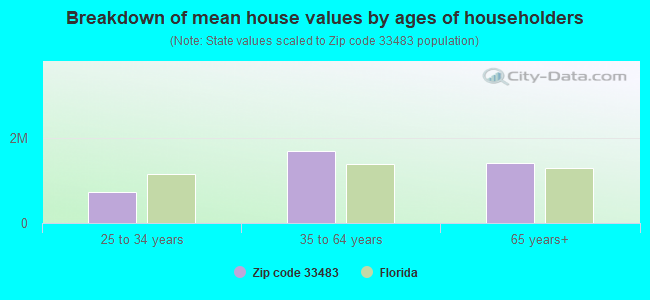
Estimated median house/condo value in 2022: $852,773
33483:
$852,773
Florida:
$354,100
According to our research of Florida and other state lists, there was 1 registered sex offender living in 33483 zip code as of April 27, 2024. The ratio of all residents to sex offenders in zip code 33483 is 11,731 to 1. The ratio of registered sex offenders to all residents in this zip code is much lower than the state average.
Median resident age:
This zip code:
58.6 years
Florida median age:
42.7 years
Average household size:
This zip code:
1.9 people
Florida:
2.5 people
Averages for the 2020 tax year for zip code 33483, filed in 2021:
Average Adjusted Gross Income (AGI) in 2020: $696,146 (Individual Income Tax Returns)
Here:
$696,146
State:
$82,200
Salary/wage: $317,478 (reported on 61.8% of returns)
Here:
$317,478
State:
$58,347
(% of AGI for various income ranges: 1190.0% for AGIs below $25k, 3701.9% for AGIs $25k-50k, 6418.1% for AGIs $50k-75k, 9532.9% for AGIs $75k-100k, 15957.2% for AGIs $100k-200k, 453865.7% for AGIs over 200k)
Taxable interest for individuals: $53,192 (reported on 53.6% of returns)
This zip code:
$53,192
Florida:
$4,272
(% of AGI for various income ranges: 48.8% for AGIs below $25k, 131.0% for AGIs $25k-50k, 193.8% for AGIs $50k-75k, 511.7% for AGIs $75k-100k, 1005.4% for AGIs $100k-200k, 71554.6% for AGIs over 200k)
Ordinary dividends: $119,360 (reported on 52.3% of returns)
Here:
$119,360
State:
$15,863
(% of AGI for various income ranges: 168.4% for AGIs below $25k, 440.7% for AGIs $25k-50k, 748.3% for AGIs $50k-75k, 1660.8% for AGIs $75k-100k, 4208.0% for AGIs $100k-200k, 151551.8% for AGIs over 200k)
Net capital gain/loss in AGI: +$584,334 (reported on 52.7% of returns)
Here:
+$584,334
State:
+$62,983
(% of AGI for various income ranges: 119.8% for AGIs below $25k, 253.3% for AGIs $25k-50k, 312.3% for AGIs $50k-75k, 2425.4% for AGIs $75k-100k, 2995.7% for AGIs $100k-200k, 794883.6% for AGIs over 200k)
Profit/loss from business: +$57,898 (reported on 23.5% of returns)
Here:
+$57,898
State:
+$9,719
(% of AGI for various income ranges: 241.8% for AGIs below $25k, 327.8% for AGIs $25k-50k, 461.7% for AGIs $50k-75k, 700.0% for AGIs $75k-100k, 1328.9% for AGIs $100k-200k, 30346.1% for AGIs over 200k)
Taxable individual retirement arrangement distribution: $53,507 (reported on 16.4% of returns)
33483:
$53,507
Florida:
$24,823
(% of AGI for various income ranges: 88.6% for AGIs below $25k, 272.6% for AGIs $25k-50k, 508.3% for AGIs $50k-75k, 1316.7% for AGIs $75k-100k, 3231.1% for AGIs $100k-200k, 14644.6% for AGIs over 200k)
Self-employed (Keogh) retirement plans: $47,769 (reported on 2.2% of returns)
33483:
$47,769
Florida:
$29,694
(% of AGI for various income ranges: 124.8% for AGIs $100k-200k, 2524.6% for AGIs over 200k)
Total itemized deductions: $185,291 (reported on 26.8% of returns)
Here:
$185,291
State:
$45,393
(% of AGI for various income ranges: 260.5% for AGIs below $25k, 619.1% for AGIs $25k-50k, 862.7% for AGIs $50k-75k, 1814.6% for AGIs $75k-100k, 2969.1% for AGIs $100k-200k, 119363.2% for AGIs over 200k)
Charity contributions: $106,242 (reported on 23.5% of returns)
Here:
$106,242
State:
$20,178
(% of AGI for various income ranges: 14.7% for AGIs below $25k, 50.6% for AGIs $25k-50k, 94.6% for AGIs $50k-75k, 273.3% for AGIs $75k-100k, 537.2% for AGIs $100k-200k, 63808.6% for AGIs over 200k)
Taxes paid: $8,522 (reported on 26.8% of returns)
33483:
$8,522
State:
$6,967
(% of AGI for various income ranges: 50.6% for AGIs below $25k, 122.0% for AGIs $25k-50k, 180.2% for AGIs $50k-75k, 363.8% for AGIs $75k-100k, 640.7% for AGIs $100k-200k, 3816.1% for AGIs over 200k)
Earned income credit: $1,707 (reported on 7.8% of returns)
Here:
$1,707
State:
$2,306
(% of AGI for various income ranges: 79.1% for AGIs below $25k, 29.9% for AGIs $25k-50k)
Percentage of individuals using paid preparers for their 2020 taxes: 91.9%
Here:
92%
State:
92%
(% for various income ranges: 90.4% for AGIs below $25k, 91.2% for AGIs $25k-50k, 91.7% for AGIs $50k-75k, 91.1% for AGIs $75k-100k, 92.7% for AGIs $100k-200k, 93.6% for AGIs over 200k)
Averages for the 2012 tax year for zip code 33483, filed in 2013:
Average Adjusted Gross Income (AGI) in 2012: $271,854 (Individual Income Tax Returns)
Here:
$271,854
State:
$60,316
Salary/wage: $126,410 (reported on 65.0% of returns)
Here:
$126,410
State:
$45,277
(% of AGI for various income ranges: 70.8% for AGIs below $25k, 67.2% for AGIs $25k-50k, 55.1% for AGIs $50k-75k, 45.9% for AGIs $75k-100k, 42.7% for AGIs $100k-200k, 26.2% for AGIs over 200k)
Taxable interest for individuals: $15,715 (reported on 49.6% of returns)
This zip code:
$15,715
Florida:
$3,587
(% of AGI for various income ranges: 4.1% for AGIs below $25k, 2.9% for AGIs $25k-50k, 3.1% for AGIs $50k-75k, 3.4% for AGIs $75k-100k, 3.4% for AGIs $100k-200k, 2.8% for AGIs over 200k)
Ordinary dividends: $60,137 (reported on 44.2% of returns)
Here:
$60,137
State:
$12,831
(% of AGI for various income ranges: 7.6% for AGIs below $25k, 6.5% for AGIs $25k-50k, 7.7% for AGIs $50k-75k, 8.8% for AGIs $75k-100k, 11.4% for AGIs $100k-200k, 9.9% for AGIs over 200k)
Net capital gain/loss in AGI: +$176,815 (reported on 43.4% of returns)
Here:
+$176,815
State:
+$33,493
(% of AGI for various income ranges: 1.7% for AGIs $25k-50k, 1.7% for AGIs $50k-75k, 3.6% for AGIs $75k-100k, 5.1% for AGIs $100k-200k, 32.9% for AGIs over 200k)
Profit/loss from business: +$37,037 (reported on 20.5% of returns)
Here:
+$37,037
State:
+$10,012
(% of AGI for various income ranges: 10.8% for AGIs below $25k, 4.8% for AGIs $25k-50k, 4.3% for AGIs $50k-75k, 3.2% for AGIs $75k-100k, 3.8% for AGIs $100k-200k, 2.5% for AGIs over 200k)
Taxable individual retirement arrangement distribution: $63,730 (reported on 18.6% of returns)
33483:
$63,730
Florida:
$21,544
(% of AGI for various income ranges: 4.5% for AGIs below $25k, 3.6% for AGIs $25k-50k, 5.6% for AGIs $50k-75k, 9.5% for AGIs $75k-100k, 10.0% for AGIs $100k-200k, 3.7% for AGIs over 200k)
Self-employment retirement plans: $38,200 (reported on 1.6% of returns)
33483:
$38,200
Florida:
$20,611
Total itemized deductions: $68,848 (13% of AGI, reported on 46.0% of returns)
Here:
$68,848
State:
$25,533
Here:
12.7% of AGI
State:
18.0% of AGI
(% of AGI for various income ranges: 23.1% for AGIs below $25k, 20.0% for AGIs $25k-50k, 19.8% for AGIs $50k-75k, 20.1% for AGIs $75k-100k, 18.1% for AGIs $100k-200k, 10.2% for AGIs over 200k)
Charity contributions: $17,438 (reported on 39.1% of returns)
Here:
$17,438
State:
$5,698
(% of AGI for various income ranges: 1.1% for AGIs below $25k, 1.4% for AGIs $25k-50k, 1.8% for AGIs $50k-75k, 1.9% for AGIs $75k-100k, 2.5% for AGIs $100k-200k, 2.6% for AGIs over 200k)
Taxes paid: $28,348 (reported on 45.1% of returns)
33483:
$28,348
State:
$6,203
(% of AGI for various income ranges: 5.0% for AGIs below $25k, 5.2% for AGIs $25k-50k, 5.0% for AGIs $50k-75k, 6.1% for AGIs $75k-100k, 5.8% for AGIs $100k-200k, 4.5% for AGIs over 200k)
Earned income credit: $1,867 (reported on 10.6% of returns)
Here:
$1,867
State:
$2,372
(% of AGI for various income ranges: 4.4% for AGIs below $25k, 0.3% for AGIs $25k-50k)
Percentage of individuals using paid preparers for their 2012 taxes: 71.3%
Here:
71%
State:
54%
(% for various income ranges: 65.5% for AGIs below $25k, 63.9% for AGIs $25k-50k, 67.1% for AGIs $50k-75k, 71.7% for AGIs $75k-100k, 76.5% for AGIs $100k-200k, 89.7% for AGIs over 200k)
Averages for the 2004 tax year for zip code 33483, filed in 2005:
Average Adjusted Gross Income (AGI) in 2004: $147,161 (Individual Income Tax Returns)
Here:
$147,161
State:
$50,523
Salary/wage: $81,949 (reported on 64.3% of returns)
Here:
$81,949
State:
$39,563
(% of AGI for various income ranges: 69.9% for AGIs $10k-25k, 65.4% for AGIs $25k-50k, 52.0% for AGIs $50k-75k, 46.2% for AGIs $75k-100k, 28.7% for AGIs over 100k)
Taxable interest for individuals: $11,616 (reported on 61.4% of returns)
This zip code:
$11,616
Florida:
$3,211
(% of AGI for various income ranges: 5.0% for AGIs $10k-25k, 4.6% for AGIs $25k-50k, 5.1% for AGIs $50k-75k, 6.1% for AGIs $75k-100k, 3.9% for AGIs over 100k)
Taxable dividends: $26,290 (reported on 50.2% of returns)
Here:
$26,290
State:
$6,129
(% of AGI for various income ranges: 6.7% for AGIs $10k-25k, 6.2% for AGIs $25k-50k, 8.5% for AGIs $50k-75k, 10.5% for AGIs $75k-100k, 8.2% for AGIs over 100k)
Net capital gain/loss: +$105,223 (reported on 47.2% of returns)
Here:
+$105,223
State:
+$27,205
(% of AGI for various income ranges: 1.9% for AGIs $10k-25k, 2.0% for AGIs $25k-50k, 3.8% for AGIs $50k-75k, 5.9% for AGIs $75k-100k, 35.6% for AGIs over 100k)
Profit/loss from business: +$25,687 (reported on 18.4% of returns)
Here:
+$25,687
State:
+$10,634
(% of AGI for various income ranges: 6.5% for AGIs $10k-25k, 3.0% for AGIs $25k-50k, 4.2% for AGIs $50k-75k, 3.4% for AGIs $75k-100k, 3.1% for AGIs over 100k)
IRA payment deduction: $3,592 (reported on 3.9% of returns)
33483:
$3,592
Florida:
$3,082
(% of AGI for various income ranges: 0.3% for AGIs $10k-25k, 0.3% for AGIs $25k-50k, 0.3% for AGIs $50k-75k, 0.2% for AGIs $75k-100k, 0.1% for AGIs over 100k)
Self-employed pension: $27,181 (reported on 1.6% of returns)
Here:
$27,181
Florida:
$15,857
Total itemized deductions: $42,417 (16% of AGI, reported on 51.1% of returns)
Here:
$42,417
State:
$20,370
Here:
16.0% of AGI
State:
20.7% of AGI
(% of AGI for various income ranges: 26.4% for AGIs $10k-25k, 24.0% for AGIs $25k-50k, 23.2% for AGIs $50k-75k, 22.7% for AGIs $75k-100k, 11.8% for AGIs over 100k)
Charity contributions deductions: $13,759 (5% of AGI, reported on 45.3% of returns)
Here:
$13,759
State:
$4,064
Here:
4.9% of AGI
State:
3.8% of AGI
(% of AGI for various income ranges: 2.0% for AGIs $10k-25k, 2.4% for AGIs $25k-50k, 2.5% for AGIs $50k-75k, 2.8% for AGIs $75k-100k, 4.2% for AGIs over 100k)
Total tax: $38,340 (reported on 78.8% of returns)
33483:
$38,340
State:
$9,431
(% of AGI for various income ranges: 4.3% for AGIs $10k-25k, 7.7% for AGIs $25k-50k, 10.6% for AGIs $50k-75k, 11.7% for AGIs $75k-100k, 20.9% for AGIs over 100k)
Earned income credit: $1,370 (reported on 8.6% of returns)
Here:
$1,370
State:
$1,808
Percentage of individuals using paid preparers for their 2004 taxes: 72.3%
Here:
72%
State:
60%
(% for various income ranges: 66.5% for AGIs below $10k, 67.7% for AGIs $10k-25k, 66.0% for AGIs $25k-50k, 71.5% for AGIs $50k-75k, 72.0% for AGIs $75k-100k, 85.1% for AGIs over 100k)
Likely homosexual households (counted as self-reported same-sex unmarried-partner households)
Lesbian couples: 0.1% of all households
Gay men: 0.9% of all households
Household received Food Stamps/SNAP in the past 12 months: 159 Household did not receive Food Stamps/SNAP in the past 12 months: 6,767
Women who had a birth in the past 12 months: 28 (29 now married, 0 unmarried) Women who did not have a birth in the past 12 months: 2,091 (992 now married, 1,099 unmarried)
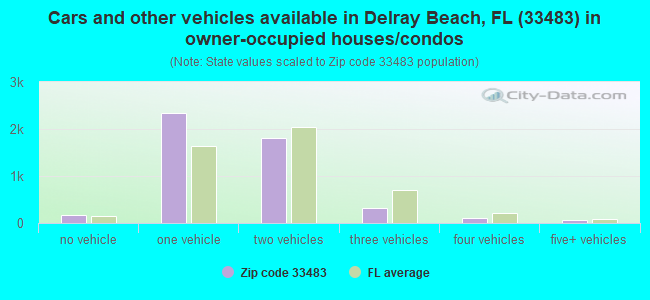
Housing units in zip code 33483 with a mortgage: 2,060 (175 second mortgage, 25 home equity loan, 154 both second mortgage and home equity loan) Houses without a mortgage: 123
Median monthly owner costs for units with a mortgage: $2,993 Median monthly owner costs for units without a mortgage: $1,505
Residents with income below the poverty level in 2022:
This zip code:
8.9%
Whole state:
12.7%
Residents with income below 50% of the poverty level in 2022:
This zip code:
2.9%
Whole state:
6.6%
Median number of rooms in houses and condos:
Here:
5.2
State:
5.9
Median number of rooms in apartments:
Here:
4.0
State:
4.2
Notable locations in this zip code not listed on our city pages
Notable locations in zip code 33483: Old Harbor Plaza (A), Delray Beach Public Library (B), Delray Beach Fire Rescue Station 2 (C), Gulf Stream Police Department (D). Display/hide their locations on the map
600 married couples with children.
122 single-parent households (12 men, 110 women).
86.1% of residents of 33483 zip code speak English at home.
4.0% of residents speak Spanish at home (72% very well, 16% well, 12% not well).
8.7% of residents speak other Indo-European language at home (48% very well, 24% well, 17% not well, 11% not at all).
1.3% of residents speak Asian or Pacific Island language at home (41% very well, 30% well, 25% not well, 3% not at all).
0.3% of residents speak other language at home (100% very well).
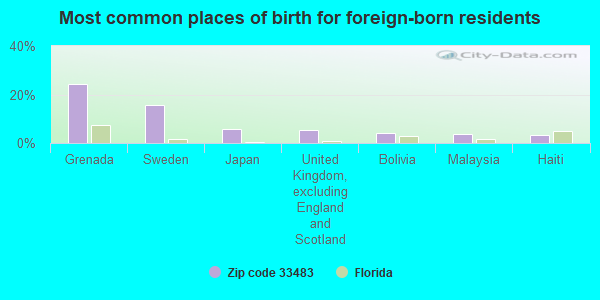
Foreign born population: 2,016 (15.5%) (55.8% of them are naturalized citizens)
This zip code:
15.5%
Whole state:
21.7%
25%Grenada
16%Sweden
6%Japan
5%United Kingdom, excluding England and Scotland
4%Bolivia
4%Malaysia
3%Haiti
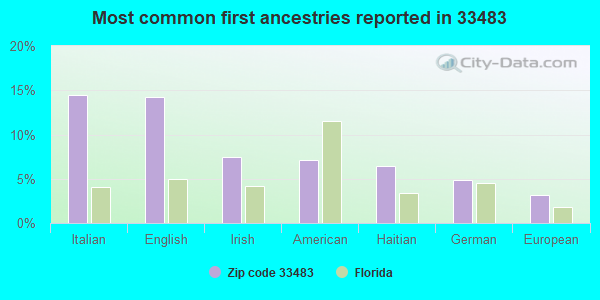
14%Italian
14%English
7%Irish
7%American
6%Haitian
5%German
3%European
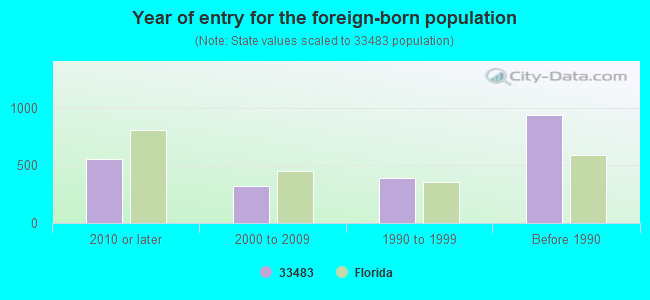
Year of entry for the foreign-born population
5562010 or later
3232000 to 2009
3901990 to 1999
938Before 1990
Major facilities with environmental interests located in this zip code:
PARAGON CLEANERS (1326 NORTH FEDERAL HIGHWAY in DELRAY BEACH, FL)
AIR MINOR (AIRS/AFS) Small Quantity Generators, between 100 kg and 1000 kg of hazardous waste/month (Resource Conservation and Recovery Act (tracking hazardous waste)) - notification Business SIC classification: DRYCLEANING PLANTS, EXCEPT RUG CLEANING Organizations: LAWRENCE WOLK (CONTACT/OWNER)
Alternative names: ALESSI CLEANERS & TAILORS INCORPORATED
DELRAY YOUTH VOCATIONAL CHARTER SCHOOL (2201 N. FEDERAL HIGHWAY in DELRAY BEACH, FL)
(National Center for Education Statistics) - STATE ID-3344 Organizations: PALM BEACH COUNTY SCHOOL DISTRICT (SCHOOL DISTRICT)
OCEANSIDE CLEANERS INC (1006 E ATLANTIC AVE in DELRAY BEACH, FL)
AIR MINOR (AIRS/AFS) (Resource Conservation and Recovery Act (tracking hazardous waste)) Business SIC classification: DRYCLEANING PLANTS, EXCEPT RUG CLEANING Organizations: ART LEGAKIS, OWNER (CONTACT/OWNER)
SAFE & SECURE - DELRAY (2512 NORTH FEDERAL HWY in DELRAY BEACH, FL)
National Pollutant Discharge Elimination System NON-MAJOR (Tracking pollutant discharge elimination systems) - permit Organizations: ANTHONY PUGLIESE (CONTACT/OWNER)
GULFSTREAM CLEANERS OF DELRAY INC (777 E ATLANTIC AVE STE #123 in DELRAY BEACH, FL)
AIR MINOR (AIRS/AFS) Small Quantity Generators, between 100 kg and 1000 kg of hazardous waste/month (Resource Conservation and Recovery Act (tracking hazardous waste)) - notification Business SIC classification: DRYCLEANING PLANTS, EXCEPT RUG CLEANING Organizations: CRADDOCK JEFFREY PART OWNER (CONTACT/OWNER)
DELRAY BAY APARTMENT HOMES (200 LINDELL BLVD in DELRAY BEACH, FL)
National Pollutant Discharge Elimination System NON-MAJOR (Tracking pollutant discharge elimination systems) - permit Organizations: MARK HANSEN (CONTACT/OWNER)
SE 10TH & FEDERAL HIGHWAY OFFI (SE 10TH STREET AND FEDERAL HIG in DELRAY BEACH, FL)
National Pollutant Discharge Elimination System NON-MAJOR (Tracking pollutant discharge elimination systems) - permit Organizations: GRAHAM HUTCHISON (CONTACT/OWNER)
AUTO PALACE INCORPORATED (445 NORTH EAST FEDERAL HIGHWAY in DELRAY BEACH, FL)
(Resource Conservation and Recovery Act (tracking hazardous waste)) Organizations: CALVIN PARIS PARIS MGT (CONTACT/OWNER)
Alternative names: CLASSIC AUTO COLLISION CORP, CLASSIC AUTO COLLISION CORP
SEAGATE RESIDENCES BEACH CLUB (400 S OCEAN BLVD in DELRAY BEACH, FL)
National Pollutant Discharge Elimination System NON-MAJOR (Tracking pollutant discharge elimination systems) - permit Organizations: GARRETT GRANE (CONTACT/OWNER)
AVENUE EAST (NORTH SIDE OF SE 1ST ST B/W FL in DELRAY BEACH, FL)
National Pollutant Discharge Elimination System NON-MAJOR (Tracking pollutant discharge elimination systems) - permit Organizations: PRYSE ELAM (CONTACT/OWNER)
SEAGATE TOWERS CONDOMINIUM ASS (220 MACFARLANE DRIVE in DELRAY BEACH, FL)
National Pollutant Discharge Elimination System NON-MAJOR (Tracking pollutant discharge elimination systems) - permit Business SIC classification: OPERATORS OF APARTMENT BUILDINGS Organizations: ROBERT STORY (CONTACT/OWNER)
Alternative names: SEAGATE TOWERS DELRAY BEACH
GULF STREAM VILLAS ( in DELRAY BEACH, FL)
National Pollutant Discharge Elimination System NON-MAJOR (Tracking pollutant discharge elimination systems) - permit Organizations: STEVEN KELTON (CONTACT/OWNER)
HIGH PERFORMANCE AUTO TECH (3025 N OLD DIXIE HWY in DELRAY BEACH, FL)
(Resource Conservation and Recovery Act (tracking hazardous waste)) Organizations: TOM MAHADY (CONTACT/OWNER)
Housing units lacking complete plumbing facilities: 0.7% Housing units lacking complete kitchen facilities: 0.9%
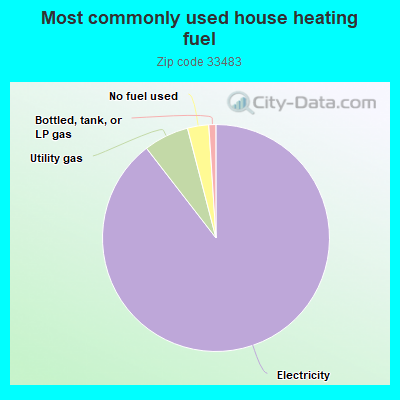
88.9%Electricity
6.4%Utility gas
3.0%No fuel used
1.0%Bottled, tank, or LP gas
Population in 1990: 10,326. Population change in the 1990s: +2,403 (+23.3%).
Place of birth for U.S.-born residents:
This state: 2,106
Northeast: 5,358
Midwest: 1,527
South: 1,423
West: 344
50% of the 33483 zip code residents lived in the same house 5 years ago. Out of people who lived in different houses, 51% lived in this county. Out of people who lived in different counties, 50% lived in Florida.
82% of the 33483 zip code residents lived in the same house 1 year ago. Out of people who lived in different houses, 40% moved from this county. Out of people who lived in different houses, 11% moved from different county within same state. Out of people who lived in different houses, 40% moved from different state. Out of people who lived in different houses, 9% moved from abroad.
Private vs. public school enrollment:
Students in private schools in grades 1 to 8 (elementary and middle school): 113
Here:
34.9%
Florida:
15.8%
Students in private schools in grades 9 to 12 (high school): 143
Here:
41.8%
Florida:
12.9%
Students in private undergraduate colleges: 101
Here:
29.2%
Florida:
23.6%
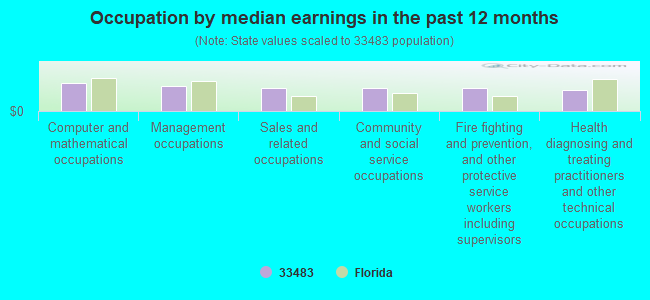
Occupation by median earnings in the past 12 months ($)
132,908Computer and mathematical occupations
116,515Management occupations
108,920Sales and related occupations
108,531Community and social service occupations
106,584Fire fighting and prevention, and other protective service workers including supervisors
100,205Health diagnosing and treating practitioners and other technical occupations
Companies with federal contracts located in this zip code:
SUN VALLEY WORLDWIDE, INC (1801 S FEDERAL HWY #305 in DELRAY BEACH, FL; small business) : $98,882 in 12 contractsfrom 2003 to 2006
Contracts for Boxes, Cartons, and Crates, Construction of Structures and Facilities -- Unimproved Real Property (Land) by Air Force, Army Signed by year:2000: $0; 2001: $0; 2002: $0; 2003: $42,338; 2004: $25,844; 2005: $21,090; 2006: $9,610.
Biggest contracts:
$18,700 with Air Force for Boxes, Cartons, and Crates. Signed on 2003-10-29. Completion date: 2003-11-14.
$10,200 with Army for Boxes, Cartons, and Crates. Taking place in KS. Signed on 2003-08-28. Completion date: 2003-09-02.
$9,900 with Air Force for Construction of Structures and Facilities -- Unimproved Real Property (Land). Taking place in AZ. Signed on 2004-04-01. Completion date: 2005-04-25.
$9,225 with Army for Boxes, Cartons, and Crates. Signed on 2004-01-08. Completion date: 2004-01-16.
TSUNIFORMS COM, INC (1550 N FEDERAL HWY STE 6 in DELRAY BEACH, FL; small business)
$9,501 with Navy for Hospital and Surgical Clothing and Related Special Purpose Items. Signed on 2005-07-01. Completion date: 2005-07-07.
JAMES OWENS (1877 S. OCEAN BLVD STE.L in DELRAY BEACH, FL; small business) : $0 in 2 contractsin 2004
$0 with Department of State for Architect - Engineer Services (including landscaping, interior layout, and designing). Signed on 2004-05-04. Completion date: 2004-05-04.
$0, same as above.Signed on 2004-05-04. Completion date: 2004-05-04.
Top industries in this zip code by the number of employees in 2005:
2002 - 2018 National Fire Incident Reporting System (NFIRS) incidents
According to the data from the years 2002 - 2018 the average number of fire incidents per year is 27. The highest number of fire incidents - 43 took place in 2014, and the least - 13 in 2002. The data has a rising trend.
When looking into fire subcategories, the most reports belonged to: Outside Fires (54.2%), and Mobile Property/Vehicle Fires (18.6%).
Fire incident types reported to NFIRS in Zip Code 33483

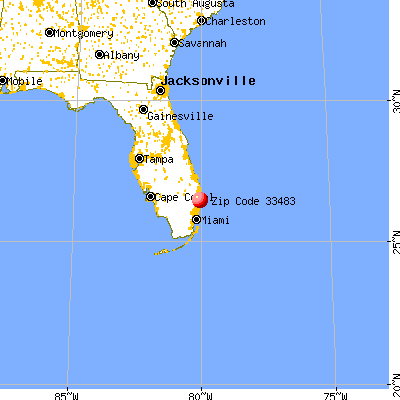


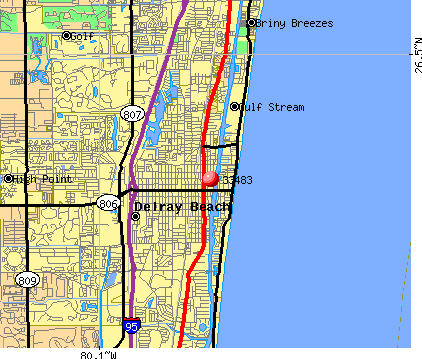 Nearest zip codes: 33444, 33445, 33487, 33435, 33484, 33426.


 According to the data from the years 2002 - 2018 the average number of fire incidents per year is 27. The highest number of fire incidents - 43 took place in 2014, and the least - 13 in 2002. The data has a rising trend.
 When looking into fire subcategories, the most reports belonged to: Outside Fires (54.2%), and Mobile Property/Vehicle Fires (18.6%).