Estimated zip code population in 2022: 22,110 Zip code population in 2010: 16,421 Zip code population in 2000: 16,206
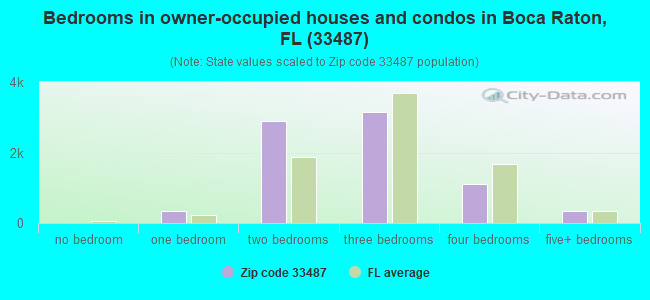
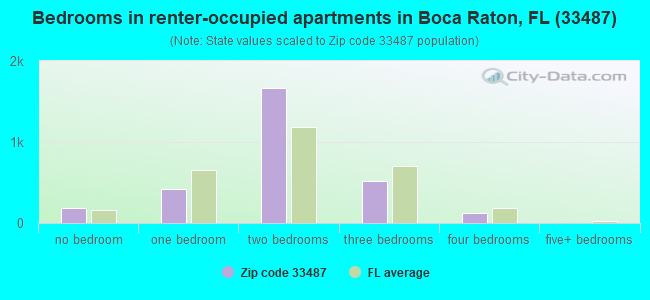
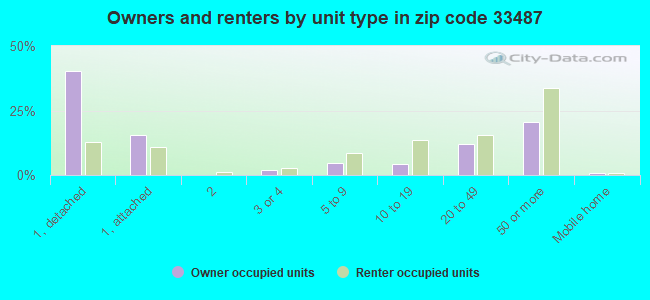
Houses and condos: 14,063 Renter-occupied apartments: 2,904
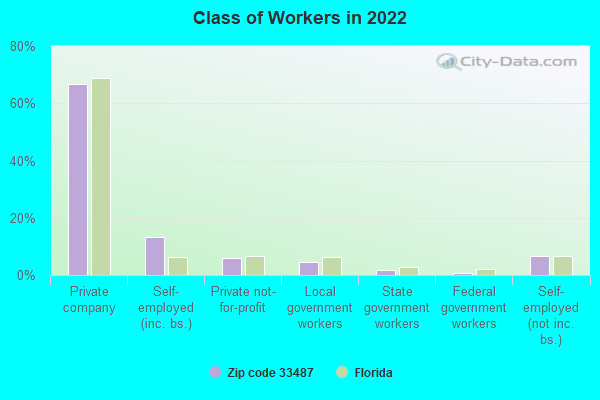
% of renters here:
27%
State:
33%
March 2022 cost of living index in zip code 33487: 103.8 (near average, U.S. average is 100)
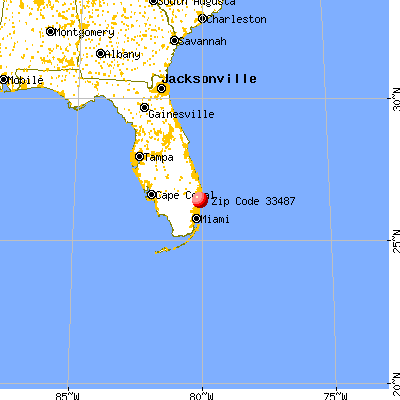
Land area: 6.5 sq. mi. Water area: 0.8 sq. mi.
Population density: 3,378 people per square mile
(average).
OSM Map
General Map
Google Map
MSN Map
OSM Map
General Map
Google Map
MSN Map
OSM Map
General Map
Google Map
MSN Map
OSM Map
General Map
Google Map
MSN Map
Please wait while loading the map...
Real estate property taxes paid for housing units in 2022:
This zip code:
0.8% ($4,977)
Florida:
0.7% ($2,529)
Median real estate property taxes paid for housing units with mortgages in 2022: $5,079 (0.8%) Median real estate property taxes paid for housing units with no mortgage in 2022: $4,859 (0.8%)
Estimated median house/condo value in 2022: $630,763
33487:
$630,763
Florida:
$354,100
According to our research of Florida and other state lists, there were 5 registered sex offenders living in 33487 zip code as of April 25, 2024. The ratio of all residents to sex offenders in zip code 33487 is 3,720 to 1. The ratio of registered sex offenders to all residents in this zip code is much lower than the state average.
Median resident age:
This zip code:
54.4 years
Florida median age:
42.7 years
Average household size:
This zip code:
2.1 people
Florida:
2.5 people
Averages for the 2020 tax year for zip code 33487, filed in 2021:
Average Adjusted Gross Income (AGI) in 2020: $216,974 (Individual Income Tax Returns)
Here:
$216,974
State:
$82,200
Salary/wage: $110,124 (reported on 66.9% of returns)
Here:
$110,124
State:
$58,347
(% of AGI for various income ranges: 1209.9% for AGIs below $25k, 3670.6% for AGIs $25k-50k, 7021.9% for AGIs $50k-75k, 10357.6% for AGIs $75k-100k, 18534.4% for AGIs $100k-200k, 111946.4% for AGIs over 200k)
Taxable interest for individuals: $13,388 (reported on 46.7% of returns)
This zip code:
$13,388
Florida:
$4,272
(% of AGI for various income ranges: 58.2% for AGIs below $25k, 108.5% for AGIs $25k-50k, 208.6% for AGIs $50k-75k, 293.0% for AGIs $75k-100k, 802.9% for AGIs $100k-200k, 13002.4% for AGIs over 200k)
Ordinary dividends: $38,841 (reported on 44.3% of returns)
Here:
$38,841
State:
$15,863
(% of AGI for various income ranges: 139.4% for AGIs below $25k, 307.7% for AGIs $25k-50k, 479.6% for AGIs $50k-75k, 941.3% for AGIs $75k-100k, 2069.5% for AGIs $100k-200k, 36163.6% for AGIs over 200k)
Net capital gain/loss in AGI: +$112,801 (reported on 44.9% of returns)
Here:
+$112,801
State:
+$62,983
(% of AGI for various income ranges: 53.6% for AGIs below $25k, 161.0% for AGIs $25k-50k, 344.7% for AGIs $50k-75k, 714.8% for AGIs $75k-100k, 2198.9% for AGIs $100k-200k, 121282.4% for AGIs over 200k)
Profit/loss from business: +$12,783 (reported on 24.9% of returns)
Here:
+$12,783
State:
+$9,719
(% of AGI for various income ranges: 298.5% for AGIs below $25k, 389.9% for AGIs $25k-50k, 460.4% for AGIs $50k-75k, 698.3% for AGIs $75k-100k, 1505.0% for AGIs $100k-200k, 1414.5% for AGIs over 200k)
Taxable individual retirement arrangement distribution: $42,983 (reported on 14.3% of returns)
33487:
$42,983
Florida:
$24,823
(% of AGI for various income ranges: 102.5% for AGIs below $25k, 222.7% for AGIs $25k-50k, 401.1% for AGIs $50k-75k, 966.5% for AGIs $75k-100k, 1917.1% for AGIs $100k-200k, 9004.5% for AGIs over 200k)
Self-employed (Keogh) retirement plans: $26,327 (reported on 1.4% of returns)
33487:
$26,327
Florida:
$29,694
(% of AGI for various income ranges: 18.8% for AGIs $25k-50k, 95.1% for AGIs $100k-200k, 706.2% for AGIs over 200k)
Total itemized deductions: $57,936 (reported on 18.5% of returns)
Here:
$57,936
State:
$45,393
(% of AGI for various income ranges: 237.9% for AGIs below $25k, 373.1% for AGIs $25k-50k, 667.2% for AGIs $50k-75k, 1209.8% for AGIs $75k-100k, 2143.2% for AGIs $100k-200k, 18537.1% for AGIs over 200k)
Charity contributions: $22,804 (reported on 15.6% of returns)
Here:
$22,804
State:
$20,178
(% of AGI for various income ranges: 8.1% for AGIs below $25k, 40.4% for AGIs $25k-50k, 70.9% for AGIs $50k-75k, 160.4% for AGIs $75k-100k, 344.0% for AGIs $100k-200k, 7853.6% for AGIs over 200k)
Taxes paid: $8,020 (reported on 18.3% of returns)
33487:
$8,020
State:
$6,967
(% of AGI for various income ranges: 40.1% for AGIs below $25k, 76.1% for AGIs $25k-50k, 139.6% for AGIs $50k-75k, 253.7% for AGIs $75k-100k, 455.4% for AGIs $100k-200k, 1951.4% for AGIs over 200k)
Earned income credit: $1,710 (reported on 8.7% of returns)
Here:
$1,710
State:
$2,306
(% of AGI for various income ranges: 72.1% for AGIs below $25k, 44.8% for AGIs $25k-50k)
Percentage of individuals using paid preparers for their 2020 taxes: 91.9%
Here:
92%
State:
92%
(% for various income ranges: 90.9% for AGIs below $25k, 91.9% for AGIs $25k-50k, 92.4% for AGIs $50k-75k, 91.6% for AGIs $75k-100k, 92.1% for AGIs $100k-200k, 92.7% for AGIs over 200k)
Averages for the 2012 tax year for zip code 33487, filed in 2013:
Average Adjusted Gross Income (AGI) in 2012: $166,568 (Individual Income Tax Returns)
Here:
$166,568
State:
$60,316
Salary/wage: $88,199 (reported on 66.5% of returns)
Here:
$88,199
State:
$45,277
(% of AGI for various income ranges: 62.7% for AGIs below $25k, 66.0% for AGIs $25k-50k, 58.0% for AGIs $50k-75k, 51.2% for AGIs $75k-100k, 53.6% for AGIs $100k-200k, 26.6% for AGIs over 200k)
Taxable interest for individuals: $9,375 (reported on 50.1% of returns)
This zip code:
$9,375
Florida:
$3,587
(% of AGI for various income ranges: 4.3% for AGIs below $25k, 2.6% for AGIs $25k-50k, 2.7% for AGIs $50k-75k, 2.6% for AGIs $75k-100k, 2.9% for AGIs $100k-200k, 2.8% for AGIs over 200k)
Ordinary dividends: $37,460 (reported on 42.3% of returns)
Here:
$37,460
State:
$12,831
(% of AGI for various income ranges: 7.6% for AGIs below $25k, 4.8% for AGIs $25k-50k, 5.7% for AGIs $50k-75k, 6.5% for AGIs $75k-100k, 7.2% for AGIs $100k-200k, 10.7% for AGIs over 200k)
Net capital gain/loss in AGI: +$90,357 (reported on 41.4% of returns)
Here:
+$90,357
State:
+$33,493
(% of AGI for various income ranges: 0.2% for AGIs $25k-50k, 0.6% for AGIs $50k-75k, 2.2% for AGIs $75k-100k, 3.2% for AGIs $100k-200k, 30.9% for AGIs over 200k)
Profit/loss from business: +$19,040 (reported on 20.9% of returns)
Here:
+$19,040
State:
+$10,012
(% of AGI for various income ranges: 11.7% for AGIs below $25k, 4.6% for AGIs $25k-50k, 4.5% for AGIs $50k-75k, 4.4% for AGIs $75k-100k, 3.5% for AGIs $100k-200k, 1.5% for AGIs over 200k)
Taxable individual retirement arrangement distribution: $42,110 (reported on 20.1% of returns)
33487:
$42,110
Florida:
$21,544
(% of AGI for various income ranges: 6.9% for AGIs below $25k, 4.6% for AGIs $25k-50k, 6.0% for AGIs $50k-75k, 8.1% for AGIs $75k-100k, 8.1% for AGIs $100k-200k, 4.2% for AGIs over 200k)
Self-employment retirement plans: $34,578 (reported on 1.0% of returns)
33487:
$34,578
Florida:
$20,611
(% of AGI for various income ranges: 0.5% for AGIs below $25k, 0.4% for AGIs $100k-200k, 0.2% for AGIs over 200k)
Total itemized deductions: $41,868 (14% of AGI, reported on 46.0% of returns)
Here:
$41,868
State:
$25,533
Here:
13.6% of AGI
State:
18.0% of AGI
(% of AGI for various income ranges: 25.4% for AGIs below $25k, 17.9% for AGIs $25k-50k, 16.1% for AGIs $50k-75k, 17.7% for AGIs $75k-100k, 15.9% for AGIs $100k-200k, 9.3% for AGIs over 200k)
Charity contributions: $9,237 (reported on 39.3% of returns)
Here:
$9,237
State:
$5,698
(% of AGI for various income ranges: 1.4% for AGIs below $25k, 1.5% for AGIs $25k-50k, 1.8% for AGIs $50k-75k, 1.9% for AGIs $75k-100k, 2.1% for AGIs $100k-200k, 2.3% for AGIs over 200k)
Taxes paid: $14,761 (reported on 45.6% of returns)
33487:
$14,761
State:
$6,203
(% of AGI for various income ranges: 6.3% for AGIs below $25k, 4.2% for AGIs $25k-50k, 4.3% for AGIs $50k-75k, 4.8% for AGIs $75k-100k, 5.2% for AGIs $100k-200k, 3.7% for AGIs over 200k)
Earned income credit: $1,847 (reported on 8.9% of returns)
Here:
$1,847
State:
$2,372
(% of AGI for various income ranges: 3.4% for AGIs below $25k, 0.6% for AGIs $25k-50k)
Percentage of individuals using paid preparers for their 2012 taxes: 68.6%
Here:
69%
State:
54%
(% for various income ranges: 62.8% for AGIs below $25k, 64.2% for AGIs $25k-50k, 69.0% for AGIs $50k-75k, 66.3% for AGIs $75k-100k, 71.2% for AGIs $100k-200k, 87.6% for AGIs over 200k)
Averages for the 2004 tax year for zip code 33487, filed in 2005:
Average Adjusted Gross Income (AGI) in 2004: $128,630 (Individual Income Tax Returns)
Here:
$128,630
State:
$50,523
Salary/wage: $68,957 (reported on 63.4% of returns)
Here:
$68,957
State:
$39,563
(% of AGI for various income ranges: 61.0% for AGIs $10k-25k, 62.4% for AGIs $25k-50k, 52.8% for AGIs $50k-75k, 50.9% for AGIs $75k-100k, 26.2% for AGIs over 100k)
Taxable interest for individuals: $10,525 (reported on 66.1% of returns)
This zip code:
$10,525
Florida:
$3,211
(% of AGI for various income ranges: 8.0% for AGIs $10k-25k, 5.8% for AGIs $25k-50k, 6.0% for AGIs $50k-75k, 5.9% for AGIs $75k-100k, 4.7% for AGIs over 100k)
Taxable dividends: $14,857 (reported on 53.5% of returns)
Here:
$14,857
State:
$6,129
(% of AGI for various income ranges: 7.8% for AGIs $10k-25k, 5.9% for AGIs $25k-50k, 6.2% for AGIs $50k-75k, 7.3% for AGIs $75k-100k, 5.6% for AGIs over 100k)
Net capital gain/loss: +$86,851 (reported on 52.3% of returns)
Here:
+$86,851
State:
+$27,205
(% of AGI for various income ranges: -0.8% for AGIs $10k-25k, 1.2% for AGIs $25k-50k, 2.3% for AGIs $50k-75k, 4.2% for AGIs $75k-100k, 41.5% for AGIs over 100k)
Profit/loss from business: +$16,369 (reported on 19.0% of returns)
Here:
+$16,369
State:
+$10,634
(% of AGI for various income ranges: 8.6% for AGIs $10k-25k, 4.4% for AGIs $25k-50k, 4.2% for AGIs $50k-75k, 3.8% for AGIs $75k-100k, 1.8% for AGIs over 100k)
IRA payment deduction: $3,683 (reported on 4.4% of returns)
33487:
$3,683
Florida:
$3,082
(% of AGI for various income ranges: 0.6% for AGIs $10k-25k, 0.4% for AGIs $25k-50k, 0.3% for AGIs $50k-75k, 0.3% for AGIs $75k-100k, 0.1% for AGIs over 100k)
Self-employed pension: $23,057 (reported on 1.5% of returns)
Here:
$23,057
Florida:
$15,857
(% of AGI for various income ranges: 0.5% for AGIs $10k-25k, 0.1% for AGIs $50k-75k, 0.3% for AGIs $75k-100k, 0.3% for AGIs over 100k)
Total itemized deductions: $28,622 (14% of AGI, reported on 54.6% of returns)
Here:
$28,622
State:
$20,370
Here:
13.9% of AGI
State:
20.7% of AGI
(% of AGI for various income ranges: 33.3% for AGIs $10k-25k, 24.6% for AGIs $25k-50k, 22.2% for AGIs $50k-75k, 20.4% for AGIs $75k-100k, 8.5% for AGIs over 100k)
Charity contributions deductions: $5,663 (3% of AGI, reported on 48.7% of returns)
Here:
$5,663
State:
$4,064
Here:
2.8% of AGI
State:
3.8% of AGI
(% of AGI for various income ranges: 2.1% for AGIs $10k-25k, 2.3% for AGIs $25k-50k, 2.5% for AGIs $50k-75k, 2.7% for AGIs $75k-100k, 2.0% for AGIs over 100k)
Total tax: $31,321 (reported on 80.1% of returns)
33487:
$31,321
State:
$9,431
(% of AGI for various income ranges: 4.5% for AGIs $10k-25k, 7.4% for AGIs $25k-50k, 10.1% for AGIs $50k-75k, 11.2% for AGIs $75k-100k, 21.2% for AGIs over 100k)
Earned income credit: $1,328 (reported on 6.3% of returns)
Here:
$1,328
State:
$1,808
Percentage of individuals using paid preparers for their 2004 taxes: 71.7%
Here:
72%
State:
60%
(% for various income ranges: 67.0% for AGIs below $10k, 71.4% for AGIs $10k-25k, 67.5% for AGIs $25k-50k, 71.5% for AGIs $50k-75k, 69.3% for AGIs $75k-100k, 79.9% for AGIs over 100k)
Household received Food Stamps/SNAP in the past 12 months: 326 Household did not receive Food Stamps/SNAP in the past 12 months: 10,488
Women who had a birth in the past 12 months: 105 (98 now married, 10 unmarried) Women who did not have a birth in the past 12 months: 4,034 (1,375 now married, 2,657 unmarried)
Housing units in zip code 33487 with a mortgage: 3,816 (469 second mortgage, 407 both second mortgage and home equity loan) Houses without a mortgage: 130
Median monthly owner costs for units with a mortgage: $2,715 Median monthly owner costs for units without a mortgage: $1,094
Residents with income below the poverty level in 2022:
This zip code:
8.2%
Whole state:
12.7%
Residents with income below 50% of the poverty level in 2022:
This zip code:
2.9%
Whole state:
6.6%
Median number of rooms in houses and condos:
Here:
5.3
State:
5.9
Median number of rooms in apartments:
Here:
3.9
State:
4.2
Notable locations in this zip code not listed on our city pages
Notable locations in zip code 33487: Hidden Valley Country Club (A), Villa Rica Railroad Station (B), Golden Ocala Golf Course (C), Bears Paw Country Club (D), Christopher Center (E), Colony Shoppes (F), Boca Raton Fire and Rescue Station 4 (G), Delray Beach Fire Rescue Station 6 (H), Palm Beach County Fire Rescue Station 52 (I), Highland Beach Police Department (J), Chabad Lubavitch Community Center (K). Display/hide their locations on the map
1,759 married couples with children.
1,011 single-parent households (400 men, 611 women).
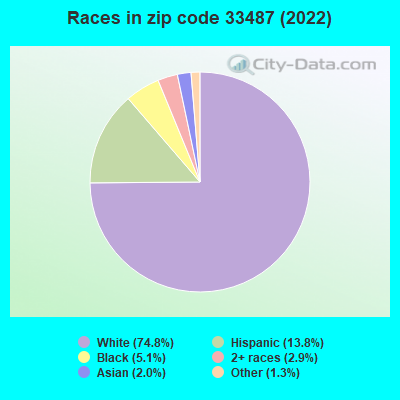
75.5% of residents of 33487 zip code speak English at home.
10.9% of residents speak Spanish at home (72% very well, 18% well, 7% not well, 3% not at all).
10.4% of residents speak other Indo-European language at home (77% very well, 17% well, 4% not well, 2% not at all).
1.7% of residents speak Asian or Pacific Island language at home (46% very well, 40% well, 15% not well).
1.7% of residents speak other language at home (74% very well, 18% well, 2% not well, 6% not at all).
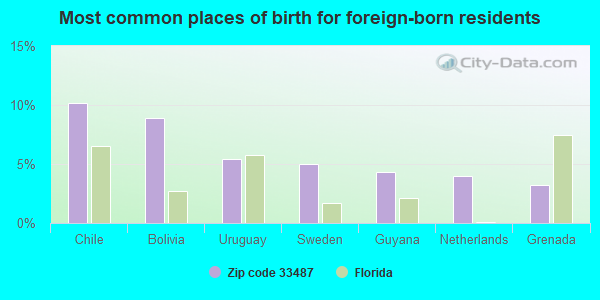
Foreign born population: 4,701 (21.3%) (73.1% of them are naturalized citizens)
Major facilities with environmental interests located in this zip code:
AMERICAN BOARTS CRUSHING COMPANY INCORPORATED (6650 PARK OF COMMERCE BOULEVARD in BOCA RATON, FL)
ENFORCEMENT/COMPLIANCE ACTIVITY (Integrated Compliance Information System) - ICIS-04-2002-9976, FORMAL ENFORCEMENT ACTION (Integrated Compliance Information System) - ICIS-04-2002-9976, FORMAL ENFORCEMENT ACTION Small Quantity Generators, between 100 kg and 1000 kg of hazardous waste/month (Resource Conservation and Recovery Act (tracking hazardous waste)) - notification TRI REPORTER (Tracking of toxic chemicals releasing facilities) Business SIC classification: ABRASIVE PRODUCTS Organizations: JON KIMMEL, MFG (CONTACT/OWNER)
Alternative names: ABC SUPERABRASIVES, AMERICAN BOARTS CO. INC.
SIEMENS INFORMATION SYSTEMS INCORPORATED (5500 BROKEN SOUND BOULEVARD in BOCA RATON, FL)
(Resource Conservation and Recovery Act (tracking hazardous waste)) TRI REPORTER (Tracking of toxic chemicals releasing facilities) Organizations: R JACKSON, P E MGR FAC (CONTACT/OWNER)
Alternative names: SIEMENS PUBLIC SWITCHING, SYS. INC.
CUSTOM MARBLE INC (1160 S ROGERS CIRCLE #A in BOCA RATON, FL)
AIR MINOR (AIRS/AFS) Small Quantity Generators, between 100 kg and 1000 kg of hazardous waste/month (Resource Conservation and Recovery Act (tracking hazardous waste)) - notification TRI REPORTER (Tracking of toxic chemicals releasing facilities) Business SIC classification: CUSTOM COMPOUNDING OF PURCHASED PLASTICS RESINS; PLASTICS PLUMBING FIXTURES Business NAICS classification: CUT STONE AND STONE PRODUCT MANUFACTURING. Organizations: EDWARD GOLD (CONTACT/OWNER)
IMPRESSIONS DRY CLEANERS INC (6201 N FEDERAL HWY in BOCA RATON, FL)
AIR MINOR (AIRS/AFS) Small Quantity Generators, between 100 kg and 1000 kg of hazardous waste/month (Resource Conservation and Recovery Act (tracking hazardous waste)) Business SIC classification: DRYCLEANING PLANTS, EXCEPT RUG CLEANING Organizations: PETER C AVERILL (CONTACT/OWNER)
NORTH AMERICAN BIOLOGICALS INCORPORATED (5800 PARK OF COMMERCE BOULEVARD in BOCA RATON, FL)
CRITERIA AND HAZARDOUS AIR POLLUTANT INVENTORY (Inventory of air pollution sources) Large Quantity Generators, more that 1000 kg of hazardous waste/month (Resource Conservation and Recovery Act (tracking hazardous waste)) Business SIC classification: BIOLOGICAL PRODUCTS, EXCEPT DIAGNOSTIC SUBSTANCES Business NAICS classification: PHARMACEUTICAL PREPARATION MANUFACTURING.; BIOLOGICAL PRODUCT (EXCEPT DIAGNOSTIC) MANUFACTURING. Organizations: NABI BIOPHARMACEUTICALS (CONTACT/OWNER)
Alternative names: NORTH AMERICAN BIOLOGICAL INC
CONGRESS AVE (YAMATO RD TO LINTON BLVD in BOCA RATON, FL)
National Pollutant Discharge Elimination System NON-MAJOR (Tracking pollutant discharge elimination systems) - permit Organizations: OMELIO A FERNANDEZ (CONTACT/OWNER)
Alternative names: PALM BEACH COUNTY BOARD OF COU
COSTCO WHOLESALE #345 (17800 CONGRESS AVE in BOCA RATON, FL)
National Pollutant Discharge Elimination System NON-MAJOR (Tracking pollutant discharge elimination systems) - permit Small Quantity Generators, between 100 kg and 1000 kg of hazardous waste/month (Resource Conservation and Recovery Act (tracking hazardous waste)) - notification Organizations: COSTCO WHOLESALE CORPORATION (CONTACT/OWNER)
AMITEK CORP (1701 CLINT MOORE RD in BOCA RATON, FL)
(Resource Conservation and Recovery Act (tracking hazardous waste)) Organizations: RON RIDLON, PROCESS ENG (CONTACT/OWNER)
HP FURNITURE REFINISHING INC (5301 N DIXIE HWY in BOCA RATON, FL)
NATIONAL COUNCIL ON COMP INSURANCE (750 PARK OF COMMERCE DRIVE in BOCA RATON, FL)
(Resource Conservation and Recovery Act (tracking hazardous waste)) Organizations: MICHAEL SPYRA, RISK ADMIN (CONTACT/OWNER)
NEXSTORE PARKING EXPANSION (8081 CONGRESS AVE in BOCA RATON, FL)
National Pollutant Discharge Elimination System NON-MAJOR (Tracking pollutant discharge elimination systems) - permit Organizations: WILLIAM KNIGHT (CONTACT/OWNER)
POWER SPORTS OF BOCA RATON (7750 N FEDERAL HWY in BOCA RATON, FL)
(Resource Conservation and Recovery Act (tracking hazardous waste)) Business NAICS classification: MOTORCYCLE DEALERS. Organizations: POWER SPORTS, INC (CONTACT/OWNER)
PRODUCT INGREDIENT TECHNOLOGY (1160 CLINT MOORE RD in BOCA RATON, FL)
(Resource Conservation and Recovery Act (tracking hazardous waste)) Organizations: LOUIS CHAMPON PRESIDENT (CONTACT/OWNER)
Housing units lacking complete plumbing facilities: 0.7% Housing units lacking complete kitchen facilities: 0.7%
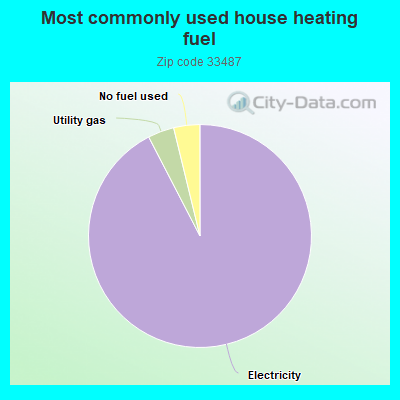
92.5%Electricity
3.8%Utility gas
3.8%No fuel used
Population in 1990: 14,606. Population change in the 1990s: +1,600 (+11.0%).
Place of birth for U.S.-born residents:
This state: 5,062
Northeast: 7,188
Midwest: 2,764
South: 1,488
West: 565
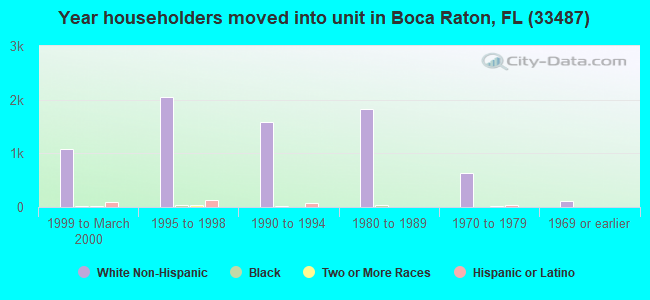
59% of the 33487 zip code residents lived in the same house 5 years ago. Out of people who lived in different houses, 48% lived in this county. Out of people who lived in different counties, 50% lived in Florida.
85% of the 33487 zip code residents lived in the same house 1 year ago. Out of people who lived in different houses, 32% moved from this county. Out of people who lived in different houses, 19% moved from different county within same state. Out of people who lived in different houses, 43% moved from different state. Out of people who lived in different houses, 9% moved from abroad.
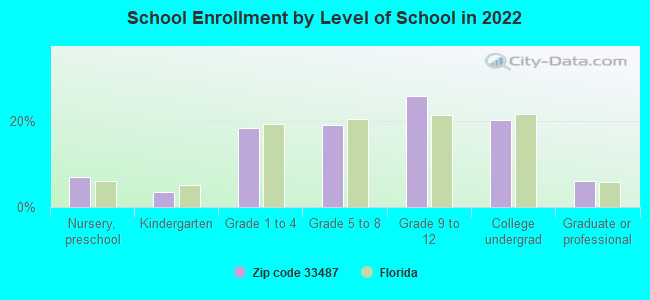
Private vs. public school enrollment:
Students in private schools in grades 1 to 8 (elementary and middle school): 440
Here:
30.5%
Florida:
15.8%
Students in private schools in grades 9 to 12 (high school): 131
Here:
13.3%
Florida:
12.9%
Students in private undergraduate colleges: 139
Here:
18.1%
Florida:
23.6%
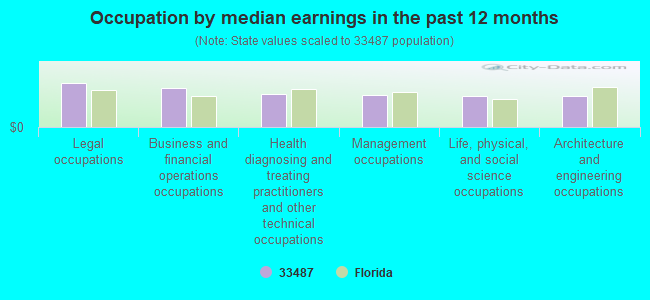
Occupation by median earnings in the past 12 months ($)
121,992Legal occupations
108,720Business and financial operations occupations
90,621Health diagnosing and treating practitioners and other technical occupations
87,787Management occupations
85,032Life, physical, and social science occupations
84,832Architecture and engineering occupations
Companies with biggest federal contracts located in this zip code (BOCA RATON, FL):
VOLVO AERO SERVICE CORP (645 PARK OF COMMERCE WAY) : $40,983,893 in 37 contractsfrom 1999 to 2006
Contracts for Defense Aircraft -- Basic Research (R&D), Maintenance, Repair and Rebuilding of Equipment -- Aircraft and Airframe Structural Components, Aircraft Air Conditioning, Heating, and Pressurizing Equipment, Miscellaneous Aircraft Accessories and Components, and moreby Army, Navy, Air Force Signed by year:2000: $26,148,798; 2001: -$349,476; 2002: $0; 2003: -$633,684; 2004: $1,000; 2005: $589,197; 2006: $3,300.
Biggest contracts:
$14,866,000 with Army for Defense Aircraft -- Basic Research (R&D). Signed on 2000-02-14. Completion date: 2000-09-30.
$10,500,000, same as above.Signed on 2000-04-27. Completion date: 2000-09-30.
$6,949,756, same as above.Signed on 1999-12-08. Completion date: 2000-09-30.
$5,959,900, same as above.Signed on 2000-01-25. Completion date: 2000-09-30.
REAL TIME LABORATORIES, LLC (990 S ROGERS CIR STE 5) : $21,981,261 in 108 contractsfrom 2000 to 2006
Contracts for Guns, over 150 mm through 200 mm, Valves, Nonpowered, Power and Hand Pumps, Miscellaneous Fire Control Equipment, and moreby Army, Air Force, Defense Logistics Agency, Navy, and others Signed by year:2000: $339,244; 2001: $1,722,068; 2002: $3,903,213; 2003: $2,653,253; 2004: $2,710,826; 2005: $9,526,648; 2006: $1,126,009.
Biggest contracts:
$1,822,266 with Army for Guns, over 150 mm through 200 mm. Signed on 2005-12-29. Completion date: 2025-03-08.
$937,131 with Army for Valves, Nonpowered. Signed on 2005-09-15. Completion date: 2006-10-31.
$926,100, same as above.Signed on 2002-03-26. Completion date: 2002-08-26.
$922,975 with Army for Power and Hand Pumps. Signed on 2004-07-01. Completion date: 2005-04-30.
A D T, INC (1750 CLINT MOORE RD) : $4,589,532 in 149 contractsfrom 1999 to 2006
Contracts for Installation of Equipment -- Alarm, Signal, and Security Detection Systems, Surveillance Services, Maintenance, Repair and Rebuilding of Equipment -- Alarm, Signal, and Security Detection Systems, ADPE System Configuration, and moreby Army Signed by year:2000: $1,436,267; 2001: $834,772; 2002: $684,624; 2003: $794,173; 2004: $771,291; 2005: $21,725; 2006: -$3,481.
Biggest contracts:
$592,769 with Army for Installation of Equipment -- Alarm, Signal, and Security Detection Systems. Taking place in MD. Signed on 2000-02-03. Completion date: 2000-09-30.
$221,011, same as above.Signed on 2000-05-19. Completion date: 2000-09-30.
$203,189 with Army for Installation of Equipment -- Alarm, Signal, and Security Detection Systems. Taking place in VA. Signed on 2003-04-08. Completion date: 2004-09-30.
$197,271 with Army for Installation of Equipment -- Alarm, Signal, and Security Detection Systems. Taking place in MD. Signed on 2002-02-21. Completion date: 2002-09-30.
RELLI TECHNOLOGY INC (1200 S ROGERS CIR; small business) : $2,413,048 in 155 contractsfrom 1999 to 2006
Contracts for Hose, Pipe, Tube, Lubrication, and Railing Fittings, Vehicular Power Transmission Components, Valves, Powered, Vehicular Furniture and Accessories, and moreby Defense Logistics Agency, Army, Navy Signed by year:2000: $381,383; 2001: $0; 2002: $0; 2003: $3,170; 2004: $373,949; 2005: $989,733; 2006: $566,741.
Biggest contracts:
$196,134 with Defense Logistics Agency for Hose, Pipe, Tube, Lubrication, and Railing Fittings. Signed on 2005-07-08. Completion date: 2005-08-12.
$92,101 with Defense Logistics Agency for Vehicular Power Transmission Components. Signed on 2005-04-03. Completion date: 2005-08-01.
$86,602 with Defense Logistics Agency for Valves, Powered. Signed on 2006-02-13. Completion date: 2006-09-01.
$83,159 with Defense Logistics Agency for Vehicular Furniture and Accessories. Signed on 2006-04-20. Completion date: 2006-06-19.
RELLI TECHNOLOGY INC (1200A SO ROGERS CIRCLE; small business) : $2,201,928 in 226 contractsfrom 2001 to 2006
Contracts for Miscellaneous Engines and Components, Office Devices and Accessories, Miscellaneous Items, Engine Fuel System Components, Nonaircraft, and moreby Army Signed by year:2000: $0; 2001: $134,823; 2002: $396,017; 2003: $13,790; 2004: $410,710; 2005: $1,019,433; 2006: $227,155.
Biggest contracts:
$85,009 with Army for Miscellaneous Engines and Components. Signed on 2002-07-31. Completion date: 2003-05-21.
$83,472 with Army for Office Devices and Accessories. Signed on 2005-04-25. Completion date: 2005-12-19.
$83,079 with Army for Miscellaneous Items. Signed on 2002-03-04. Completion date: 2002-10-14.
$55,500 with Army for Engine Fuel System Components, Nonaircraft. Signed on 2005-10-14. Completion date: 2006-05-12.
REAL TIME LABORATORIES LC (INC (990 S ROGERS CIR; small business) : $1,511,901 in 12 contractsfrom 2000 to 2005
Contracts for Valves, Powered, Power and Hand Pumps, Electrical and Electronic Properties Measuring and Testing Instruments, Hose, Pipe, Tube, Lubrication, and Railing Fittings, and moreby Army, Air Force, Navy, Defense Logistics Agency, and others Signed by year:2000: $158,568; 2001: $609,628; 2002: $97,885; 2003: $157,630; 2004: $506,788; 2005: -$18,598; 2006: $0.
Biggest contracts:
$437,270 with Army for Valves, Powered. Signed on 2004-04-08. Completion date: 2004-11-30.
$313,950 with Air Force for Power and Hand Pumps. Signed on 2001-01-09. Completion date: 2001-08-31.
$157,630 with Army for Power and Hand Pumps. Signed on 2003-11-19. Completion date: 2004-10-16.
$150,500, same as above.Signed on 2001-11-13. Completion date: 2001-05-31.
KEMP/REAL-TIME LABORATORIES (990 S ROGERS CR, #5) : $1,366,096 in 9 contractsfrom 1999 to 2006
Contracts for Guns, over 150 mm through 200 mm, Assemblies Interchangeable Between Weapons in Two or More Classes, Aircraft Hydraulic, Vacuum, and De-icing System Components, Miscellaneous Aircraft Accessories and Components, and moreby Army, Defense Logistics Agency, Air Force Signed by year:2000: $565,170; 2001: $0; 2002: $0; 2003: $0; 2004: $14,567; 2005: $0; 2006: $13,511.
Biggest contracts:
$769,281 with Army for Guns, over 150 mm through 200 mm. Taking place in NJ. Signed on 1999-10-12. Completion date: 2000-04-30.
$668,940 with Army for Guns, over 150 mm through 200 mm. Signed on 2000-09-20. Completion date: 2001-07-30.
$66,150 with Defense Logistics Agency for Assemblies Interchangeable Between Weapons in Two or More Classes. Taking place in NJ. Signed on 1999-12-20. Completion date: 2000-06-17.
$37,758, same as above.Signed on 1999-10-15. Completion date: 2000-04-12.
CORE INC (6590 W ROGERS CIR STE 1; small business) : $887,490 in 67 contractsfrom 2000 to 2006
Contracts for Generators and Generators Sets, Electrical, Converters, Electrical, Nonrotating, Maintenance, Repair and Rebuilding of Equipment -- Engines, Turbines, and Components, Microcircuits, Electronic, and moreby Defense Logistics Agency, Air Force, United States Coast Guard (disused code: now 7008) Signed by year:2000: $109,611; 2001: $47,000; 2002: $0; 2003: $0; 2004: $215,990; 2005: $444,404; 2006: $70,485.
Biggest contracts:
$113,400 with Defense Logistics Agency for Generators and Generators Sets, Electrical. Signed on 2005-10-27. Completion date: 2006-05-16.
$109,611 with Air Force for Converters, Electrical, Nonrotating. Signed on 2000-12-29. Completion date: 2001-08-31.
$47,000 with United States Coast Guard (disused code: now 7008) for Maintenance, Repair and Rebuilding of Equipment -- Engines, Turbines, and Components. Signed on 2001-09-15. Completion date: 2001-11-15.
$36,348 with Defense Logistics Agency for Microcircuits, Electronic. Signed on 2004-12-09. Completion date: 2005-05-18.
NSW SUBMARINE CABLE SYSTEMS IN (6001 BROKEN SOUND PKWY NW) : $838,104 in 3 contractsfrom 2002 to 2004
$482,880 with Navy for Fiber Optic Cables. Signed on 2002-09-19. Completion date: 2002-12-13.
$276,200 with Navy for Fiber Optic Conductors. Taking place in VA. Signed on 2003-09-30. Completion date: 2004-07-30.
$79,024 with Navy for Fiber Optic Cables. Signed on 2004-07-21. Completion date: 2004-07-22.
SCRIPTLOGIC CORP (6000 BROKEN SOUND PARKWAY; small business) : $307,339 in 30 contractsfrom 2003 to 2006
Contracts for ADP Software, ADP Support Equipment, , Transcription Services, and moreby Defense Contract Management Agency, Federal Technology Service, EDUCATION, Department of, Navy, and others Signed by year:2000: $0; 2001: $0; 2002: $0; 2003: $54,750; 2004: $25,674; 2005: $204,989; 2006: $21,926.
Biggest contracts:
$84,480 with Defense Contract Management Agency for ADP Software. Signed on 2005-12-19. Completion date: 2006-12-14.
$39,000 with Federal Technology Service for ADP Support Equipment. Signed on 2003-09-15. Completion date: 2003-10-15.
$24,678 with EDUCATION, Department of for . Taking place in DC. Signed on 2005-01-27. Completion date: 2005-10-15.
$13,860 with Navy for Transcription Services. Signed on 2005-08-31. Completion date: 2006-08-31.
Top industries in this zip code by the number of employees in 2005:
2002 - 2018 National Fire Incident Reporting System (NFIRS) incidents
According to the data from the years 2002 - 2018 the average number of fire incidents per year is 32. The highest number of fire incidents - 41 took place in 2016, and the least - 21 in 2004. The data has a rising trend.
When looking into fire subcategories, the most reports belonged to: Outside Fires (47.4%), and Structure Fires (27.2%).
Fire incident types reported to NFIRS in Zip Code 33487


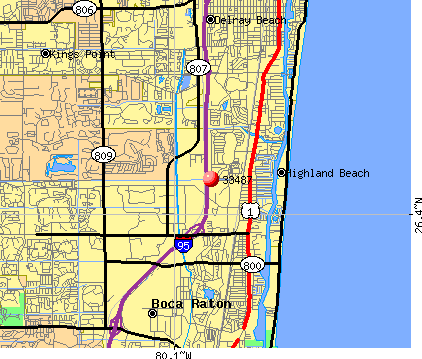 Nearest zip codes: 33431, 33445, 33444, 33483, 33484, 33432.


 According to the data from the years 2002 - 2018 the average number of fire incidents per year is 32. The highest number of fire incidents - 41 took place in 2016, and the least - 21 in 2004. The data has a rising trend.
 When looking into fire subcategories, the most reports belonged to: Outside Fires (47.4%), and Structure Fires (27.2%).