Races in Waipahu, Hawaii (HI) Detailed Stats
Data:
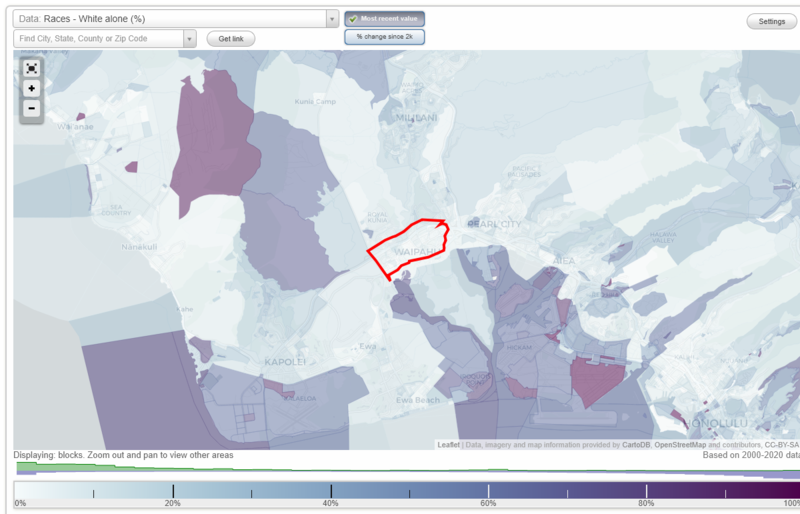
Races - White alone (%)
Races - White alone (% change since 2000)
Races - Black alone (%)
Races - Black alone (% change since 2000)
Races - American Indian alone (%)
Races - American Indian alone (% change since 2000)
Races - Asian alone (%)
Races - Asian alone (% change since 2000)
Races - Hispanic (%)
Races - Hispanic (% change since 2000)
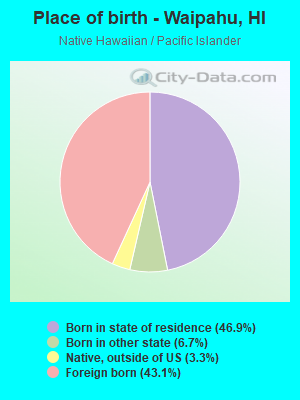
Races - Native Hawaiian and Other Pacific Islander alone (%)
Races - Native Hawaiian and Other Pacific Islander alone (% change since 2000)
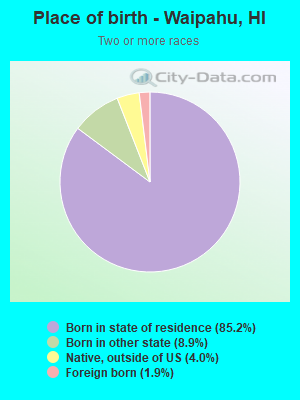
Races - Two or more races(%)
Races - Two or more races(% change since 2000)
Races - Other race alone (%)
Races - Other race alone (% change since 2000)
Racial diversity
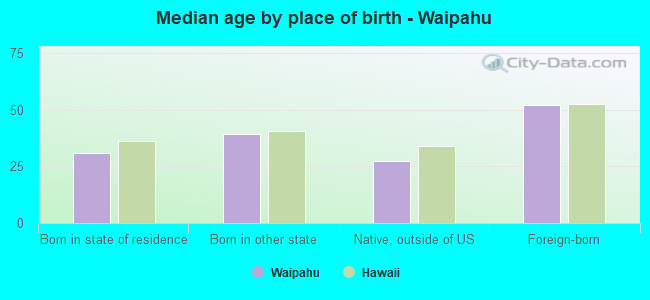
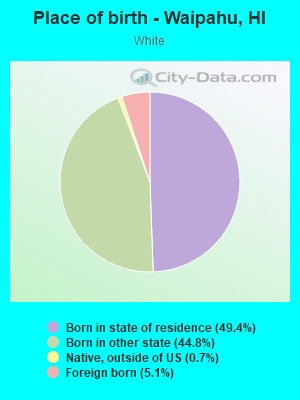
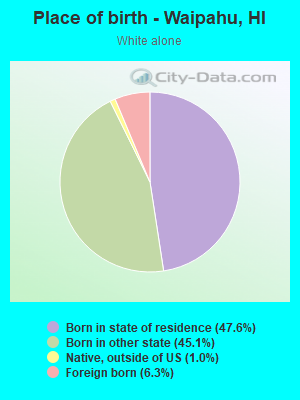
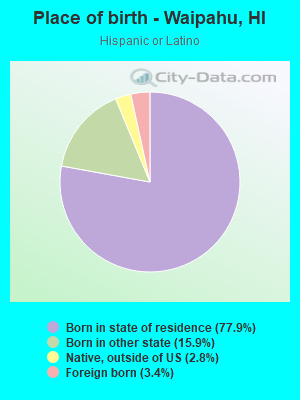
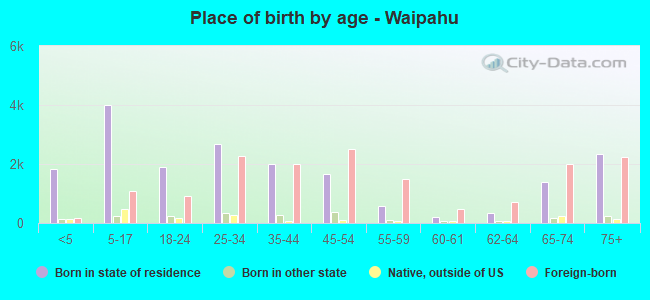
Place of birth - Born in state of residence (%)
Place of birth - Born in state of residence (%) - White
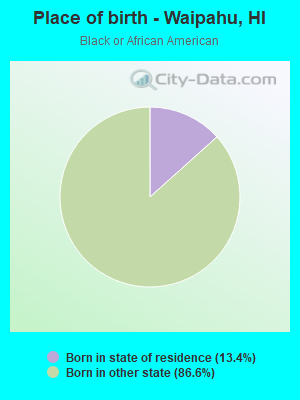
Place of birth - Born in state of residence (%) - Black or African American
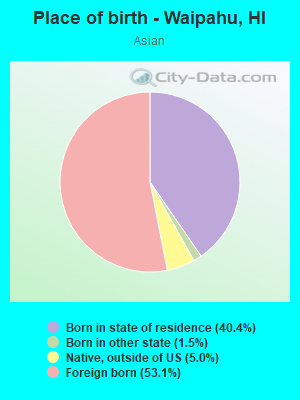
Place of birth - Born in state of residence (%) - Asian
Place of birth - Born in state of residence (%) - Hispanic or Latino
Place of birth - Born in state of residence (%) - American Indian and Alaska Native
Place of birth - Born in state of residence (%) - Multirace
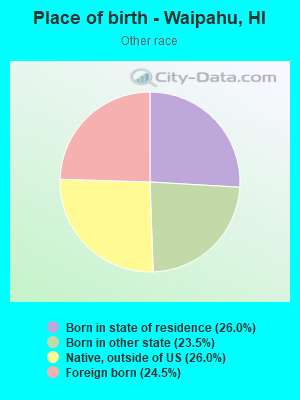
Place of birth - Born in state of residence (%) - Other Race
Place of birth - Born in other state (%)
Place of birth - Born in other state (%) - White
Place of birth - Born in other state (%) - Black or African American
Place of birth - Born in other state (%) - Asian
Place of birth - Born in other state (%) - Hispanic or Latino
Place of birth - Born in other state (%) - American Indian and Alaska Native
Place of birth - Born in other state (%) - Multirace
Place of birth - Born in other state (%) - Other Race
Place of birth - Native, outside of US (%)
Place of birth - Native, outside of US (%) - White
Place of birth - Native, outside of US (%) - Black or African American
Place of birth - Native, outside of US (%) - Asian
Place of birth - Native, outside of US (%) - Hispanic or Latino
Place of birth - Native, outside of US (%) - American Indian and Alaska Native
Place of birth - Native, outside of US (%) - Multirace
Place of birth - Native, outside of US (%) - Other Race
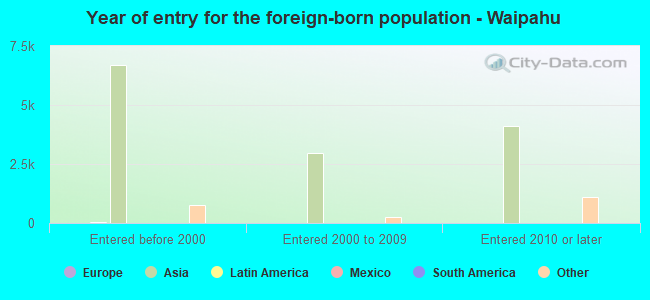
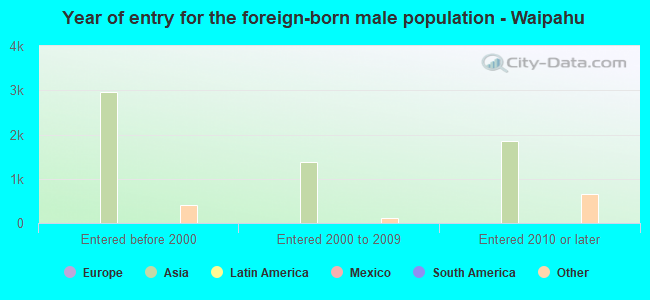
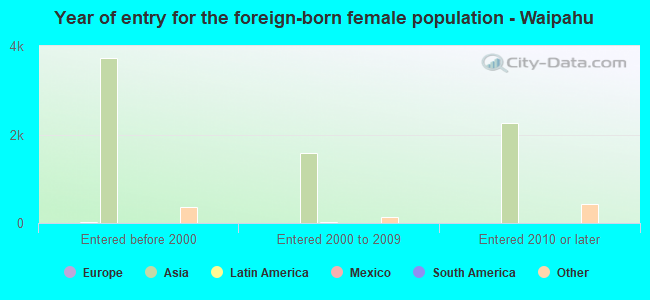
Place of birth - Foreign born (%)
Place of birth - Foreign born (%) - White
Place of birth - Foreign born (%) - Black or African American
Place of birth - Foreign born (%) - Asian
Place of birth - Foreign born (%) - Hispanic or Latino
Place of birth - Foreign born (%) - American Indian and Alaska Native
Place of birth - Foreign born (%) - Multirace
Place of birth - Foreign born (%) - Other Race
Residents speaking English at home (%)
Residents speaking English at home - Born in the United States (%)
Residents speaking English at home - Native, born elsewhere (%)
Residents speaking English at home - Foreign born (%)
Residents speaking Spanish at home (%)
Residents speaking Spanish at home - Born in the United States (%)
Residents speaking Spanish at home - Native, born elsewhere (%)
Residents speaking Spanish at home - Foreign born (%)
Residents speaking other language at home (%)
Residents speaking other language at home - Born in the United States (%)
Residents speaking other language at home - Native, born elsewhere (%)
Residents speaking other language at home - Foreign born (%)
Marital status - Never married (%)
Marital status - Now married (%)
Marital status - Separated (%)
Marital status - Widowed (%)
Marital status - Divorced (%)
Ancestries Reported - Arab (%)
Ancestries Reported - Czech (%)
Ancestries Reported - Danish (%)
Ancestries Reported - Dutch (%)
Ancestries Reported - English (%)
Ancestries Reported - French (%)
Ancestries Reported - French Canadian (%)
Ancestries Reported - German (%)
Ancestries Reported - Greek (%)
Ancestries Reported - Hungarian (%)
Ancestries Reported - Irish (%)
Ancestries Reported - Italian (%)
Ancestries Reported - Lithuanian (%)
Ancestries Reported - Norwegian (%)
Ancestries Reported - Polish (%)
Ancestries Reported - Portuguese (%)
Ancestries Reported - Russian (%)
Ancestries Reported - Scotch-Irish (%)
Ancestries Reported - Scottish (%)
Ancestries Reported - Slovak (%)
Ancestries Reported - Subsaharan African (%)
Ancestries Reported - Swedish (%)
Ancestries Reported - Swiss (%)
Ancestries Reported - Ukrainian (%)
Ancestries Reported - United States (%)
Ancestries Reported - Welsh (%)
Ancestries Reported - West Indian (%)
Ancestries Reported - Other (%)
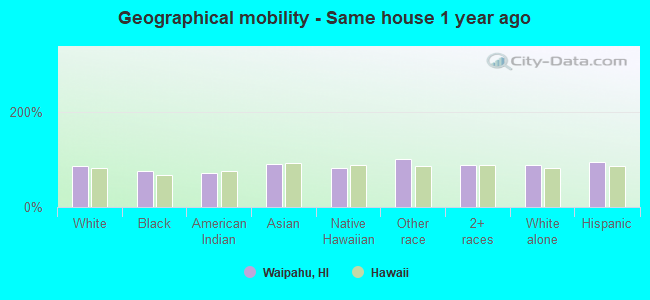
Geographical mobility - Same house 1 year ago (%)
Geographical mobility - Same house 1 year ago (%) - White
Geographical mobility - Same house 1 year ago (%) - Black or African American
Geographical mobility - Same house 1 year ago (%) - Asian
Geographical mobility - Same house 1 year ago (%) - Hispanic or Latino
Geographical mobility - Same house 1 year ago (%) - American Indian and Alaska Native
Geographical mobility - Same house 1 year ago (%) - Multirace
Geographical mobility - Same house 1 year ago (%) - Other Race
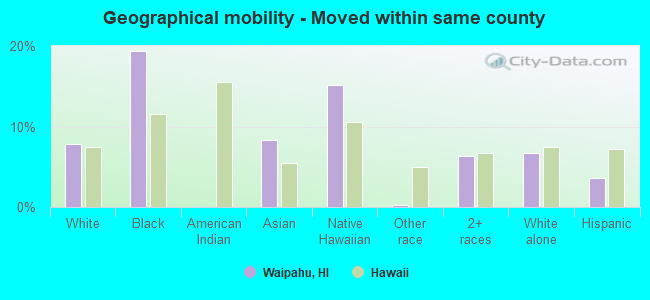
Geographical mobility - Moved within same county (%)
Geographical mobility - Moved within same county (%) - White
Geographical mobility - Moved within same county (%) - Black or African American
Geographical mobility - Moved within same county (%) - Asian
Geographical mobility - Moved within same county (%) - Hispanic or Latino
Geographical mobility - Moved within same county (%) - American Indian and Alaska Native
Geographical mobility - Moved within same county (%) - Multirace
Geographical mobility - Moved within same county (%) - Other Race
Geographical mobility - Moved from different county within same state (%)
Geographical mobility - Moved from different county within same state (%) - White
Geographical mobility - Moved from different county within same state (%) - Black or African American
Geographical mobility - Moved from different county within same state (%) - Asian
Geographical mobility - Moved from different county within same state (%) - Hispanic or Latino
Geographical mobility - Moved from different county within same state (%) - American Indian and Alaska Native
Geographical mobility - Moved from different county within same state (%) - Multirace
Geographical mobility - Moved from different county within same state (%) - Other Race
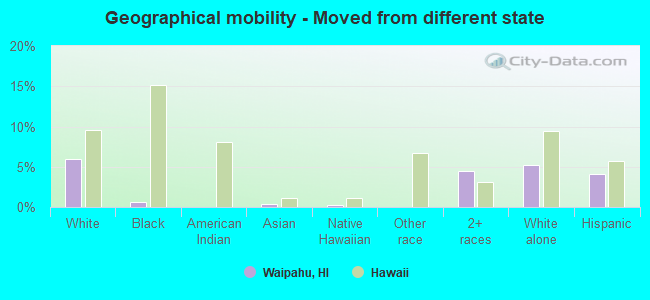
Geographical mobility - Moved from different state (%)
Geographical mobility - Moved from different state (%) - White
Geographical mobility - Moved from different state (%) - Black or African American
Geographical mobility - Moved from different state (%) - Asian
Geographical mobility - Moved from different state (%) - Hispanic or Latino
Geographical mobility - Moved from different state (%) - American Indian and Alaska Native
Geographical mobility - Moved from different state (%) - Multirace
Geographical mobility - Moved from different state (%) - Other Race
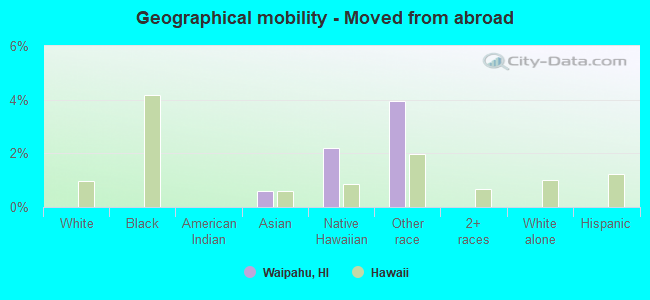
Geographical mobility - Moved from abroad (%)
Geographical mobility - Moved from abroad (%) - White
Geographical mobility - Moved from abroad (%) - Black or African American
Geographical mobility - Moved from abroad (%) - Asian
Geographical mobility - Moved from abroad (%) - Hispanic or Latino
Geographical mobility - Moved from abroad (%) - American Indian and Alaska Native
Geographical mobility - Moved from abroad (%) - Multirace
Geographical mobility - Moved from abroad (%) - Other Race
Place of birth for the foreign-born population - Ireland (%)
Place of birth for the foreign-born population - Denmark (%)
Place of birth for the foreign-born population - Norway (%)
Place of birth for the foreign-born population - Sweden (%)
Place of birth for the foreign-born population - United Kingdom (%)
Place of birth for the foreign-born population - England (%)
Place of birth for the foreign-born population - Scotland (%)
Place of birth for the foreign-born population - Other Northern Europe (%)
Place of birth for the foreign-born population - Austria (%)
Place of birth for the foreign-born population - Belgium (%)
Place of birth for the foreign-born population - France (%)
Place of birth for the foreign-born population - Germany (%)
Place of birth for the foreign-born population - Netherlands (%)
Place of birth for the foreign-born population - Switzerland (%)
Place of birth for the foreign-born population - Other Western Europe (%)
Place of birth for the foreign-born population - Greece (%)
Place of birth for the foreign-born population - Italy (%)
Place of birth for the foreign-born population - Portugal (%)
Place of birth for the foreign-born population - Spain (%)
Place of birth for the foreign-born population - Other Southern Europe (%)
Place of birth for the foreign-born population - Albania (%)
Place of birth for the foreign-born population - Belarus (%)
Place of birth for the foreign-born population - Bosnia and Herzegovina (%)
Place of birth for the foreign-born population - Bulgaria (%)
Place of birth for the foreign-born population - Croatia (%)
Place of birth for the foreign-born population - Czechoslovakia (%)
Place of birth for the foreign-born population - Hungary (%)
Place of birth for the foreign-born population - Latvia (%)
Place of birth for the foreign-born population - Lithuania (%)
Place of birth for the foreign-born population - North Macedonia (Macedonia) (%)
Place of birth for the foreign-born population - Moldova (%)
Place of birth for the foreign-born population - Poland (%)
Place of birth for the foreign-born population - Romania (%)
Place of birth for the foreign-born population - Russia (%)
Place of birth for the foreign-born population - Serbia (%)
Place of birth for the foreign-born population - Ukraine (%)
Place of birth for the foreign-born population - Other Eastern Europe (%)
Place of birth for the foreign-born population - China (%)
Place of birth for the foreign-born population - Hong Kong (%)
Place of birth for the foreign-born population - Taiwan (%)
Place of birth for the foreign-born population - Japan (%)
Place of birth for the foreign-born population - Korea (%)
Place of birth for the foreign-born population - Other Eastern Asia (%)
Place of birth for the foreign-born population - Afghanistan (%)
Place of birth for the foreign-born population - Bangladesh (%)
Place of birth for the foreign-born population - India (%)
Place of birth for the foreign-born population - Iran (%)
Place of birth for the foreign-born population - Kazakhstan (%)
Place of birth for the foreign-born population - Nepal (%)
Place of birth for the foreign-born population - Pakistan (%)
Place of birth for the foreign-born population - Sri Lanka (%)
Place of birth for the foreign-born population - Uzbekistan (%)
Place of birth for the foreign-born population - Other South Central Asia (%)
Place of birth for the foreign-born population - Burma (%)
Place of birth for the foreign-born population - Cambodia (%)
Place of birth for the foreign-born population - Indonesia (%)
Place of birth for the foreign-born population - Laos (%)
Place of birth for the foreign-born population - Malaysia (%)
Place of birth for the foreign-born population - Philippines (%)
Place of birth for the foreign-born population - Singapore (%)
Place of birth for the foreign-born population - Thailand (%)
Place of birth for the foreign-born population - Vietnam (%)
Place of birth for the foreign-born population - Other South Eastern Asia (%)
Place of birth for the foreign-born population - Armenia (%)
Place of birth for the foreign-born population - Iraq (%)
Place of birth for the foreign-born population - Israel (%)
Place of birth for the foreign-born population - Jordan (%)
Place of birth for the foreign-born population - Kuwait (%)
Place of birth for the foreign-born population - Lebanon (%)
Place of birth for the foreign-born population - Saudi Arabia (%)
Place of birth for the foreign-born population - Syria (%)
Place of birth for the foreign-born population - Turkey (%)
Place of birth for the foreign-born population - Yemen (%)
Place of birth for the foreign-born population - Other Western Asia (%)
Place of birth for the foreign-born population - Eritrea (%)
Place of birth for the foreign-born population - Ethiopia (%)
Place of birth for the foreign-born population - Kenya (%)
Place of birth for the foreign-born population - Somalia (%)
Place of birth for the foreign-born population - Uganda (%)
Place of birth for the foreign-born population - Zimbabwe (%)
Place of birth for the foreign-born population - Other Eastern Africa (%)
Place of birth for the foreign-born population - Cameroon (%)
Place of birth for the foreign-born population - Congo (%)
Place of birth for the foreign-born population - Democratic Republic of Congo (Zaire) (%)
Place of birth for the foreign-born population - Other Middle Africa (%)
Place of birth for the foreign-born population - Egypt (%)
Place of birth for the foreign-born population - Morocco (%)
Place of birth for the foreign-born population - Sudan (%)
Place of birth for the foreign-born population - Other Northern Africa (%)
Place of birth for the foreign-born population - South Africa (%)
Place of birth for the foreign-born population - Other Southern Africa (%)
Place of birth for the foreign-born population - Cabo Verde (%)
Place of birth for the foreign-born population - Ghana (%)
Place of birth for the foreign-born population - Liberia (%)
Place of birth for the foreign-born population - Nigeria (%)
Place of birth for the foreign-born population - Senegal (%)
Place of birth for the foreign-born population - Sierra Leone (%)
Place of birth for the foreign-born population - Other Western Africa (%)
Place of birth for the foreign-born population - Australia (%)
Place of birth for the foreign-born population - New Zealand (%)
Place of birth for the foreign-born population - Fiji (%)
Place of birth for the foreign-born population - Micronesia (%)
Place of birth for the foreign-born population - Bahamas (%)
Place of birth for the foreign-born population - Barbados (%)
Place of birth for the foreign-born population - Cuba (%)
Place of birth for the foreign-born population - Dominica (%)
Place of birth for the foreign-born population - Dominican Republic (%)
Place of birth for the foreign-born population - Grenada (%)
Place of birth for the foreign-born population - Haiti (%)
Place of birth for the foreign-born population - Jamaica (%)
Place of birth for the foreign-born population - St. Vincent and the Grenadines (%)
Place of birth for the foreign-born population - Trinidad and Tobago (%)
Place of birth for the foreign-born population - West Indies (%)
Place of birth for the foreign-born population - Other Caribbean (%)
Place of birth for the foreign-born population - Belize (%)
Place of birth for the foreign-born population - Costa Rica (%)
Place of birth for the foreign-born population - El Salvador (%)
Place of birth for the foreign-born population - Guatemala (%)
Place of birth for the foreign-born population - Honduras (%)
Place of birth for the foreign-born population - Mexico (%)
Place of birth for the foreign-born population - Nicaragua (%)
Place of birth for the foreign-born population - Panama (%)
Place of birth for the foreign-born population - Other Central America (%)
Place of birth for the foreign-born population - Argentina (%)
Place of birth for the foreign-born population - Bolivia (%)
Place of birth for the foreign-born population - Brazil (%)
Place of birth for the foreign-born population - Chile (%)
Place of birth for the foreign-born population - Colombia (%)
Place of birth for the foreign-born population - Ecuador (%)
Place of birth for the foreign-born population - Guyana (%)
Place of birth for the foreign-born population - Peru (%)
Place of birth for the foreign-born population - Uruguay (%)
Place of birth for the foreign-born population - Venezuela (%)
Place of birth for the foreign-born population - Other South America (%)
Place of birth for the foreign-born population - Canada (%)
Place of birth for the foreign-born population - Other Northern America (%)
Place of birth for the foreign-born population - Other (%)
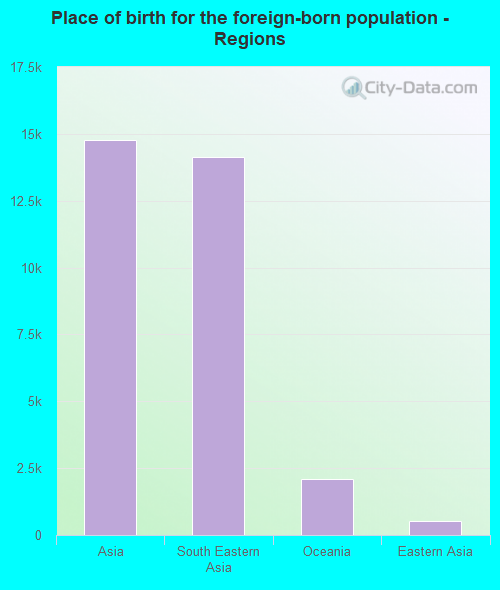
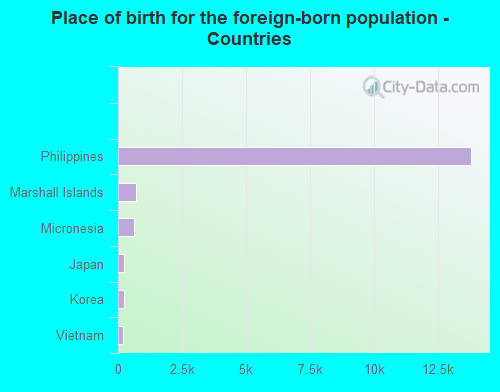
According to 2022 data, the most numerous races in Waipahu, HI are Asian alone (25,353 residents), Two or more races (4,725 residents), and White alone (1,390 residents). 51.3% of Waipahu residents speak English at home. 43.1% of Waipahu, HI residents are foreign-born (36.3% born in Asia, 5.2% born in Oceania), which is 58.3% greater than the foreign-born rate of 18.0% across the entire state of Hawaii.
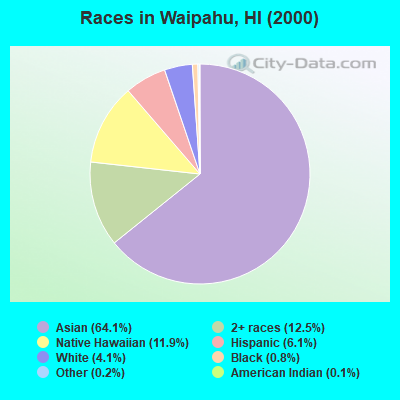
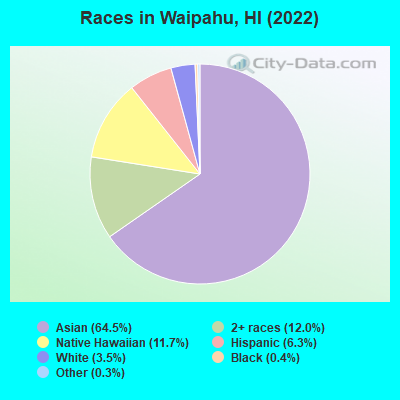
Race distribution in Waipahu
2000 2022
21,232 64.1% Asian alone 4,144 12.5% Two or more races 3,956 11.9% Native Hawaiian and Other 2,016 6.1% Hispanic 1,362 4.1% White alone 281 0.8% Black alone 80 0.2% Other race alone 37 0.1% American Indian alone
25,353 64.5% Asian alone 4,725 12.0% Two or more races 4,596 11.7% Native Hawaiian and Other 2,468 6.3% Hispanic 1,390 3.5% White alone 153 0.4% Black alone 109 0.3% Other race alone 4 0.01% American Indian alone
2000 2022
494,149 40.8% Asian alone 277,091 22.9% White alone 218,700 18.1% Two or more races 108,441 9.0% Native Hawaiian and Other 87,699 7.2% Hispanic 20,829 1.7% Black alone 2,089 0.2% Other race alone 2,539 0.2% American Indian alone
498,125 34.6% Asian alone 318,574 22.1% Two or more races 297,937 20.7% White alone 160,103 11.1% Hispanic 134,567 9.3% Native Hawaiian and Other 23,682 1.6% Black alone 5,378 0.4% Other race alone 1,830 0.1% American Indian alone
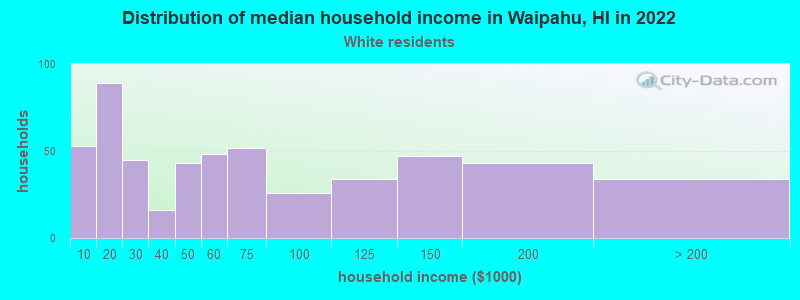
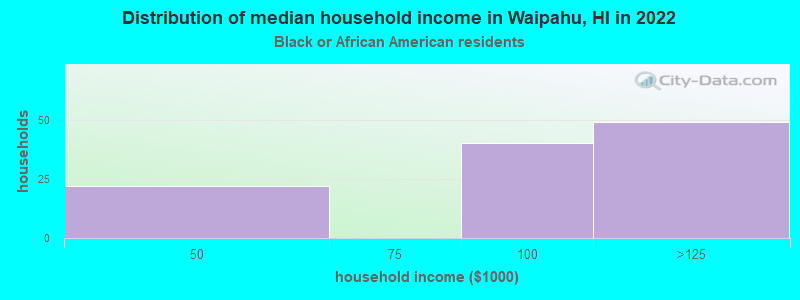
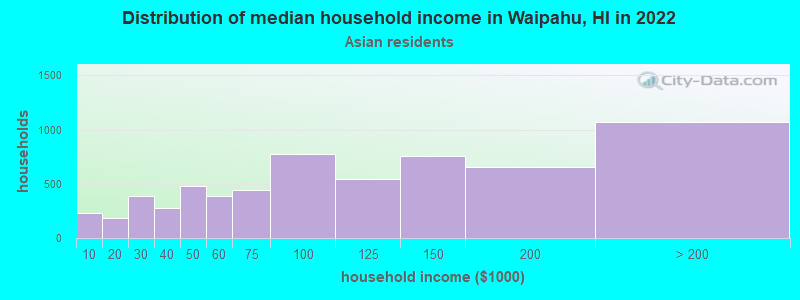
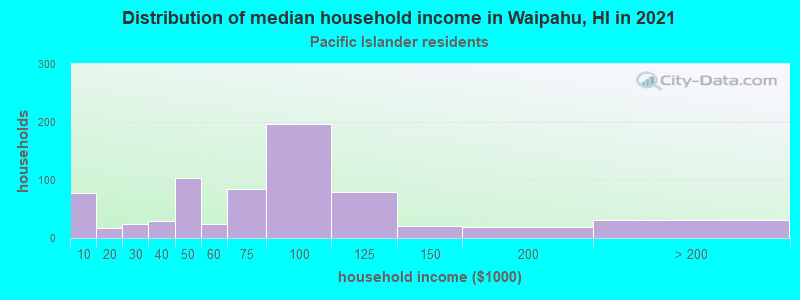
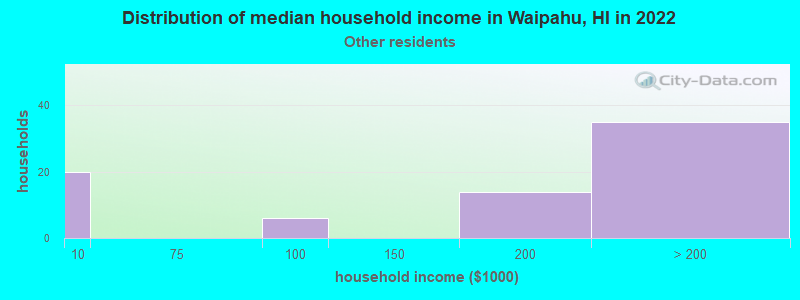
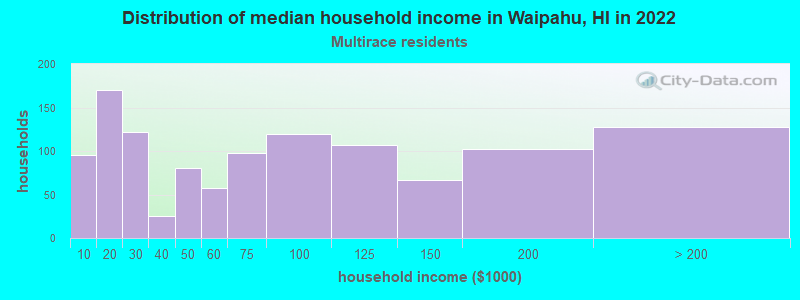
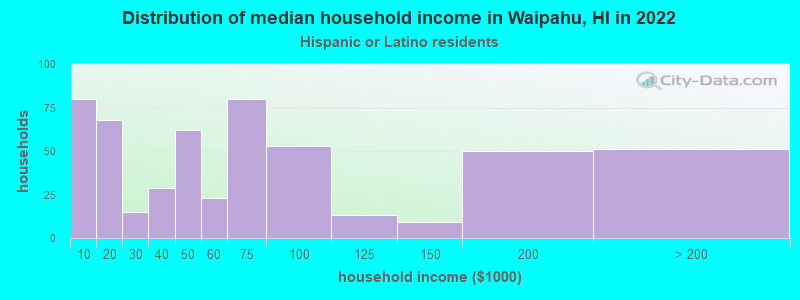
Income and house value in Waipahu Median household income in 2022 $57,712 White non-Hispanic householders$79,935 Black householders$95,817 Asian householders$56,110 Native Hawaiian and other Pacific Islander householders$60,832 Two or more races householders$56,889 Hispanic or Latino race householdersMedian 2022 house value $870,370 White Non-Hispanic householders$608,934 Black or African American householders $855,755 Asian householders$821,980 Native Hawaiian and other Pacific Islander householdersover $1,000,000 Some other race householders$881,737 Two or more races householdersover $1,000,000 Hispanic or Latino householders
Median age by race in Waipahu
49.0 Median age for White residents49.1 48.7 36.1 Median age for Black or African American residents48.4 31.7 76.0 Median age for American Indian / Alaska Native residents-715,953,306.7 -629,508,196.1 47.5 Median age for Asian residents42.6 49.8 27.4 Median age for Native Hawaiian / Pacific Islander residents26.4 30.2 34.3 Median age for Other race residents29.6 35.9 27.8 Median age for Two or more races residents32.1 24.1 53.6 Median age for White alone residents55.7 48.0 27.1 Median age for Hispanic or Latino residents27.6 27.1
Owner/renter occupied households by race in Waipahu
House owners and renters - White residents 164 32.3% Owner occupied344 67.7% Renter occupiedHouse owners and renters - Black or African American residents 35 28.7% Owner occupied86 71.3% Renter occupiedHouse owners and renters - American Indian / Alaska Native residents 10 100.0% Renter occupiedHouse owners and renters - Asian residents 4,292 69.3% Owner occupied1,905 30.7% Renter occupiedHouse owners and renters - Native Hawaiian / Pacific Islander residents 155 19.6% Owner occupied634 80.4% Renter occupiedHouse owners and renters - Other race residents 31 42.9% Owner occupied41 57.1% Renter occupiedHouse owners and renters - Two or more races residents 474 40.0% Owner occupied710 60.0% Renter occupiedHouse owners and renters - White alone residents 128 32.6% Owner occupied264 67.4% Renter occupiedHouse owners and renters - Hispanic or Latino residents 114 22.7% Owner occupied390 77.3% Renter occupied
Language usage in Waipahu
English speakers - Total 51.3% of residents of Waipahu speak English at home.
0.5% of residents speak Spanish at home 87 50.0% Speak English very well87 50.0% Speak English less than very well46.6% of residents speak other language at home 8,359 48.6% Speak English very well8,857 51.4% Speak English less than very well
English speakers - Born in the United States 89.2% of residents of Waipahu speak English at home.
2.6% of residents speak Spanish at home 54 98.2% Speak English very well1 1.8% Speak English less than very well6.5% of residents speak other language at home 94 69.6% Speak English very well41 30.4% Speak English less than very well
English speakers - Native, born elsewhere 54.2% of residents of Waipahu speak English at home.
2.2% of residents speak Spanish at home 34 100.0% Speak English less than very well41.2% of residents speak other language at home 401 61.6% Speak English very well250 38.4% Speak English less than very well
English speakers - Foreign-born 8.5% of residents of Waipahu speak English at home.
0.3% of residents speak Spanish at home 7 13.2% Speak English very well46 86.8% Speak English less than very well90.9% of residents speak other language at home 5,887 41.1% Speak English very well8,428 58.9% Speak English less than very well
White (Caucasian) - Speak only English Native:
99.0% (1,511)Foreign-born:
20.3% (18)
White (Caucasian) - Speak another language Native:
2.0% (30)Foreign-born:
74.8% (65)
Asian - Speak only English Native:
82.4% (9,082)Foreign-born:
8.0% (1,076)
Asian - Speak another language Native:
17.3% (1,913)Foreign-born:
92.1% (12,401)
Native Hawaiian / Pacific Islander - Speak only English Native:
71.7% (1,655)Foreign-born:
9.0% (177)
Native Hawaiian / Pacific Islander - Speak another language Native:
27.0% (624)Foreign-born:
91.1% (1,792)
Other race - Speak another language Native:
47.8% (81)Foreign-born:
98.0% (48)
Two or more races - Speak only English Native:
90.1% (5,000)Foreign-born:
28.0% (34)
Two or more races - Speak another language Native:
9.9% (550)Foreign-born:
72.0% (86)
White alone - Speak only English Native:
99.1% (1,242)Foreign-born:
14.9% (13)
White alone - Speak another language Native:
1.2% (15)Foreign-born:
84.6% (76)
Hispanic or Latino - Speak only English Native:
87.1% (1,809)Foreign-born:
5.7% (5)
Hispanic or Latino - Speak another language Native:
13.1% (272)Foreign-born:
91.2% (75)
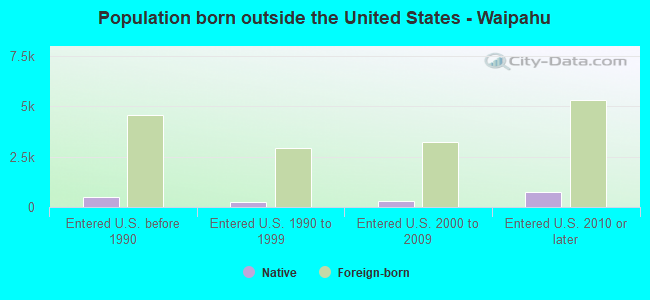
Foreign-born residents in Waipahu 16,953 residents are foreign born (36.3% Asia , 5.2% Oceania ).
This city:
43.1%Hawaii:
18.0%
Marital status for residents in Waipahu Marital status - White (Caucasian) population 15 years and over
Males 38.4% Never married35.5% Now married0.0% Separated4.9% Widowed21.2% DivorcedFemales 31.2% Never married33.3% Now married1.7% Separated18.2% Widowed15.6% DivorcedWomen who gave birth in the past 12 months Now married:
0.0% (0)Unmarried:
100.0% (8)
Women who did not give birth in the past 12 months Now married:
48.2% (166)Unmarried:
51.8% (178)
Marital status - Black or African American population 15 years and over
Males 50.0% Never married37.0% Now married0.0% Separated0.0% Widowed13.0% DivorcedFemales 37.2% Never married62.8% Now married0.0% Separated0.0% Widowed0.0% DivorcedWomen who gave birth in the past 12 months Now married:
100.0% (47)Unmarried:
0.0% (0)
Women who did not give birth in the past 12 months Now married:
0.0% (0)Unmarried:
100.0% (2)
Marital status - American Indian / Alaska Native population 15 years and over
Males 0.0% Never married100.0% Now married0.0% Separated0.0% Widowed0.0% DivorcedFemales 0.0% Never married0.0% Now married0.0% Separated64.7% Widowed35.3% DivorcedMarital status - Asian population 15 years and over
Males 37.2% Never married52.0% Now married0.9% Separated3.2% Widowed6.7% DivorcedFemales 24.3% Never married48.3% Now married2.1% Separated18.1% Widowed7.2% DivorcedWomen who gave birth in the past 12 months Now married:
69.4% (240)Unmarried:
30.6% (106)
Women who did not give birth in the past 12 months Now married:
48.2% (2,406)Unmarried:
51.8% (2,590)
Marital status - Native Hawaiian / Pacific Islander population 15 years and over
Males 43.5% Never married51.7% Now married1.3% Separated2.3% Widowed1.3% DivorcedFemales 38.8% Never married47.8% Now married0.5% Separated7.5% Widowed5.4% DivorcedWomen who gave birth in the past 12 months Now married:
81.1% (95)Unmarried:
18.9% (22)
Women who did not give birth in the past 12 months Now married:
44.8% (438)Unmarried:
55.2% (540)
Marital status - Other race population 15 years and over
Males 22.3% Never married70.9% Now married0.0% Separated0.0% Widowed6.8% DivorcedFemales 41.3% Never married36.5% Now married0.0% Separated0.0% Widowed22.2% DivorcedWomen who did not give birth in the past 12 months Now married:
17.1% (9)Unmarried:
82.9% (42)
Marital status - Two or more races population 15 years and over
Males 58.5% Never married28.3% Now married2.1% Separated2.4% Widowed8.6% DivorcedFemales 61.1% Never married25.9% Now married0.0% Separated5.7% Widowed7.3% DivorcedWomen who gave birth in the past 12 months Now married:
21.0% (14)Unmarried:
79.0% (52)
Women who did not give birth in the past 12 months Now married:
23.6% (361)Unmarried:
76.4% (1,171)
Marital status - White alone, not Hispanic / Latino population 15 years and over
Males 30.1% Never married39.0% Now married0.0% Separated6.3% Widowed24.6% DivorcedFemales 30.6% Never married32.1% Now married1.6% Separated20.8% Widowed14.9% DivorcedWomen who gave birth in the past 12 months Now married:
0.0% (0)Unmarried:
100.0% (9)
Women who did not give birth in the past 12 months Now married:
50.8% (146)Unmarried:
49.2% (142)
Marital status - Hispanic or Latino population 15 years and over
Males 55.6% Never married34.6% Now married1.4% Separated1.8% Widowed6.6% DivorcedFemales 62.9% Never married23.8% Now married0.4% Separated2.7% Widowed10.2% DivorcedWomen who gave birth in the past 12 months Now married:
0.0% (0)Unmarried:
100.0% (27)
Women who did not give birth in the past 12 months Now married:
16.5% (89)Unmarried:
83.5% (451)
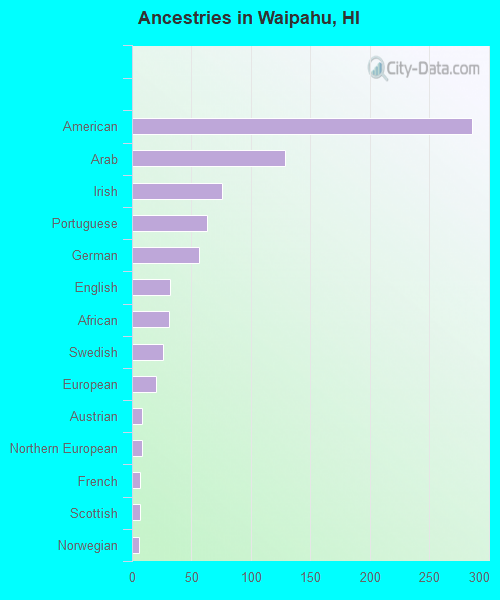
Ancestries in Waipahu
286 1.2% American129 0.5% Arab76 0.3% Irish63 0.3% Portuguese56 0.2% German32 0.1% English31 0.1% African26 0.1% Swedish20 0.08% European8 0.03% Austrian8 0.03% Northern European7 0.03% French7 0.03% Scottish6 0.02% Norwegian
Geographical mobility in Waipahu Same house 1 year ago 1,420 85.5% White (Caucasian)117 75.4% Black or African American19 71.0% American Indian / Alaska Native22,785 89.7% Asian3,785 82.4% Native Hawaiian / Pacific Islander229 100.0% Other race5,469 89.1% Two or more races1,217 87.5% White alone, not Hispanic / Latino2,221 93.6% Hispanic or LatinoMoved within same county 131 7.9% White / Caucasian30 19.4% Black or African American2,117 8.3% Asian697 15.2% Native Hawaiian / Pacific Islander1 0.2% Other race390 6.4% Two or more races93 6.7% White alone, not Hispanic / Latino87 3.7% Hispanic or LatinoMoved within same state 13 0.8% White / Caucasian11 41.4% American Indian / Alaska Native327 1.3% Asian1 0.0% Native Hawaiian / Pacific Islander13 1.0% White alone, not Hispanic / Latino13 0.5% Hispanic or LatinoMoved from different state 99 5.9% White / Caucasian1 0.7% Black or African American95 0.4% Asian10 0.2% Native Hawaiian / Pacific Islander275 4.5% Two or more races72 5.2% White alone, not Hispanic / Latino98 4.1% Hispanic or LatinoMoved from abroad 155 0.6% Asian101 2.2% Native Hawaiian / Pacific Islander9 3.9% Other race
Children Nativity (place of birth) in Waipahu
Children under 6 years - Living with two parents Both parents native 73 100.0% NativeBoth parents foreign-born 962 91.3% Native91 8.7% Foreign-bornOne native, one foreign-born parent 147 57.6% Native109 42.4% Foreign-bornChildren under 6 years - Living with one parent Native parent 996 100.0% NativeForeign-born parent 159 91.8% Native14 8.2% Foreign-bornChildren 6 to 17 years - Living with two parents Both parents native 726 100.0% NativeBoth parents foreign-born 1,187 59.0% Native826 41.0% Foreign-bornOne native, one foreign-born parent 216 81.6% Native49 18.4% Foreign-bornChildren 6 to 17 years - Living with one parent Native parent 1,011 100.0% NativeForeign-born parent 552 59.4% Native378 40.6% Foreign-born
Grandparents responsible for own grandchildren in Waipahu
Grandparents (30 to 59 years) White / Caucasian 34 70.3% Responsible for grandchildren14 29.7% Not responsible for grandchildrenAsian 44 11.5% Responsible for grandchildren335 88.5% Not responsible for grandchildrenNative Hawaiian / Pacific Islander 57 77.9% Responsible for grandchildren16 22.1% Not responsible for grandchildrenTwo or more races 13 100.0% Not responsible for grandchildrenWhite alone, not Hispanic / Latino 20 55.6% Responsible for grandchildren16 44.4% Not responsible for grandchildrenHispanic or Latino 31 100.0% Responsible for grandchildrenGrandparents (60 years and over) White / Caucasian 79 100.0% Not responsible for grandchildrenAsian 115 7.7% Responsible for grandchildren1,384 92.3% Not responsible for grandchildrenNative Hawaiian / Pacific Islander 25 43.7% Responsible for grandchildren33 56.3% Not responsible for grandchildrenTwo or more races 63 42.9% Responsible for grandchildren85 57.1% Not responsible for grandchildrenWhite alone, not Hispanic / Latino 63 100.0% Not responsible for grandchildrenHispanic or Latino 9 27.5% Responsible for grandchildren23 72.5% Not responsible for grandchildren