Races in Waite Park, Minnesota (MN) Detailed Stats
Data:
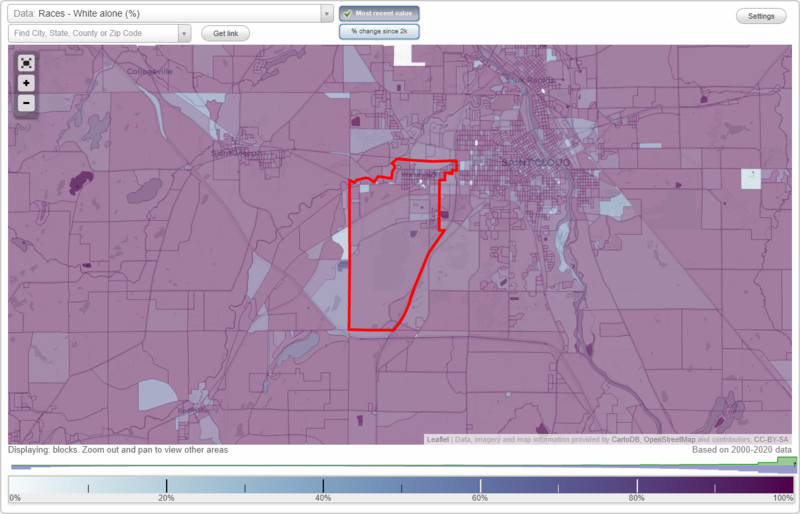
Races - White alone (%)
Races - White alone (% change since 2000)
Races - Black alone (%)
Races - Black alone (% change since 2000)
Races - American Indian alone (%)
Races - American Indian alone (% change since 2000)
Races - Asian alone (%)
Races - Asian alone (% change since 2000)
Races - Hispanic (%)
Races - Hispanic (% change since 2000)
Races - Native Hawaiian and Other Pacific Islander alone (%)
Races - Native Hawaiian and Other Pacific Islander alone (% change since 2000)
Races - Two or more races(%)
Races - Two or more races(% change since 2000)
Races - Other race alone (%)
Races - Other race alone (% change since 2000)
Racial diversity
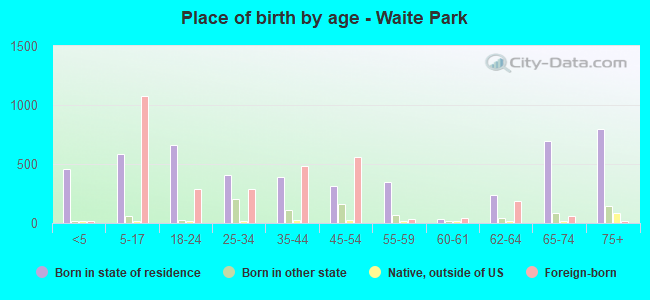
Place of birth - Born in state of residence (%)
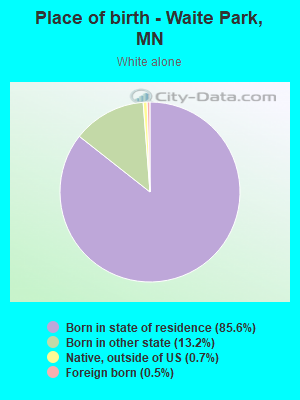
Place of birth - Born in state of residence (%) - White
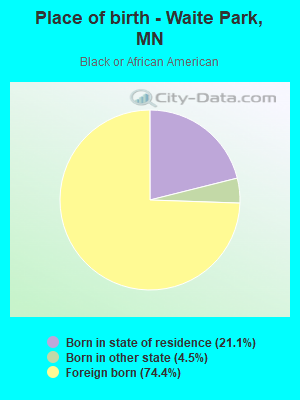
Place of birth - Born in state of residence (%) - Black or African American
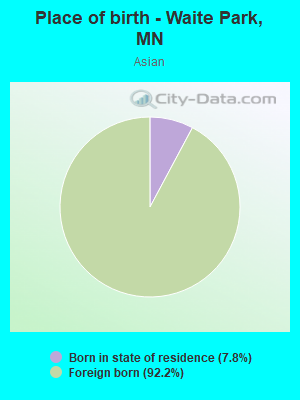
Place of birth - Born in state of residence (%) - Asian
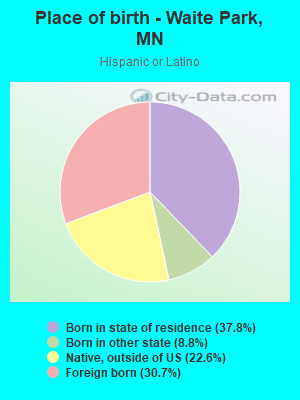
Place of birth - Born in state of residence (%) - Hispanic or Latino
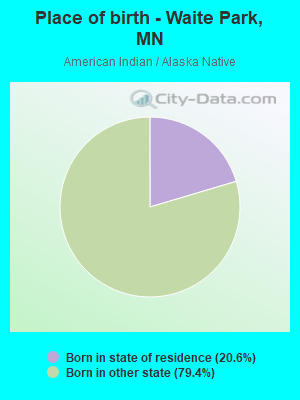
Place of birth - Born in state of residence (%) - American Indian and Alaska Native
Place of birth - Born in state of residence (%) - Multirace
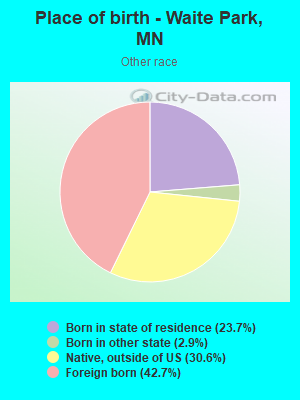
Place of birth - Born in state of residence (%) - Other Race
Place of birth - Born in other state (%)
Place of birth - Born in other state (%) - White
Place of birth - Born in other state (%) - Black or African American
Place of birth - Born in other state (%) - Asian
Place of birth - Born in other state (%) - Hispanic or Latino
Place of birth - Born in other state (%) - American Indian and Alaska Native
Place of birth - Born in other state (%) - Multirace
Place of birth - Born in other state (%) - Other Race
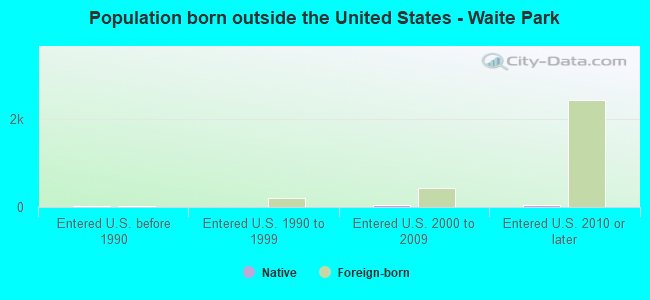
Place of birth - Native, outside of US (%)
Place of birth - Native, outside of US (%) - White
Place of birth - Native, outside of US (%) - Black or African American
Place of birth - Native, outside of US (%) - Asian
Place of birth - Native, outside of US (%) - Hispanic or Latino
Place of birth - Native, outside of US (%) - American Indian and Alaska Native
Place of birth - Native, outside of US (%) - Multirace
Place of birth - Native, outside of US (%) - Other Race
Place of birth - Foreign born (%)
Place of birth - Foreign born (%) - White
Place of birth - Foreign born (%) - Black or African American
Place of birth - Foreign born (%) - Asian
Place of birth - Foreign born (%) - Hispanic or Latino
Place of birth - Foreign born (%) - American Indian and Alaska Native
Place of birth - Foreign born (%) - Multirace
Place of birth - Foreign born (%) - Other Race
Residents speaking English at home (%)
Residents speaking English at home - Born in the United States (%)
Residents speaking English at home - Native, born elsewhere (%)
Residents speaking English at home - Foreign born (%)
Residents speaking Spanish at home (%)
Residents speaking Spanish at home - Born in the United States (%)
Residents speaking Spanish at home - Native, born elsewhere (%)
Residents speaking Spanish at home - Foreign born (%)
Residents speaking other language at home (%)
Residents speaking other language at home - Born in the United States (%)
Residents speaking other language at home - Native, born elsewhere (%)
Residents speaking other language at home - Foreign born (%)
Marital status - Never married (%)
Marital status - Now married (%)
Marital status - Separated (%)
Marital status - Widowed (%)
Marital status - Divorced (%)
Ancestries Reported - Arab (%)
Ancestries Reported - Czech (%)
Ancestries Reported - Danish (%)
Ancestries Reported - Dutch (%)
Ancestries Reported - English (%)
Ancestries Reported - French (%)
Ancestries Reported - French Canadian (%)
Ancestries Reported - German (%)
Ancestries Reported - Greek (%)
Ancestries Reported - Hungarian (%)
Ancestries Reported - Irish (%)
Ancestries Reported - Italian (%)
Ancestries Reported - Lithuanian (%)
Ancestries Reported - Norwegian (%)
Ancestries Reported - Polish (%)
Ancestries Reported - Portuguese (%)
Ancestries Reported - Russian (%)
Ancestries Reported - Scotch-Irish (%)
Ancestries Reported - Scottish (%)
Ancestries Reported - Slovak (%)
Ancestries Reported - Subsaharan African (%)
Ancestries Reported - Swedish (%)
Ancestries Reported - Swiss (%)
Ancestries Reported - Ukrainian (%)
Ancestries Reported - United States (%)
Ancestries Reported - Welsh (%)
Ancestries Reported - West Indian (%)
Ancestries Reported - Other (%)
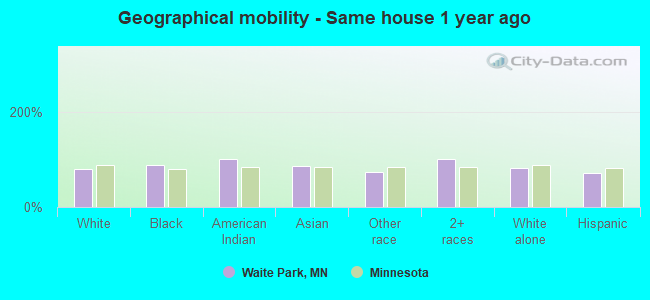
Geographical mobility - Same house 1 year ago (%)
Geographical mobility - Same house 1 year ago (%) - White
Geographical mobility - Same house 1 year ago (%) - Black or African American
Geographical mobility - Same house 1 year ago (%) - Asian
Geographical mobility - Same house 1 year ago (%) - Hispanic or Latino
Geographical mobility - Same house 1 year ago (%) - American Indian and Alaska Native
Geographical mobility - Same house 1 year ago (%) - Multirace
Geographical mobility - Same house 1 year ago (%) - Other Race
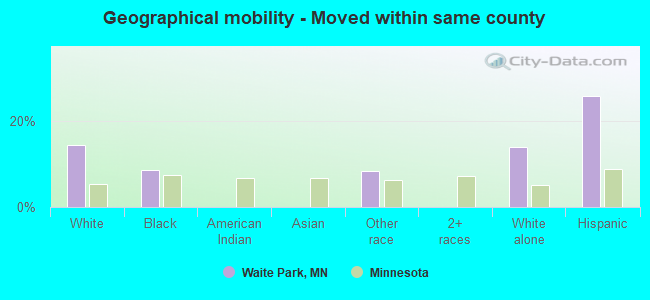
Geographical mobility - Moved within same county (%)
Geographical mobility - Moved within same county (%) - White
Geographical mobility - Moved within same county (%) - Black or African American
Geographical mobility - Moved within same county (%) - Asian
Geographical mobility - Moved within same county (%) - Hispanic or Latino
Geographical mobility - Moved within same county (%) - American Indian and Alaska Native
Geographical mobility - Moved within same county (%) - Multirace
Geographical mobility - Moved within same county (%) - Other Race
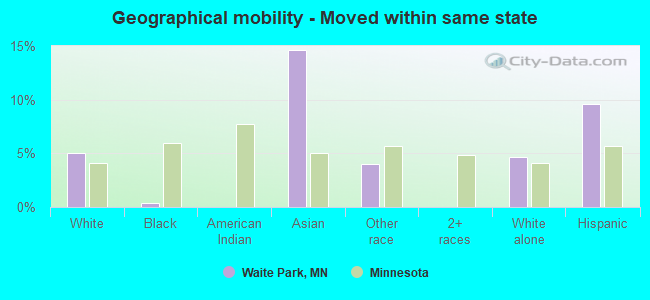
Geographical mobility - Moved from different county within same state (%)
Geographical mobility - Moved from different county within same state (%) - White
Geographical mobility - Moved from different county within same state (%) - Black or African American
Geographical mobility - Moved from different county within same state (%) - Asian
Geographical mobility - Moved from different county within same state (%) - Hispanic or Latino
Geographical mobility - Moved from different county within same state (%) - American Indian and Alaska Native
Geographical mobility - Moved from different county within same state (%) - Multirace
Geographical mobility - Moved from different county within same state (%) - Other Race
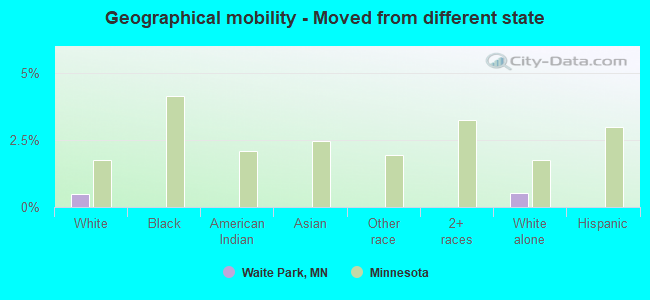
Geographical mobility - Moved from different state (%)
Geographical mobility - Moved from different state (%) - White
Geographical mobility - Moved from different state (%) - Black or African American
Geographical mobility - Moved from different state (%) - Asian
Geographical mobility - Moved from different state (%) - Hispanic or Latino
Geographical mobility - Moved from different state (%) - American Indian and Alaska Native
Geographical mobility - Moved from different state (%) - Multirace
Geographical mobility - Moved from different state (%) - Other Race
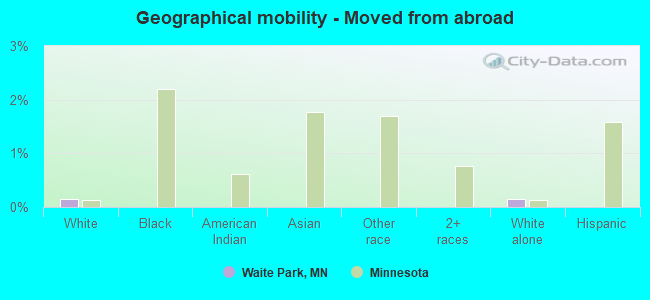
Geographical mobility - Moved from abroad (%)
Geographical mobility - Moved from abroad (%) - White
Geographical mobility - Moved from abroad (%) - Black or African American
Geographical mobility - Moved from abroad (%) - Asian
Geographical mobility - Moved from abroad (%) - Hispanic or Latino
Geographical mobility - Moved from abroad (%) - American Indian and Alaska Native
Geographical mobility - Moved from abroad (%) - Multirace
Geographical mobility - Moved from abroad (%) - Other Race
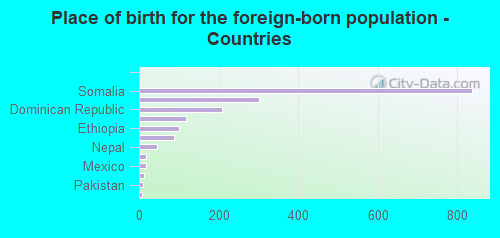
Place of birth for the foreign-born population - Ireland (%)
Place of birth for the foreign-born population - Denmark (%)
Place of birth for the foreign-born population - Norway (%)
Place of birth for the foreign-born population - Sweden (%)
Place of birth for the foreign-born population - United Kingdom (%)
Place of birth for the foreign-born population - England (%)
Place of birth for the foreign-born population - Scotland (%)
Place of birth for the foreign-born population - Other Northern Europe (%)
Place of birth for the foreign-born population - Austria (%)
Place of birth for the foreign-born population - Belgium (%)
Place of birth for the foreign-born population - France (%)
Place of birth for the foreign-born population - Germany (%)
Place of birth for the foreign-born population - Netherlands (%)
Place of birth for the foreign-born population - Switzerland (%)
Place of birth for the foreign-born population - Other Western Europe (%)
Place of birth for the foreign-born population - Greece (%)
Place of birth for the foreign-born population - Italy (%)
Place of birth for the foreign-born population - Portugal (%)
Place of birth for the foreign-born population - Spain (%)
Place of birth for the foreign-born population - Other Southern Europe (%)
Place of birth for the foreign-born population - Albania (%)
Place of birth for the foreign-born population - Belarus (%)
Place of birth for the foreign-born population - Bosnia and Herzegovina (%)
Place of birth for the foreign-born population - Bulgaria (%)
Place of birth for the foreign-born population - Croatia (%)
Place of birth for the foreign-born population - Czechoslovakia (%)
Place of birth for the foreign-born population - Hungary (%)
Place of birth for the foreign-born population - Latvia (%)
Place of birth for the foreign-born population - Lithuania (%)
Place of birth for the foreign-born population - North Macedonia (Macedonia) (%)
Place of birth for the foreign-born population - Moldova (%)
Place of birth for the foreign-born population - Poland (%)
Place of birth for the foreign-born population - Romania (%)
Place of birth for the foreign-born population - Russia (%)
Place of birth for the foreign-born population - Serbia (%)
Place of birth for the foreign-born population - Ukraine (%)
Place of birth for the foreign-born population - Other Eastern Europe (%)
Place of birth for the foreign-born population - China (%)
Place of birth for the foreign-born population - Hong Kong (%)
Place of birth for the foreign-born population - Taiwan (%)
Place of birth for the foreign-born population - Japan (%)
Place of birth for the foreign-born population - Korea (%)
Place of birth for the foreign-born population - Other Eastern Asia (%)
Place of birth for the foreign-born population - Afghanistan (%)
Place of birth for the foreign-born population - Bangladesh (%)
Place of birth for the foreign-born population - India (%)
Place of birth for the foreign-born population - Iran (%)
Place of birth for the foreign-born population - Kazakhstan (%)
Place of birth for the foreign-born population - Nepal (%)
Place of birth for the foreign-born population - Pakistan (%)
Place of birth for the foreign-born population - Sri Lanka (%)
Place of birth for the foreign-born population - Uzbekistan (%)
Place of birth for the foreign-born population - Other South Central Asia (%)
Place of birth for the foreign-born population - Burma (%)
Place of birth for the foreign-born population - Cambodia (%)
Place of birth for the foreign-born population - Indonesia (%)
Place of birth for the foreign-born population - Laos (%)
Place of birth for the foreign-born population - Malaysia (%)
Place of birth for the foreign-born population - Philippines (%)
Place of birth for the foreign-born population - Singapore (%)
Place of birth for the foreign-born population - Thailand (%)
Place of birth for the foreign-born population - Vietnam (%)
Place of birth for the foreign-born population - Other South Eastern Asia (%)
Place of birth for the foreign-born population - Armenia (%)
Place of birth for the foreign-born population - Iraq (%)
Place of birth for the foreign-born population - Israel (%)
Place of birth for the foreign-born population - Jordan (%)
Place of birth for the foreign-born population - Kuwait (%)
Place of birth for the foreign-born population - Lebanon (%)
Place of birth for the foreign-born population - Saudi Arabia (%)
Place of birth for the foreign-born population - Syria (%)
Place of birth for the foreign-born population - Turkey (%)
Place of birth for the foreign-born population - Yemen (%)
Place of birth for the foreign-born population - Other Western Asia (%)
Place of birth for the foreign-born population - Eritrea (%)
Place of birth for the foreign-born population - Ethiopia (%)
Place of birth for the foreign-born population - Kenya (%)
Place of birth for the foreign-born population - Somalia (%)
Place of birth for the foreign-born population - Uganda (%)
Place of birth for the foreign-born population - Zimbabwe (%)
Place of birth for the foreign-born population - Other Eastern Africa (%)
Place of birth for the foreign-born population - Cameroon (%)
Place of birth for the foreign-born population - Congo (%)
Place of birth for the foreign-born population - Democratic Republic of Congo (Zaire) (%)
Place of birth for the foreign-born population - Other Middle Africa (%)
Place of birth for the foreign-born population - Egypt (%)
Place of birth for the foreign-born population - Morocco (%)
Place of birth for the foreign-born population - Sudan (%)
Place of birth for the foreign-born population - Other Northern Africa (%)
Place of birth for the foreign-born population - South Africa (%)
Place of birth for the foreign-born population - Other Southern Africa (%)
Place of birth for the foreign-born population - Cabo Verde (%)
Place of birth for the foreign-born population - Ghana (%)
Place of birth for the foreign-born population - Liberia (%)
Place of birth for the foreign-born population - Nigeria (%)
Place of birth for the foreign-born population - Senegal (%)
Place of birth for the foreign-born population - Sierra Leone (%)
Place of birth for the foreign-born population - Other Western Africa (%)
Place of birth for the foreign-born population - Australia (%)
Place of birth for the foreign-born population - New Zealand (%)
Place of birth for the foreign-born population - Fiji (%)
Place of birth for the foreign-born population - Micronesia (%)
Place of birth for the foreign-born population - Bahamas (%)
Place of birth for the foreign-born population - Barbados (%)
Place of birth for the foreign-born population - Cuba (%)
Place of birth for the foreign-born population - Dominica (%)
Place of birth for the foreign-born population - Dominican Republic (%)
Place of birth for the foreign-born population - Grenada (%)
Place of birth for the foreign-born population - Haiti (%)
Place of birth for the foreign-born population - Jamaica (%)
Place of birth for the foreign-born population - St. Vincent and the Grenadines (%)
Place of birth for the foreign-born population - Trinidad and Tobago (%)
Place of birth for the foreign-born population - West Indies (%)
Place of birth for the foreign-born population - Other Caribbean (%)
Place of birth for the foreign-born population - Belize (%)
Place of birth for the foreign-born population - Costa Rica (%)
Place of birth for the foreign-born population - El Salvador (%)
Place of birth for the foreign-born population - Guatemala (%)
Place of birth for the foreign-born population - Honduras (%)
Place of birth for the foreign-born population - Mexico (%)
Place of birth for the foreign-born population - Nicaragua (%)
Place of birth for the foreign-born population - Panama (%)
Place of birth for the foreign-born population - Other Central America (%)
Place of birth for the foreign-born population - Argentina (%)
Place of birth for the foreign-born population - Bolivia (%)
Place of birth for the foreign-born population - Brazil (%)
Place of birth for the foreign-born population - Chile (%)
Place of birth for the foreign-born population - Colombia (%)
Place of birth for the foreign-born population - Ecuador (%)
Place of birth for the foreign-born population - Guyana (%)
Place of birth for the foreign-born population - Peru (%)
Place of birth for the foreign-born population - Uruguay (%)
Place of birth for the foreign-born population - Venezuela (%)
Place of birth for the foreign-born population - Other South America (%)
Place of birth for the foreign-born population - Canada (%)
Place of birth for the foreign-born population - Other Northern America (%)
Place of birth for the foreign-born population - Other (%)
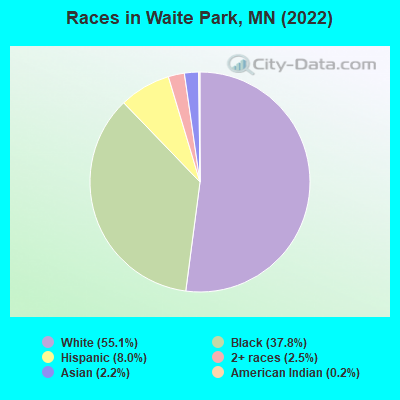
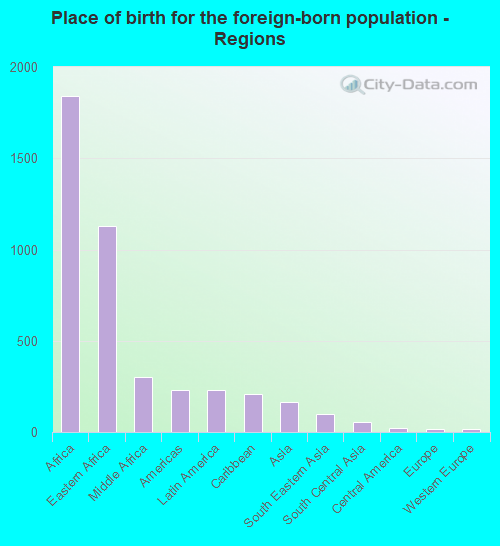
According to 2022 data, the most numerous races in Waite Park, MN are White alone (4,622 residents), Black alone (3,165 residents), and Hispanic (673 residents). 70.4% of Waite Park residents speak English at home. 26.9% of Waite Park, MN residents are foreign-born (21.5% born in Africa), which is 70.3% greater than the foreign-born rate of 8.0% across the entire state of Minnesota.
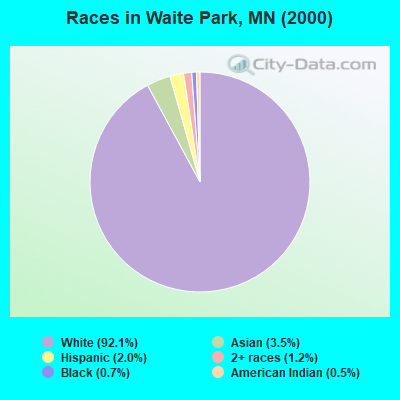
Race distribution in Waite Park
2000 2022
4,337,143 88.2% White alone 168,813 3.4% Black alone 143,382 2.9% Hispanic 141,083 2.9% Asian alone 70,304 1.4% Two or more races 52,009 1.1% American Indian alone 5,031 0.1% Other race alone 1,714 0.03% Native Hawaiian and Other
4,356,347 76.2% White alone 395,179 6.9% Black alone 333,830 5.8% Hispanic 294,800 5.2% Asian alone 259,649 4.5% Two or more races 42,125 0.7% American Indian alone 32,976 0.6% Other race alone 2,278 0.04% Native Hawaiian and Other
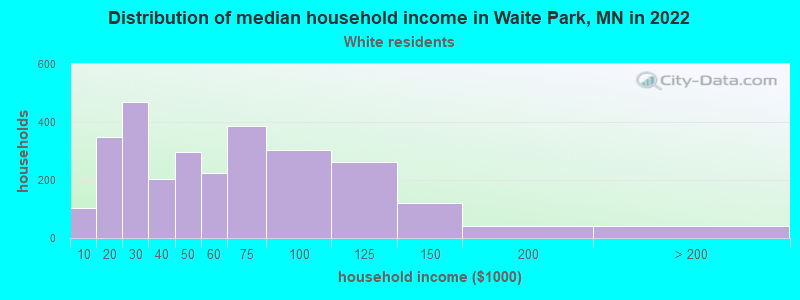
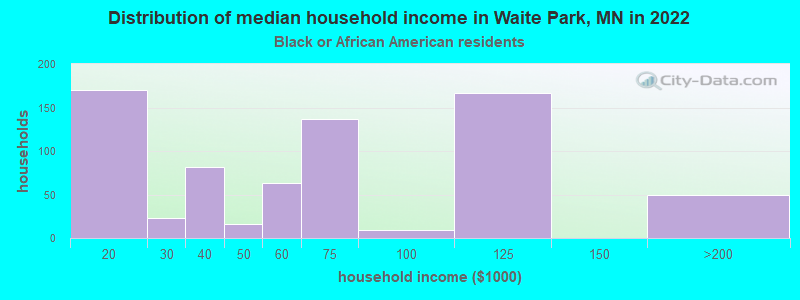
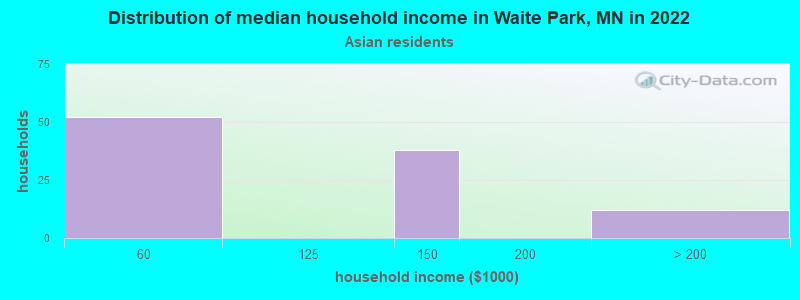
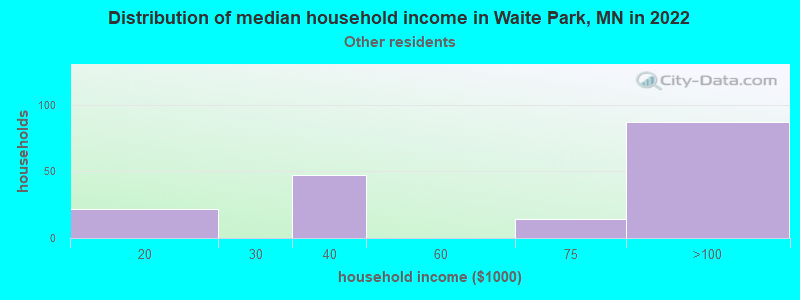
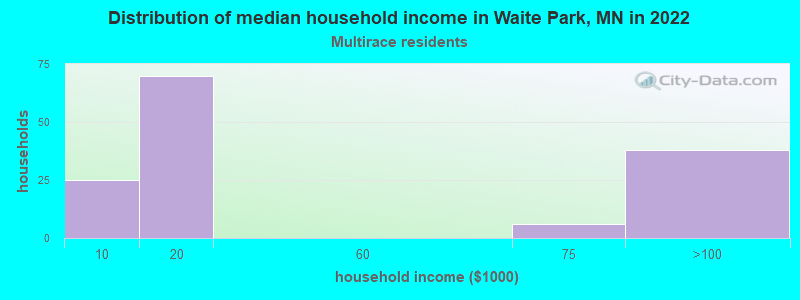
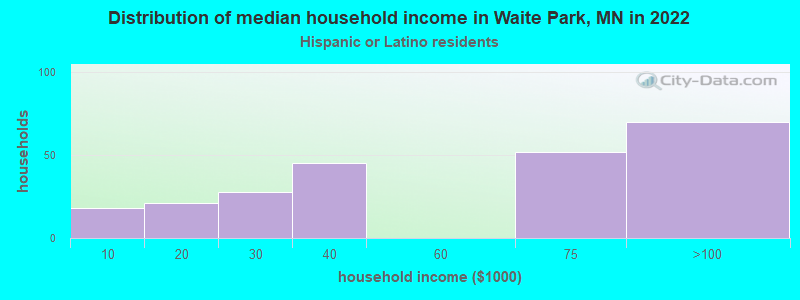
Income and house value in Waite Park Median household income in 2022 $50,129 White non-Hispanic householders$61,701 Black householders$77,463 Hispanic or Latino race householdersMedian 2022 house value $221,202 White Non-Hispanic householders $277,093 Asian householders$383,213 Two or more races householders$200,450 Hispanic or Latino householders
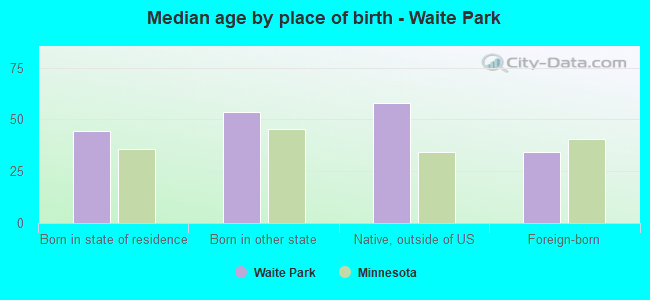
Median age by race in Waite Park
56.1 Median age for White residents56.1 55.9 21.7 Median age for Black or African American residents23.3 18.6 41.2 Median age for American Indian / Alaska Native residents-623,931,623.3 -527,433,627.8 74.4 Median age for Asian residents81.9 87.1 -744,336,568.8 Median age for Native Hawaiian / Pacific Islander residents-666,666,666.0 -534,959,349.1 34.8 Median age for Other race residents37.5 19.4 22.5 Median age for Two or more races residents13.3 52.0 56.7 Median age for White alone residents56.6 56.4 36.3 Median age for Hispanic or Latino residents37.1 32.0
Owner/renter occupied households by race in Waite Park
House owners and renters - White residents 1,453 53.2% Owner occupied1,279 46.8% Renter occupiedHouse owners and renters - Black or African American residents 315 33.7% Owner occupied619 66.3% Renter occupiedHouse owners and renters - American Indian / Alaska Native residents 7 100.0% Renter occupiedHouse owners and renters - Asian residents 104 84.1% Owner occupied20 15.9% Renter occupiedHouse owners and renters - Other race residents 76 40.1% Owner occupied114 59.9% Renter occupiedHouse owners and renters - Two or more races residents 45 48.1% Owner occupied49 51.9% Renter occupiedHouse owners and renters - White alone residents 1,421 54.0% Owner occupied1,211 46.0% Renter occupiedHouse owners and renters - Hispanic or Latino residents 102 31.2% Owner occupied224 68.8% Renter occupied
Language usage in Waite Park
English speakers - Total 70.4% of residents of Waite Park speak English at home.
4.7% of residents speak Spanish at home 174 46.3% Speak English very well202 53.7% Speak English less than very well26.7% of residents speak other language at home 857 40.4% Speak English very well1,266 59.6% Speak English less than very well
English speakers - Born in the United States 89.3% of residents of Waite Park speak English at home.
6.4% of residents speak Spanish at home 59 100.0% Speak English very well9.5% of residents speak other language at home 73 83.0% Speak English very well15 17.0% Speak English less than very well
English speakers - Native, born elsewhere 38.2% of residents of Waite Park speak English at home.
78.8% of residents speak Spanish at home 22 16.9% Speak English very well108 83.1% Speak English less than very well
English speakers - Foreign-born 30.4% of residents of Waite Park speak English at home.
4.3% of residents speak Spanish at home 128 100.0% Speak English less than very well67.9% of residents speak other language at home 751 37.0% Speak English very well1,280 63.0% Speak English less than very well
White (Caucasian) - Speak another language Native:
1.8% (84)Foreign-born:
100.0% (19)
Black or African American - Speak only English Native:
51.8% (249)Foreign-born:
15.6% (398)
Black or African American - Speak another language Native:
25.5% (122)Foreign-born:
63.9% (1,624)
Asian - Speak only English Native:
100.0% (8)Foreign-born:
16.6% (35)
Other race - Speak another language Native:
100.0% (235)Foreign-born:
67.8% (131)
White alone - Speak another language Native:
0.9% (41)Foreign-born:
100.0% (23)
Hispanic or Latino - Speak only English Native:
33.8% (139)Foreign-born:
33.7% (70)
Hispanic or Latino - Speak another language Native:
68.5% (282)Foreign-born:
72.7% (151)
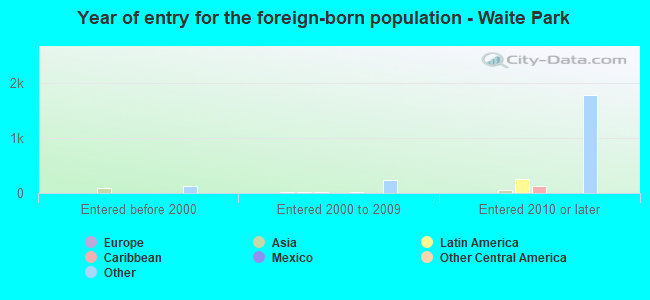
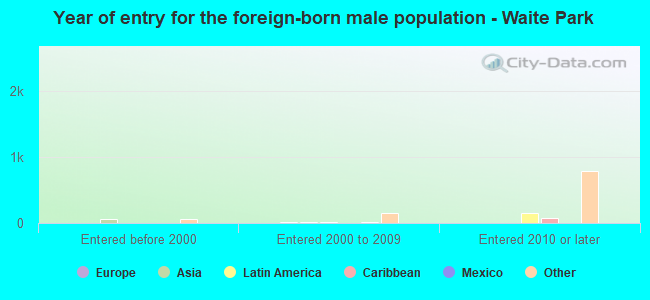
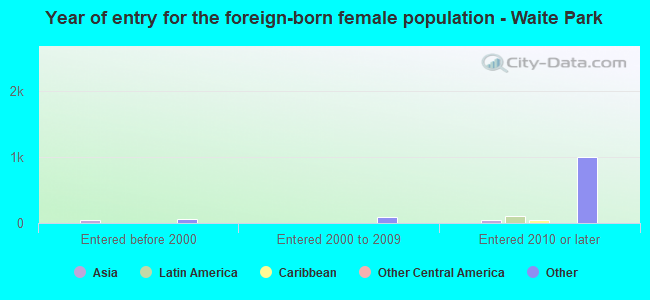
Foreign-born residents in Waite Park 2,257 residents are foreign born (21.5% Africa ).
This city:
26.9%Minnesota:
8.5%
Marital status for residents in Waite Park Marital status - White (Caucasian) population 15 years and over
Males 25.5% Never married53.1% Now married0.3% Separated8.0% Widowed13.1% DivorcedFemales 25.2% Never married47.4% Now married0.0% Separated16.7% Widowed10.7% DivorcedWomen who did not give birth in the past 12 months Now married:
41.2% (408)Unmarried:
58.8% (581)
Marital status - Black or African American population 15 years and over
Males 37.6% Never married55.4% Now married0.0% Separated0.0% Widowed6.9% DivorcedFemales 45.9% Never married49.3% Now married3.8% Separated1.1% Widowed0.0% DivorcedWomen who gave birth in the past 12 months Now married:
100.0% (130)Unmarried:
0.0% (0)
Women who did not give birth in the past 12 months Now married:
40.7% (265)Unmarried:
59.3% (387)
Marital status - American Indian / Alaska Native population 15 years and over
Males 66.7% Never married33.3% Now married0.0% Separated0.0% Widowed0.0% DivorcedFemales 0.0% Never married0.0% Now married0.0% Separated0.0% Widowed100.0% DivorcedMarital status - Asian population 15 years and over
Males 14.6% Never married85.4% Now married0.0% Separated0.0% Widowed0.0% DivorcedFemales 2.4% Never married72.9% Now married0.0% Separated14.1% Widowed10.6% DivorcedWomen who gave birth in the past 12 months Now married:
100.0% (8)Unmarried:
0.0% (0)
Women who did not give birth in the past 12 months Now married:
92.9% (27)Unmarried:
7.1% (2)
Marital status - Other race population 15 years and over
Males 54.6% Never married45.4% Now married0.0% Separated0.0% Widowed0.0% DivorcedFemales 20.8% Never married50.9% Now married0.0% Separated28.3% Widowed0.0% DivorcedWomen who did not give birth in the past 12 months Now married:
71.1% (71)Unmarried:
28.9% (29)
Marital status - Two or more races population 15 years and over
Males 50.0% Never married50.0% Now married0.0% Separated0.0% Widowed0.0% DivorcedFemales 16.5% Never married14.0% Now married0.0% Separated0.0% Widowed69.4% DivorcedWomen who did not give birth in the past 12 months Now married:
37.5% (16)Unmarried:
62.5% (26)
Marital status - White alone, not Hispanic / Latino population 15 years and over
Males 25.9% Never married53.0% Now married0.3% Separated8.1% Widowed12.6% DivorcedFemales 25.3% Never married48.4% Now married0.0% Separated16.1% Widowed10.3% DivorcedWomen who did not give birth in the past 12 months Now married:
40.9% (389)Unmarried:
59.1% (561)
Marital status - Hispanic or Latino population 15 years and over
Males 47.5% Never married47.1% Now married0.0% Separated0.0% Widowed5.5% DivorcedFemales 23.5% Never married33.0% Now married0.0% Separated26.7% Widowed16.7% DivorcedWomen who did not give birth in the past 12 months Now married:
58.4% (77)Unmarried:
41.6% (55)
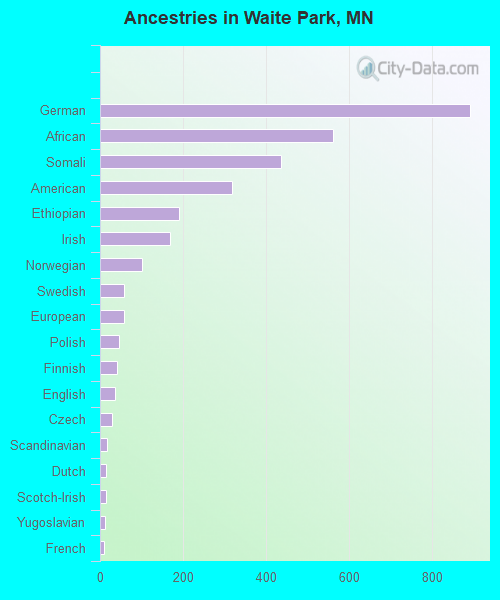
Ancestries in Waite Park
893 21.8% German561 13.7% African436 10.6% Somali319 7.8% American191 4.7% Ethiopian169 4.1% Irish101 2.5% Norwegian59 1.4% Swedish57 1.4% European47 1.1% Polish41 1.0% Finnish35 0.9% English29 0.7% Czech17 0.4% Scandinavian15 0.4% Dutch15 0.4% Scotch-Irish11 0.3% Yugoslavian10 0.2% French
Children Nativity (place of birth) in Waite Park
Children under 6 years - Living with two parents Both parents native 201 100.0% NativeBoth parents foreign-born 143 100.0% NativeChildren under 6 years - Living with one parent Native parent 65 100.0% NativeForeign-born parent 91 100.0% NativeChildren 6 to 17 years - Living with two parents Both parents native 179 88.2% Native24 11.8% Foreign-bornBoth parents foreign-born 153 16.3% Native788 83.7% Foreign-bornChildren 6 to 17 years - Living with one parent Native parent 142 100.0% Foreign-bornForeign-born parent 367 76.9% Native110 23.1% Foreign-born
Grandparents responsible for own grandchildren in Waite Park
Grandparents (30 to 59 years) White / Caucasian 11 100.0% Not responsible for grandchildrenWhite alone, not Hispanic / Latino 11 100.0% Not responsible for grandchildrenGrandparents (60 years and over) White / Caucasian 6 17.7% Responsible for grandchildren27 82.3% Not responsible for grandchildrenWhite alone, not Hispanic / Latino 6 17.8% Responsible for grandchildren28 82.2% Not responsible for grandchildren