Races in Warm Springs-Truckee Canyon, Nevada (NV) Detailed Stats
Ancestries, Foreign-born residents, place of birth
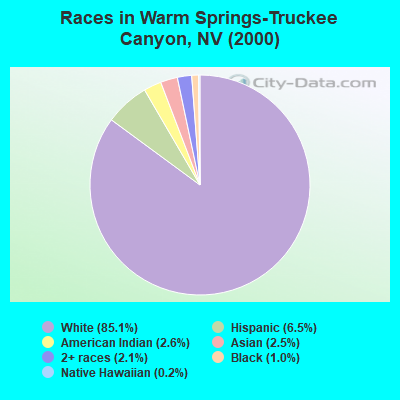
Race distribution in Warm Springs-Truckee Canyon

- 18,76385.1%White alone
- 1,4306.5%Hispanic
- 5682.6%American Indian alone
- 5582.5%Asian alone
- 4582.1%Two or more races
- 2221.0%Black alone
- 400.2%Native Hawaiian and Other
Pacific Islander alone - 150.07%Other race alone
2000
2022
-
- 1,303,00165.2%White alone
- 393,97019.7%Hispanic
- 131,5096.6%Black alone
- 88,5934.4%Asian alone
- 49,2312.5%Two or more races
- 21,3971.1%American Indian alone
- 7,7690.4%Native Hawaiian and Other
Pacific Islander alone - 2,7870.1%Other race alone

-
- 1,410,14544.4%White alone
- 961,35730.3%Hispanic
- 286,4719.0%Black alone
- 281,1498.8%Asian alone
- 182,1515.7%Two or more races
- 20,1020.6%Native Hawaiian and Other
Pacific Islander alone - 18,7810.6%Other race alone
- 17,6160.6%American Indian alone

Income and house value in Warm Springs-Truckee Canyon
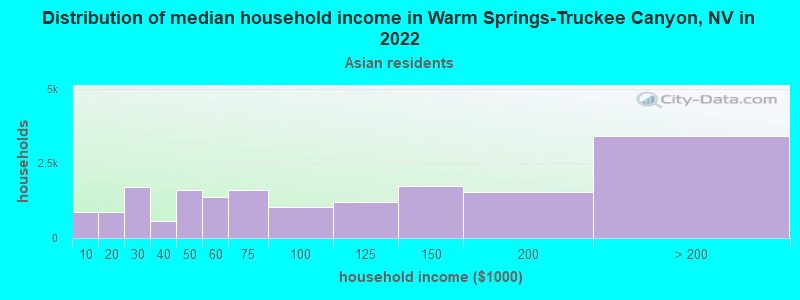
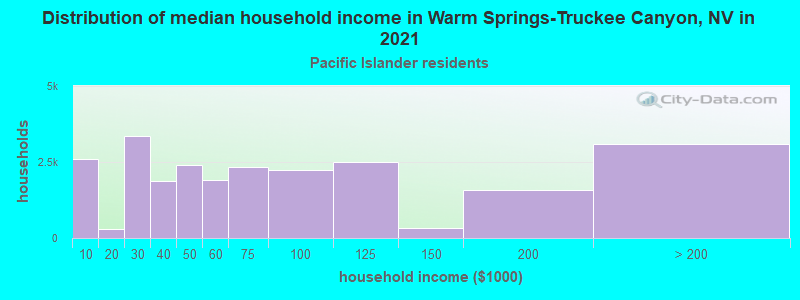
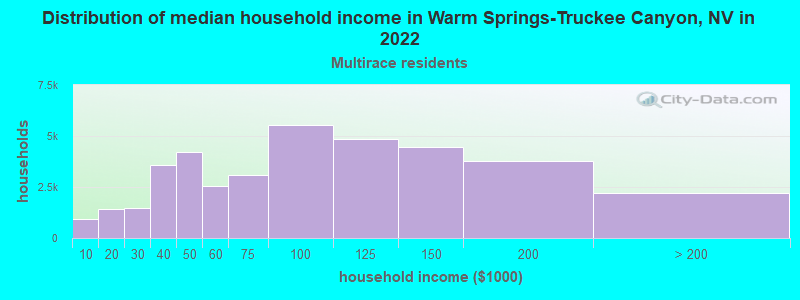
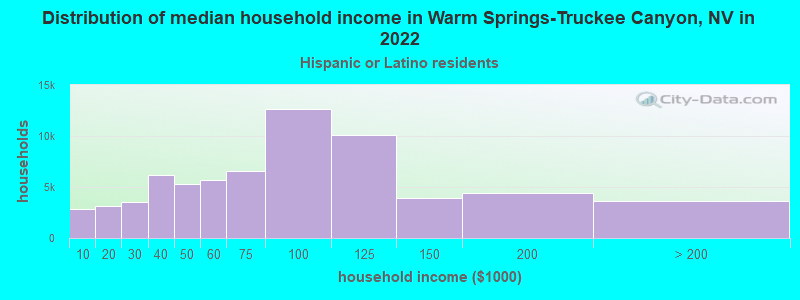
- Median household income in 2022
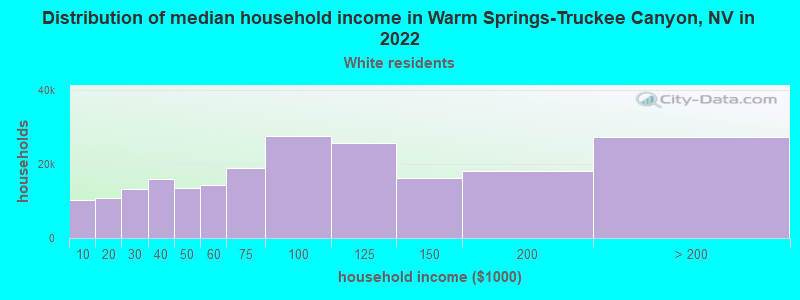
- $118,717White non-Hispanic householders
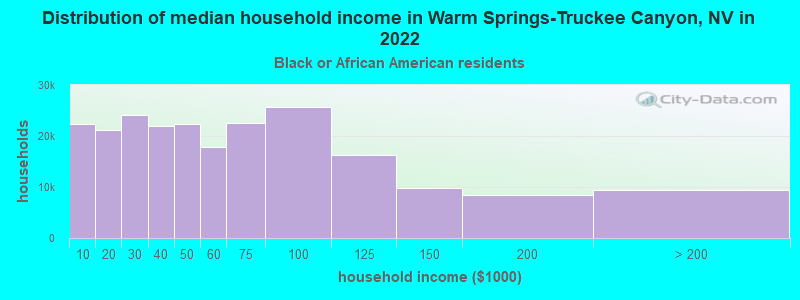
- $114,981Black householders
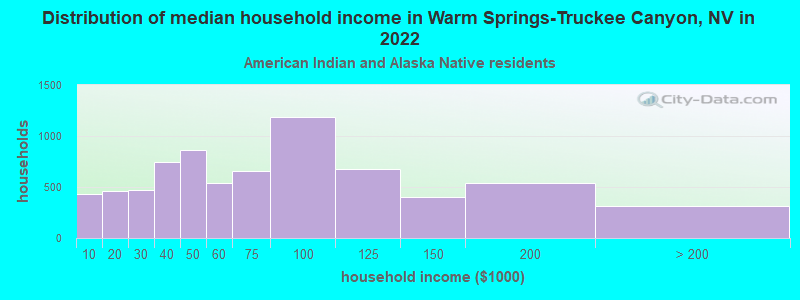
- $78,809American Indian and Alaska Native householders
- $151,302Asian householders
- over $200,000Native Hawaiian and other Pacific Islander householders
- $131,652Some other race householders
- $142,880Two or more races householders
- $143,597Hispanic or Latino race householders
- Median 2022 house value
- $628,674White Non-Hispanic householders
- $607,033Black or African American householders
- $339,881American Indian or Alaska Native householders
- $614,483Asian householders
- $561,620Native Hawaiian and other Pacific Islander householders
- $514,789Some other race householders
- $606,323Two or more races householders
- $591,422Hispanic or Latino householders
Household income for White non-Hispanic householders
Household income for Black householders
Household income for American Indian and Alaska Native householders
Household income for Asian householders
Household income for Native Hawaiian and other Pacific Islander householders
Household income for Two or more races householders
Household income for Hispanic or Latino race householders
Zip code: 89436