Estimated zip code population in 2022: 48,267
Zip code population in 2010: 36,867
Zip code population in 2000: 21,528
Houses and condos: 18,803
Renter-occupied apartments: 4,415
% of renters here:
24%State:
40%
March 2022 cost of living index in zip code 89436: 98.7
(near average, U.S. average is 100)
Land area: 40.8
sq. mi.
Water area: 0.5
sq. mi.
Population density: 1,184 people per square mile (low).
OSM Map
General Map
Google Map
MSN Map
OSM Map
General Map
Google Map
MSN Map
OSM Map
General Map
Google Map
MSN Map
OSM Map
General Map
Google Map
MSN Map
Please wait while loading the map...
Real estate property taxes paid for housing units in 2022:
This zip code:
0.5% ($2,789)Nevada:
0.4% ($1,889)
Median real estate property taxes paid for housing units with mortgages in 2022: $2,804 (0.5%)
Median real estate property taxes paid for housing units with no mortgage in 2022: $2,755 (0.5%)
Profiles of local businesses
Business Search - 14 Million verified businesses
Males: 24,806 Females: 23,456
For population 25 years and over in 89436:
High school or higher: 95.7%Bachelor's degree or higher: 35.1%Graduate or professional degree: 12.0%Unemployed: 3.5%Mean travel time to work (commute): 25.3 minutes
For population 15 years and over in 89436:
Never married: 26.5%Now married: 57.3%Separated: 1.2%Widowed: 4.1%Divorced: 11.0%
Zip code 89436 compared to state average:
Black race population percentage significantly below state average. Foreign-born population percentage below state average. Renting percentage below state average. Length of stay since moving in significantly above state average. House age significantly below state average. 32,942 68.3% White 9,827 20.4% Hispanic or Latino 2,483 5.1% Asian 1,558 3.2% Two or more races 950 2.0% Black 177 0.4% Some other race 161 0.3% American Indian 165 0.3% Native Hawaiian and Other
Data:
Median household income ($)
Median household income (% change since 2000)
Household income diversity
Ratio of average income to average house value (%)
Ratio of average income to average rent
Median household income ($) - White
Median household income ($) - Black or African American
Median household income ($) - Asian
Median household income ($) - Hispanic or Latino
Median household income ($) - American Indian and Alaska Native
Median household income ($) - Multirace
Median household income ($) - Other Race
Median household income for houses/condos with a mortgage ($)
Median household income for apartments without a mortgage ($)
Races - White alone (%)
Races - White alone (% change since 2000)
Races - Black alone (%)
Races - Black alone (% change since 2000)
Races - American Indian alone (%)
Races - American Indian alone (% change since 2000)
Races - Asian alone (%)
Races - Asian alone (% change since 2000)
Races - Hispanic (%)
Races - Hispanic (% change since 2000)
Races - Native Hawaiian and Other Pacific Islander alone (%)
Races - Native Hawaiian and Other Pacific Islander alone (% change since 2000)
Races - Two or more races (%)
Races - Two or more races (% change since 2000)
Races - Other race alone (%)
Races - Other race alone (% change since 2000)
Racial diversity
Unemployment (%)
Unemployment (% change since 2000)
Unemployment (%) - White
Unemployment (%) - Black or African American
Unemployment (%) - Asian
Unemployment (%) - Hispanic or Latino
Unemployment (%) - American Indian and Alaska Native
Unemployment (%) - Multirace
Unemployment (%) - Other Race
Population density (people per square mile)
Population - Males (%)
Population - Females (%)
Population - Males (%) - White
Population - Males (%) - Black or African American
Population - Males (%) - Asian
Population - Males (%) - Hispanic or Latino
Population - Males (%) - American Indian and Alaska Native
Population - Males (%) - Multirace
Population - Males (%) - Other Race
Population - Females (%) - White
Population - Females (%) - Black or African American
Population - Females (%) - Asian
Population - Females (%) - Hispanic or Latino
Population - Females (%) - American Indian and Alaska Native
Population - Females (%) - Multirace
Population - Females (%) - Other Race
Coronavirus confirmed cases (Apr 27, 2024)
Deaths caused by coronavirus (Apr 27, 2024)
Coronavirus confirmed cases (per 100k population) (Apr 27, 2024)
Deaths caused by coronavirus (per 100k population) (Apr 27, 2024)
Daily increase in number of cases (Apr 27, 2024)
Weekly increase in number of cases (Apr 27, 2024)
Cases doubled (in days) (Apr 27, 2024)
Hospitalized patients (Apr 18, 2022)
Negative test results (Apr 18, 2022)
Total test results (Apr 18, 2022)
COVID Vaccine doses distributed (per 100k population) (Sep 19, 2023)
COVID Vaccine doses administered (per 100k population) (Sep 19, 2023)
COVID Vaccine doses distributed (Sep 19, 2023)
COVID Vaccine doses administered (Sep 19, 2023)
Likely homosexual households (%)
Likely homosexual households (% change since 2000)
Likely homosexual households - Lesbian couples (%)
Likely homosexual households - Lesbian couples (% change since 2000)
Likely homosexual households - Gay men (%)
Likely homosexual households - Gay men (% change since 2000)
Cost of living index
Median gross rent ($)
Median contract rent ($)
Median monthly housing costs ($)
Median house or condo value ($)
Median house or condo value ($ change since 2000)
Mean house or condo value by units in structure - 1, detached ($)
Mean house or condo value by units in structure - 1, attached ($)
Mean house or condo value by units in structure - 2 ($)
Mean house or condo value by units in structure by units in structure - 3 or 4 ($)
Mean house or condo value by units in structure - 5 or more ($)
Mean house or condo value by units in structure - Boat, RV, van, etc. ($)
Mean house or condo value by units in structure - Mobile home ($)
Median house or condo value ($) - White
Median house or condo value ($) - Black or African American
Median house or condo value ($) - Asian
Median house or condo value ($) - Hispanic or Latino
Median house or condo value ($) - American Indian and Alaska Native
Median house or condo value ($) - Multirace
Median house or condo value ($) - Other Race
Median resident age
Resident age diversity
Median resident age - Males
Median resident age - Females
Median resident age - White
Median resident age - Black or African American
Median resident age - Asian
Median resident age - Hispanic or Latino
Median resident age - American Indian and Alaska Native
Median resident age - Multirace
Median resident age - Other Race
Median resident age - Males - White
Median resident age - Males - Black or African American
Median resident age - Males - Asian
Median resident age - Males - Hispanic or Latino
Median resident age - Males - American Indian and Alaska Native
Median resident age - Males - Multirace
Median resident age - Males - Other Race
Median resident age - Females - White
Median resident age - Females - Black or African American
Median resident age - Females - Asian
Median resident age - Females - Hispanic or Latino
Median resident age - Females - American Indian and Alaska Native
Median resident age - Females - Multirace
Median resident age - Females - Other Race
Commute - mean travel time to work (minutes)
Travel time to work - Less than 5 minutes (%)
Travel time to work - Less than 5 minutes (% change since 2000)
Travel time to work - 5 to 9 minutes (%)
Travel time to work - 5 to 9 minutes (% change since 2000)
Travel time to work - 10 to 19 minutes (%)
Travel time to work - 10 to 19 minutes (% change since 2000)
Travel time to work - 20 to 29 minutes (%)
Travel time to work - 20 to 29 minutes (% change since 2000)
Travel time to work - 30 to 39 minutes (%)
Travel time to work - 30 to 39 minutes (% change since 2000)
Travel time to work - 40 to 59 minutes (%)
Travel time to work - 40 to 59 minutes (% change since 2000)
Travel time to work - 60 to 89 minutes (%)
Travel time to work - 60 to 89 minutes (% change since 2000)
Travel time to work - 90 or more minutes (%)
Travel time to work - 90 or more minutes (% change since 2000)
Marital status - Never married (%)
Marital status - Now married (%)
Marital status - Separated (%)
Marital status - Widowed (%)
Marital status - Divorced (%)
Median family income ($)
Median family income (% change since 2000)
Median non-family income ($)
Median non-family income (% change since 2000)
Median per capita income ($)
Median per capita income (% change since 2000)
Median family income ($) - White
Median family income ($) - Black or African American
Median family income ($) - Asian
Median family income ($) - Hispanic or Latino
Median family income ($) - American Indian and Alaska Native
Median family income ($) - Multirace
Median family income ($) - Other Race
Median year house/condo built
Median year apartment built
Year house built - Built 2005 or later (%)
Year house built - Built 2000 to 2004 (%)
Year house built - Built 1990 to 1999 (%)
Year house built - Built 1980 to 1989 (%)
Year house built - Built 1970 to 1979 (%)
Year house built - Built 1960 to 1969 (%)
Year house built - Built 1950 to 1959 (%)
Year house built - Built 1940 to 1949 (%)
Year house built - Built 1939 or earlier (%)
Average household size
Household density (households per square mile)
Average household size - White
Average household size - Black or African American
Average household size - Asian
Average household size - Hispanic or Latino
Average household size - American Indian and Alaska Native
Average household size - Multirace
Average household size - Other Race
Occupied housing units (%)
Vacant housing units (%)
Owner occupied housing units (%)
Renter occupied housing units (%)
Vacancy status - For rent (%)
Vacancy status - For sale only (%)
Vacancy status - Rented or sold, not occupied (%)
Vacancy status - For seasonal, recreational, or occasional use (%)
Vacancy status - For migrant workers (%)
Vacancy status - Other vacant (%)
Residents with income below the poverty level (%)
Residents with income below 50% of the poverty level (%)
Children below poverty level (%)
Poor families by family type - Married-couple family (%)
Poor families by family type - Male, no wife present (%)
Poor families by family type - Female, no husband present (%)
Poverty status for native-born residents (%)
Poverty status for foreign-born residents (%)
Poverty among high school graduates not in families (%)
Poverty among people who did not graduate high school not in families (%)
Residents with income below the poverty level (%) - White
Residents with income below the poverty level (%) - Black or African American
Residents with income below the poverty level (%) - Asian
Residents with income below the poverty level (%) - Hispanic or Latino
Residents with income below the poverty level (%) - American Indian and Alaska Native
Residents with income below the poverty level (%) - Multirace
Residents with income below the poverty level (%) - Other Race
Air pollution - Air Quality Index (AQI)
Air pollution - CO
Air pollution - NO2
Air pollution - SO2
Air pollution - Ozone
Air pollution - PM10
Air pollution - PM25
Air pollution - Pb
Crime - Murders per 100,000 population
Crime - Rapes per 100,000 population
Crime - Robberies per 100,000 population
Crime - Assaults per 100,000 population
Crime - Burglaries per 100,000 population
Crime - Thefts per 100,000 population
Crime - Auto thefts per 100,000 population
Crime - Arson per 100,000 population
Crime - City-data.com crime index
Crime - Violent crime index
Crime - Property crime index
Crime - Murders per 100,000 population (5 year average)
Crime - Rapes per 100,000 population (5 year average)
Crime - Robberies per 100,000 population (5 year average)
Crime - Assaults per 100,000 population (5 year average)
Crime - Burglaries per 100,000 population (5 year average)
Crime - Thefts per 100,000 population (5 year average)
Crime - Auto thefts per 100,000 population (5 year average)
Crime - Arson per 100,000 population (5 year average)
Crime - City-data.com crime index (5 year average)
Crime - Violent crime index (5 year average)
Crime - Property crime index (5 year average)
1996 Presidential Elections Results (%) - Democratic Party (Clinton)
1996 Presidential Elections Results (%) - Republican Party (Dole)
1996 Presidential Elections Results (%) - Other
2000 Presidential Elections Results (%) - Democratic Party (Gore)
2000 Presidential Elections Results (%) - Republican Party (Bush)
2000 Presidential Elections Results (%) - Other
2004 Presidential Elections Results (%) - Democratic Party (Kerry)
2004 Presidential Elections Results (%) - Republican Party (Bush)
2004 Presidential Elections Results (%) - Other
2008 Presidential Elections Results (%) - Democratic Party (Obama)
2008 Presidential Elections Results (%) - Republican Party (McCain)
2008 Presidential Elections Results (%) - Other
2012 Presidential Elections Results (%) - Democratic Party (Obama)
2012 Presidential Elections Results (%) - Republican Party (Romney)
2012 Presidential Elections Results (%) - Other
2016 Presidential Elections Results (%) - Democratic Party (Clinton)
2016 Presidential Elections Results (%) - Republican Party (Trump)
2016 Presidential Elections Results (%) - Other
2020 Presidential Elections Results (%) - Democratic Party (Biden)
2020 Presidential Elections Results (%) - Republican Party (Trump)
2020 Presidential Elections Results (%) - Other
Ancestries Reported - Arab (%)
Ancestries Reported - Czech (%)
Ancestries Reported - Danish (%)
Ancestries Reported - Dutch (%)
Ancestries Reported - English (%)
Ancestries Reported - French (%)
Ancestries Reported - French Canadian (%)
Ancestries Reported - German (%)
Ancestries Reported - Greek (%)
Ancestries Reported - Hungarian (%)
Ancestries Reported - Irish (%)
Ancestries Reported - Italian (%)
Ancestries Reported - Lithuanian (%)
Ancestries Reported - Norwegian (%)
Ancestries Reported - Polish (%)
Ancestries Reported - Portuguese (%)
Ancestries Reported - Russian (%)
Ancestries Reported - Scotch-Irish (%)
Ancestries Reported - Scottish (%)
Ancestries Reported - Slovak (%)
Ancestries Reported - Subsaharan African (%)
Ancestries Reported - Swedish (%)
Ancestries Reported - Swiss (%)
Ancestries Reported - Ukrainian (%)
Ancestries Reported - United States (%)
Ancestries Reported - Welsh (%)
Ancestries Reported - West Indian (%)
Ancestries Reported - Other (%)
Educational Attainment - No schooling completed (%)
Educational Attainment - Less than high school (%)
Educational Attainment - High school or equivalent (%)
Educational Attainment - Less than 1 year of college (%)
Educational Attainment - 1 or more years of college (%)
Educational Attainment - Associate degree (%)
Educational Attainment - Bachelor's degree (%)
Educational Attainment - Master's degree (%)
Educational Attainment - Professional school degree (%)
Educational Attainment - Doctorate degree (%)
School Enrollment - Nursery, preschool (%)
School Enrollment - Kindergarten (%)
School Enrollment - Grade 1 to 4 (%)
School Enrollment - Grade 5 to 8 (%)
School Enrollment - Grade 9 to 12 (%)
School Enrollment - College undergrad (%)
School Enrollment - Graduate or professional (%)
School Enrollment - Not enrolled in school (%)
School enrollment - Public schools (%)
School enrollment - Private schools (%)
School enrollment - Not enrolled (%)
Median number of rooms in houses and condos
Median number of rooms in apartments
Housing units lacking complete plumbing facilities (%)
Housing units lacking complete kitchen facilities (%)
Density of houses
Urban houses (%)
Rural houses (%)
Households with people 60 years and over (%)
Households with people 65 years and over (%)
Households with people 75 years and over (%)
Households with one or more nonrelatives (%)
Households with no nonrelatives (%)
Population in households (%)
Family households (%)
Nonfamily households (%)
Population in families (%)
Family households with own children (%)
Median number of bedrooms in owner occupied houses
Mean number of bedrooms in owner occupied houses
Median number of bedrooms in renter occupied houses
Mean number of bedrooms in renter occupied houses
Median number of vehichles in owner occupied houses
Mean number of vehichles in owner occupied houses
Median number of vehichles in renter occupied houses
Mean number of vehichles in renter occupied houses
Mortgage status - with mortgage (%)
Mortgage status - with second mortgage (%)
Mortgage status - with home equity loan (%)
Mortgage status - with both second mortgage and home equity loan (%)
Mortgage status - without a mortgage (%)
Average family size
Average family size - White
Average family size - Black or African American
Average family size - Asian
Average family size - Hispanic or Latino
Average family size - American Indian and Alaska Native
Average family size - Multirace
Average family size - Other Race
Geographical mobility - Same house 1 year ago (%)
Geographical mobility - Moved within same county (%)
Geographical mobility - Moved from different county within same state (%)
Geographical mobility - Moved from different state (%)
Geographical mobility - Moved from abroad (%)
Place of birth - Born in state of residence (%)
Place of birth - Born in other state (%)
Place of birth - Native, outside of US (%)
Place of birth - Foreign born (%)
Housing units in structures - 1, detached (%)
Housing units in structures - 1, attached (%)
Housing units in structures - 2 (%)
Housing units in structures - 3 or 4 (%)
Housing units in structures - 5 to 9 (%)
Housing units in structures - 10 to 19 (%)
Housing units in structures - 20 to 49 (%)
Housing units in structures - 50 or more (%)
Housing units in structures - Mobile home (%)
Housing units in structures - Boat, RV, van, etc. (%)
House/condo owner moved in on average (years ago)
Renter moved in on average (years ago)
Year householder moved into unit - Moved in 1999 to March 2000 (%)
Year householder moved into unit - Moved in 1995 to 1998 (%)
Year householder moved into unit - Moved in 1990 to 1994 (%)
Year householder moved into unit - Moved in 1980 to 1989 (%)
Year householder moved into unit - Moved in 1970 to 1979 (%)
Year householder moved into unit - Moved in 1969 or earlier (%)
Means of transportation to work - Drove car alone (%)
Means of transportation to work - Carpooled (%)
Means of transportation to work - Public transportation (%)
Means of transportation to work - Bus or trolley bus (%)
Means of transportation to work - Streetcar or trolley car (%)
Means of transportation to work - Subway or elevated (%)
Means of transportation to work - Railroad (%)
Means of transportation to work - Ferryboat (%)
Means of transportation to work - Taxicab (%)
Means of transportation to work - Motorcycle (%)
Means of transportation to work - Bicycle (%)
Means of transportation to work - Walked (%)
Means of transportation to work - Other means (%)
Working at home (%)
Industry diversity
Most Common Industries - Agriculture, forestry, fishing and hunting, and mining (%)
Most Common Industries - Agriculture, forestry, fishing and hunting (%)
Most Common Industries - Mining, quarrying, and oil and gas extraction (%)
Most Common Industries - Construction (%)
Most Common Industries - Manufacturing (%)
Most Common Industries - Wholesale trade (%)
Most Common Industries - Retail trade (%)
Most Common Industries - Transportation and warehousing, and utilities (%)
Most Common Industries - Transportation and warehousing (%)
Most Common Industries - Utilities (%)
Most Common Industries - Information (%)
Most Common Industries - Finance and insurance, and real estate and rental and leasing (%)
Most Common Industries - Finance and insurance (%)
Most Common Industries - Real estate and rental and leasing (%)
Most Common Industries - Professional, scientific, and management, and administrative and waste management services (%)
Most Common Industries - Professional, scientific, and technical services (%)
Most Common Industries - Management of companies and enterprises (%)
Most Common Industries - Administrative and support and waste management services (%)
Most Common Industries - Educational services, and health care and social assistance (%)
Most Common Industries - Educational services (%)
Most Common Industries - Health care and social assistance (%)
Most Common Industries - Arts, entertainment, and recreation, and accommodation and food services (%)
Most Common Industries - Arts, entertainment, and recreation (%)
Most Common Industries - Accommodation and food services (%)
Most Common Industries - Other services, except public administration (%)
Most Common Industries - Public administration (%)
Occupation diversity
Most Common Occupations - Management, business, science, and arts occupations (%)
Most Common Occupations - Management, business, and financial occupations (%)
Most Common Occupations - Management occupations (%)
Most Common Occupations - Business and financial operations occupations (%)
Most Common Occupations - Computer, engineering, and science occupations (%)
Most Common Occupations - Computer and mathematical occupations (%)
Most Common Occupations - Architecture and engineering occupations (%)
Most Common Occupations - Life, physical, and social science occupations (%)
Most Common Occupations - Education, legal, community service, arts, and media occupations (%)
Most Common Occupations - Community and social service occupations (%)
Most Common Occupations - Legal occupations (%)
Most Common Occupations - Education, training, and library occupations (%)
Most Common Occupations - Arts, design, entertainment, sports, and media occupations (%)
Most Common Occupations - Healthcare practitioners and technical occupations (%)
Most Common Occupations - Health diagnosing and treating practitioners and other technical occupations (%)
Most Common Occupations - Health technologists and technicians (%)
Most Common Occupations - Service occupations (%)
Most Common Occupations - Healthcare support occupations (%)
Most Common Occupations - Protective service occupations (%)
Most Common Occupations - Fire fighting and prevention, and other protective service workers including supervisors (%)
Most Common Occupations - Law enforcement workers including supervisors (%)
Most Common Occupations - Food preparation and serving related occupations (%)
Most Common Occupations - Building and grounds cleaning and maintenance occupations (%)
Most Common Occupations - Personal care and service occupations (%)
Most Common Occupations - Sales and office occupations (%)
Most Common Occupations - Sales and related occupations (%)
Most Common Occupations - Office and administrative support occupations (%)
Most Common Occupations - Natural resources, construction, and maintenance occupations (%)
Most Common Occupations - Farming, fishing, and forestry occupations (%)
Most Common Occupations - Construction and extraction occupations (%)
Most Common Occupations - Installation, maintenance, and repair occupations (%)
Most Common Occupations - Production, transportation, and material moving occupations (%)
Most Common Occupations - Production occupations (%)
Most Common Occupations - Transportation occupations (%)
Most Common Occupations - Material moving occupations (%)
People in Group quarters - Institutionalized population (%)
People in Group quarters - Correctional institutions (%)
People in Group quarters - Federal prisons and detention centers (%)
People in Group quarters - Halfway houses (%)
People in Group quarters - Local jails and other confinement facilities (including police lockups) (%)
People in Group quarters - Military disciplinary barracks (%)
People in Group quarters - State prisons (%)
People in Group quarters - Other types of correctional institutions (%)
People in Group quarters - Nursing homes (%)
People in Group quarters - Hospitals/wards, hospices, and schools for the handicapped (%)
People in Group quarters - Hospitals/wards and hospices for chronically ill (%)
People in Group quarters - Hospices or homes for chronically ill (%)
People in Group quarters - Military hospitals or wards for chronically ill (%)
People in Group quarters - Other hospitals or wards for chronically ill (%)
People in Group quarters - Hospitals or wards for drug/alcohol abuse (%)
People in Group quarters - Mental (Psychiatric) hospitals or wards (%)
People in Group quarters - Schools, hospitals, or wards for the mentally retarded (%)
People in Group quarters - Schools, hospitals, or wards for the physically handicapped (%)
People in Group quarters - Institutions for the deaf (%)
People in Group quarters - Institutions for the blind (%)
People in Group quarters - Orthopedic wards and institutions for the physically handicapped (%)
People in Group quarters - Wards in general hospitals for patients who have no usual home elsewhere (%)
People in Group quarters - Wards in military hospitals for patients who have no usual home elsewhere (%)
People in Group quarters - Juvenile institutions (%)
People in Group quarters - Long-term care (%)
People in Group quarters - Homes for abused, dependent, and neglected children (%)
People in Group quarters - Residential treatment centers for emotionally disturbed children (%)
People in Group quarters - Training schools for juvenile delinquents (%)
People in Group quarters - Short-term care, detention or diagnostic centers for delinquent children (%)
People in Group quarters - Type of juvenile institution unknown (%)
People in Group quarters - Noninstitutionalized population (%)
People in Group quarters - College dormitories (includes college quarters off campus) (%)
People in Group quarters - Military quarters (%)
People in Group quarters - On base (%)
People in Group quarters - Barracks, unaccompanied personnel housing (UPH), (Enlisted/Officer), ;and similar group living quarters for military personnel (%)
People in Group quarters - Transient quarters for temporary residents (%)
People in Group quarters - Military ships (%)
People in Group quarters - Group homes (%)
People in Group quarters - Homes or halfway houses for drug/alcohol abuse (%)
People in Group quarters - Homes for the mentally ill (%)
People in Group quarters - Homes for the mentally retarded (%)
People in Group quarters - Homes for the physically handicapped (%)
People in Group quarters - Other group homes (%)
People in Group quarters - Religious group quarters (%)
People in Group quarters - Dormitories (%)
People in Group quarters - Agriculture workers' dormitories on farms (%)
People in Group quarters - Job Corps and vocational training facilities (%)
People in Group quarters - Other workers' dormitories (%)
People in Group quarters - Crews of maritime vessels (%)
People in Group quarters - Other nonhousehold living situations (%)
People in Group quarters - Other noninstitutional group quarters (%)
Residents speaking English at home (%)
Residents speaking English at home - Born in the United States (%)
Residents speaking English at home - Native, born elsewhere (%)
Residents speaking English at home - Foreign born (%)
Residents speaking Spanish at home (%)
Residents speaking Spanish at home - Born in the United States (%)
Residents speaking Spanish at home - Native, born elsewhere (%)
Residents speaking Spanish at home - Foreign born (%)
Residents speaking other language at home (%)
Residents speaking other language at home - Born in the United States (%)
Residents speaking other language at home - Native, born elsewhere (%)
Residents speaking other language at home - Foreign born (%)
Class of Workers - Employee of private company (%)
Class of Workers - Self-employed in own incorporated business (%)
Class of Workers - Private not-for-profit wage and salary workers (%)
Class of Workers - Local government workers (%)
Class of Workers - State government workers (%)
Class of Workers - Federal government workers (%)
Class of Workers - Self-employed workers in own not incorporated business and Unpaid family workers (%)
House heating fuel used in houses and condos - Utility gas (%)
House heating fuel used in houses and condos - Bottled, tank, or LP gas (%)
House heating fuel used in houses and condos - Electricity (%)
House heating fuel used in houses and condos - Fuel oil, kerosene, etc. (%)
House heating fuel used in houses and condos - Coal or coke (%)
House heating fuel used in houses and condos - Wood (%)
House heating fuel used in houses and condos - Solar energy (%)
House heating fuel used in houses and condos - Other fuel (%)
House heating fuel used in houses and condos - No fuel used (%)
House heating fuel used in apartments - Utility gas (%)
House heating fuel used in apartments - Bottled, tank, or LP gas (%)
House heating fuel used in apartments - Electricity (%)
House heating fuel used in apartments - Fuel oil, kerosene, etc. (%)
House heating fuel used in apartments - Coal or coke (%)
House heating fuel used in apartments - Wood (%)
House heating fuel used in apartments - Solar energy (%)
House heating fuel used in apartments - Other fuel (%)
House heating fuel used in apartments - No fuel used (%)
Armed forces status - In Armed Forces (%)
Armed forces status - Civilian (%)
Armed forces status - Civilian - Veteran (%)
Armed forces status - Civilian - Nonveteran (%)
Fatal accidents locations in years 2005-2021
Fatal accidents locations in 2005
Fatal accidents locations in 2006
Fatal accidents locations in 2007
Fatal accidents locations in 2008
Fatal accidents locations in 2009
Fatal accidents locations in 2010
Fatal accidents locations in 2011
Fatal accidents locations in 2012
Fatal accidents locations in 2013
Fatal accidents locations in 2014
Fatal accidents locations in 2015
Fatal accidents locations in 2016
Fatal accidents locations in 2017
Fatal accidents locations in 2018
Fatal accidents locations in 2019
Fatal accidents locations in 2020
Fatal accidents locations in 2021
Alcohol use - People drinking some alcohol every month (%)
Alcohol use - People not drinking at all (%)
Alcohol use - Average days/month drinking alcohol
Alcohol use - Average drinks/week
Alcohol use - Average days/year people drink much
Audiometry - Average condition of hearing (%)
Audiometry - People that can hear a whisper from across a quiet room (%)
Audiometry - People that can hear normal voice from across a quiet room (%)
Audiometry - Ears ringing, roaring, buzzing (%)
Audiometry - Had a job exposure to loud noise (%)
Audiometry - Had off-work exposure to loud noise (%)
Blood Pressure & Cholesterol - Has high blood pressure (%)
Blood Pressure & Cholesterol - Checking blood pressure at home (%)
Blood Pressure & Cholesterol - Frequently checking blood cholesterol (%)
Blood Pressure & Cholesterol - Has high cholesterol level (%)
Consumer Behavior - Money monthly spent on food at supermarket/grocery store
Consumer Behavior - Money monthly spent on food at other stores
Consumer Behavior - Money monthly spent on eating out
Consumer Behavior - Money monthly spent on carryout/delivered foods
Consumer Behavior - Income spent on food at supermarket/grocery store (%)
Consumer Behavior - Income spent on food at other stores (%)
Consumer Behavior - Income spent on eating out (%)
Consumer Behavior - Income spent on carryout/delivered foods (%)
Current Health Status - General health condition (%)
Current Health Status - Blood donors (%)
Current Health Status - Has blood ever tested for HIV virus (%)
Current Health Status - Left-handed people (%)
Dermatology - People using sunscreen (%)
Diabetes - Diabetics (%)
Diabetes - Had a blood test for high blood sugar (%)
Diabetes - People taking insulin (%)
Diet Behavior & Nutrition - Diet health (%)
Diet Behavior & Nutrition - Milk product consumption (# of products/month)
Diet Behavior & Nutrition - Meals not home prepared (#/week)
Diet Behavior & Nutrition - Meals from fast food or pizza place (#/week)
Diet Behavior & Nutrition - Ready-to-eat foods (#/month)
Diet Behavior & Nutrition - Frozen meals/pizza (#/month)
Drug Use - People that ever used marijuana or hashish (%)
Drug Use - Ever used hard drugs (%)
Drug Use - Ever used any form of cocaine (%)
Drug Use - Ever used heroin (%)
Drug Use - Ever used methamphetamine (%)
Health Insurance - People covered by health insurance (%)
Kidney Conditions-Urology - Avg. # of times urinating at night
Medical Conditions - People with asthma (%)
Medical Conditions - People with anemia (%)
Medical Conditions - People with psoriasis (%)
Medical Conditions - People with overweight (%)
Medical Conditions - Elderly people having difficulties in thinking or remembering (%)
Medical Conditions - People who ever received blood transfusion (%)
Medical Conditions - People having trouble seeing even with glass/contacts (%)
Medical Conditions - People with arthritis (%)
Medical Conditions - People with gout (%)
Medical Conditions - People with congestive heart failure (%)
Medical Conditions - People with coronary heart disease (%)
Medical Conditions - People with angina pectoris (%)
Medical Conditions - People who ever had heart attack (%)
Medical Conditions - People who ever had stroke (%)
Medical Conditions - People with emphysema (%)
Medical Conditions - People with thyroid problem (%)
Medical Conditions - People with chronic bronchitis (%)
Medical Conditions - People with any liver condition (%)
Medical Conditions - People who ever had cancer or malignancy (%)
Mental Health - People who have little interest in doing things (%)
Mental Health - People feeling down, depressed, or hopeless (%)
Mental Health - People who have trouble sleeping or sleeping too much (%)
Mental Health - People feeling tired or having little energy (%)
Mental Health - People with poor appetite or overeating (%)
Mental Health - People feeling bad about themself (%)
Mental Health - People who have trouble concentrating on things (%)
Mental Health - People moving or speaking slowly or too fast (%)
Mental Health - People having thoughts they would be better off dead (%)
Oral Health - Average years since last visit a dentist
Oral Health - People embarrassed because of mouth (%)
Oral Health - People with gum disease (%)
Oral Health - General health of teeth and gums (%)
Oral Health - Average days a week using dental floss/device
Oral Health - Average days a week using mouthwash for dental problem
Oral Health - Average number of teeth
Pesticide Use - Households using pesticides to control insects (%)
Pesticide Use - Households using pesticides to kill weeds (%)
Physical Activity - People doing vigorous-intensity work activities (%)
Physical Activity - People doing moderate-intensity work activities (%)
Physical Activity - People walking or bicycling (%)
Physical Activity - People doing vigorous-intensity recreational activities (%)
Physical Activity - People doing moderate-intensity recreational activities (%)
Physical Activity - Average hours a day doing sedentary activities
Physical Activity - Average hours a day watching TV or videos
Physical Activity - Average hours a day using computer
Physical Functioning - People having limitations keeping them from working (%)
Physical Functioning - People limited in amount of work they can do (%)
Physical Functioning - People that need special equipment to walk (%)
Physical Functioning - People experiencing confusion/memory problems (%)
Physical Functioning - People requiring special healthcare equipment (%)
Prescription Medications - Average number of prescription medicines taking
Preventive Aspirin Use - Adults 40+ taking low-dose aspirin (%)
Reproductive Health - Vaginal deliveries (%)
Reproductive Health - Cesarean deliveries (%)
Reproductive Health - Deliveries resulted in a live birth (%)
Reproductive Health - Pregnancies resulted in a delivery (%)
Reproductive Health - Women breastfeeding newborns (%)
Reproductive Health - Women that had a hysterectomy (%)
Reproductive Health - Women that had both ovaries removed (%)
Reproductive Health - Women that have ever taken birth control pills (%)
Reproductive Health - Women taking birth control pills (%)
Reproductive Health - Women that have ever used Depo-Provera or injectables (%)
Reproductive Health - Women that have ever used female hormones (%)
Sexual Behavior - People 18+ that ever had sex (vaginal, anal, or oral) (%)
Sexual Behavior - Males 18+ that ever had vaginal sex with a woman (%)
Sexual Behavior - Males 18+ that ever performed oral sex on a woman (%)
Sexual Behavior - Males 18+ that ever had anal sex with a woman (%)
Sexual Behavior - Males 18+ that ever had any sex with a man (%)
Sexual Behavior - Females 18+ that ever had vaginal sex with a man (%)
Sexual Behavior - Females 18+ that ever performed oral sex on a man (%)
Sexual Behavior - Females 18+ that ever had anal sex with a man (%)
Sexual Behavior - Females 18+ that ever had any kind of sex with a woman (%)
Sexual Behavior - Average age people first had sex
Sexual Behavior - Average number of female sex partners in lifetime (males 18+)
Sexual Behavior - Average number of female vaginal sex partners in lifetime (males 18+)
Sexual Behavior - Average age people first performed oral sex on a woman (18+)
Sexual Behavior - Average number of woman performed oral sex on in lifetime (18+)
Sexual Behavior - Average number of male sex partners in lifetime (males 18+)
Sexual Behavior - Average number of male anal sex partners in lifetime (males 18+)
Sexual Behavior - Average age people first performed oral sex on a man (18+)
Sexual Behavior - Average number of male oral sex partners in lifetime (18+)
Sexual Behavior - People using protection when performing oral sex (%)
Sexual Behavior - Average number of times people have vaginal or anal sex a year
Sexual Behavior - People having sex without condom (%)
Sexual Behavior - Average number of male sex partners in lifetime (females 18+)
Sexual Behavior - Average number of male vaginal sex partners in lifetime (females 18+)
Sexual Behavior - Average number of female sex partners in lifetime (females 18+)
Sexual Behavior - Circumcised males 18+ (%)
Sleep Disorders - Average hours sleeping at night
Sleep Disorders - People that has trouble sleeping (%)
Smoking-Cigarette Use - People smoking cigarettes (%)
Taste & Smell - People 40+ having problems with smell (%)
Taste & Smell - People 40+ having problems with taste (%)
Taste & Smell - People 40+ that ever had wisdom teeth removed (%)
Taste & Smell - People 40+ that ever had tonsils teeth removed (%)
Taste & Smell - People 40+ that ever had a loss of consciousness because of a head injury (%)
Taste & Smell - People 40+ that ever had a broken nose or other serious injury to face or skull (%)
Taste & Smell - People 40+ that ever had two or more sinus infections (%)
Weight - Average height (inches)
Weight - Average weight (pounds)
Weight - Average BMI
Weight - People that are obese (%)
Weight - People that ever were obese (%)
Weight - People trying to lose weight (%)
Urban population: 43,717
Rural population: 4,549
Estimated median house/condo value in 2022: $560,528
89436:
$560,528Nevada:
$434,700
According to our research of Nevada and other state lists, there were 62 registered sex offenders living in 89436 zip code as of April 27, 2024 . The ratio of all residents to sex offenders in zip code 89436 is 653 to 1.The ratio of registered sex offenders to all residents in this zip code is lower than the state average.
Median resident age: This zip code:
39.9 yearsNevada median age:
39.0 years
Average household size: This zip code:
2.7 peopleNevada:
2.6 people
Averages for the 2020 tax year for zip code 89436, filed in 2021:
Average Adjusted Gross Income (AGI) in 2020: $85,282 (Individual Income Tax Returns) Here:
$85,282State:
$78,964
Salary/wage: $71,604 (reported on 82.5% of returns )Here:
$71,604State:
$54,472
(% of AGI for various income ranges: 1226.6% for AGIs below $25k , 3565.5% for AGIs $25k-50k , 6349.7% for AGIs $50k-75k , 9185.3% for AGIs $75k-100k , 17778.6% for AGIs $100k-200k , 64982.6% for AGIs over 200k ) Taxable interest for individuals: $1,694 (reported on 30.1% of returns )This zip code:
$1,694Nevada:
$3,521
(% of AGI for various income ranges: 20.4% for AGIs below $25k , 23.0% for AGIs $25k-50k , 36.8% for AGIs $50k-75k , 48.0% for AGIs $75k-100k , 94.2% for AGIs $100k-200k , 1207.2% for AGIs over 200k ) Ordinary dividends: $4,865 (reported on 19.7% of returns )(% of AGI for various income ranges: 30.5% for AGIs below $25k , 40.1% for AGIs $25k-50k , 77.7% for AGIs $50k-75k , 92.8% for AGIs $75k-100k , 205.2% for AGIs $100k-200k , 2111.5% for AGIs over 200k ) Net capital gain/loss in AGI: +$17,996 (reported on 20.2% of returns )Here:
+$17,996State:
+$63,025
(% of AGI for various income ranges: 8.8% for AGIs below $25k , 29.0% for AGIs $25k-50k , 83.8% for AGIs $50k-75k , 126.1% for AGIs $75k-100k , 470.8% for AGIs $100k-200k , 14272.0% for AGIs over 200k ) Profit/loss from business: +$15,599 (reported on 12.4% of returns )Here:
+$15,599State:
+$11,500
(% of AGI for various income ranges: 71.9% for AGIs below $25k , 94.7% for AGIs $25k-50k , 187.2% for AGIs $50k-75k , 224.3% for AGIs $75k-100k , 440.8% for AGIs $100k-200k , 3536.5% for AGIs over 200k ) Taxable individual retirement arrangement distribution: $20,484 (reported on 10.4% of returns )89436:
$20,484Nevada:
$23,628
(% of AGI for various income ranges: 81.1% for AGIs below $25k , 134.2% for AGIs $25k-50k , 217.0% for AGIs $50k-75k , 371.6% for AGIs $75k-100k , 643.7% for AGIs $100k-200k , 1847.6% for AGIs over 200k ) Self-employed (Keogh) retirement plans: $20,125 (reported on 0.3% of returns )89436:
$20,125Nevada:
$26,634
(% of AGI for various income ranges: 5.6% for AGIs $25k-50k , 11.7% for AGIs $100k-200k , 222.8% for AGIs over 200k ) Total itemized deductions: $34,009 (reported on 11.2% of returns )Here:
$34,009State:
$44,173
(% of AGI for various income ranges: 72.3% for AGIs below $25k , 155.1% for AGIs $25k-50k , 367.5% for AGIs $50k-75k , 523.5% for AGIs $75k-100k , 930.4% for AGIs $100k-200k , 6965.2% for AGIs over 200k ) Charity contributions: $7,403 (reported on 8.3% of returns )(% of AGI for various income ranges: 3.1% for AGIs below $25k , 14.4% for AGIs $25k-50k , 38.3% for AGIs $50k-75k , 58.2% for AGIs $75k-100k , 179.4% for AGIs $100k-200k , 1332.2% for AGIs over 200k ) Taxes paid: $5,964 (reported on 11.1% of returns )(% of AGI for various income ranges: 11.8% for AGIs below $25k , 25.7% for AGIs $25k-50k , 70.7% for AGIs $50k-75k , 107.5% for AGIs $75k-100k , 191.5% for AGIs $100k-200k , 896.1% for AGIs over 200k ) Earned income credit: $1,972 (reported on 7.5% of returns )(% of AGI for various income ranges: 56.5% for AGIs below $25k , 38.0% for AGIs $25k-50k , 0.9% for AGIs $50k-75k ) Percentage of individuals using paid preparers for their 2020 taxes: 94.2%(% for various income ranges: 92.5% for AGIs below $25k , 94.6% for AGIs $25k-50k , 94.4% for AGIs $50k-75k , 94.2% for AGIs $75k-100k , 94.9% for AGIs $100k-200k , 95.2% for AGIs over 200k )
Averages for the 2012 tax year for zip code 89436, filed in 2013:
Average Adjusted Gross Income (AGI) in 2012: $65,795 (Individual Income Tax Returns) Here:
$65,795State:
$61,164
Salary/wage: $57,191 (reported on 84.6% of returns )Here:
$57,191State:
$45,924
(% of AGI for various income ranges: 73.4% for AGIs below $25k , 76.9% for AGIs $25k-50k , 76.2% for AGIs $50k-75k , 78.0% for AGIs $75k-100k , 77.3% for AGIs $100k-200k , 51.0% for AGIs over 200k ) Taxable interest for individuals: $1,260 (reported on 33.6% of returns )This zip code:
$1,260Nevada:
$3,137
(% of AGI for various income ranges: 1.4% for AGIs below $25k , 0.6% for AGIs $25k-50k , 0.7% for AGIs $50k-75k , 0.5% for AGIs $75k-100k , 0.5% for AGIs $100k-200k , 1.0% for AGIs over 200k ) Ordinary dividends: $4,547 (reported on 20.0% of returns )(% of AGI for various income ranges: 3.1% for AGIs below $25k , 1.5% for AGIs $25k-50k , 0.8% for AGIs $50k-75k , 0.7% for AGIs $75k-100k , 1.1% for AGIs $100k-200k , 3.0% for AGIs over 200k ) Net capital gain/loss in AGI: +$8,026 (reported on 15.7% of returns )Here:
+$8,026State:
+$33,127
(% of AGI for various income ranges: 0.4% for AGIs $50k-75k , 0.4% for AGIs $75k-100k , 1.1% for AGIs $100k-200k , 10.4% for AGIs over 200k ) Profit/loss from business: +$12,965 (reported on 13.5% of returns )Here:
+$12,965State:
+$12,567
(% of AGI for various income ranges: 5.2% for AGIs below $25k , 3.4% for AGIs $25k-50k , 2.5% for AGIs $50k-75k , 1.9% for AGIs $75k-100k , 2.1% for AGIs $100k-200k , 3.9% for AGIs over 200k ) Taxable individual retirement arrangement distribution: $18,279 (reported on 10.8% of returns )89436:
$18,279Nevada:
$20,808
(% of AGI for various income ranges: 3.6% for AGIs below $25k , 3.1% for AGIs $25k-50k , 2.7% for AGIs $50k-75k , 3.0% for AGIs $75k-100k , 3.2% for AGIs $100k-200k , 2.8% for AGIs over 200k ) Self-employment retirement plans: $19,843 (reported on 0.4% of returns )89436:
$19,843Nevada:
$22,197
Total itemized deductions: $21,229 (22% of AGI, reported on 40.7% of returns )Here:
$21,229State:
$26,148
Here:
21.8% of AGIState:
20.0% of AGI
(% of AGI for various income ranges: 11.9% for AGIs below $25k , 12.7% for AGIs $25k-50k , 13.8% for AGIs $50k-75k , 13.8% for AGIs $75k-100k , 13.2% for AGIs $100k-200k , 12.1% for AGIs over 200k ) Charity contributions: $2,726 (reported on 32.9% of returns )(% of AGI for various income ranges: 0.8% for AGIs below $25k , 0.9% for AGIs $25k-50k , 1.3% for AGIs $50k-75k , 1.4% for AGIs $75k-100k , 1.6% for AGIs $100k-200k , 1.4% for AGIs over 200k ) Taxes paid: $4,518 (reported on 40.2% of returns )(% of AGI for various income ranges: 2.0% for AGIs below $25k , 2.3% for AGIs $25k-50k , 2.8% for AGIs $50k-75k , 2.8% for AGIs $75k-100k , 3.0% for AGIs $100k-200k , 2.7% for AGIs over 200k ) Earned income credit: $1,984 (reported on 10.1% of returns )(% of AGI for various income ranges: 3.9% for AGIs below $25k , 0.9% for AGIs $25k-50k ) Percentage of individuals using paid preparers for their 2012 taxes: 45.0%(% for various income ranges: 37.5% for AGIs below $25k , 40.9% for AGIs $25k-50k , 48.7% for AGIs $50k-75k , 48.8% for AGIs $75k-100k , 51.8% for AGIs $100k-200k , 68.2% for AGIs over 200k )
Averages for the 2004 tax year for zip code 89436, filed in 2005:
Average Adjusted Gross Income (AGI) in 2004: $65,830 (Individual Income Tax Returns) Here:
$65,830State:
$58,367
Salary/wage: $55,630 (reported on 88.9% of returns )Here:
$55,630State:
$42,695
(% of AGI for various income ranges: 201.2% for AGIs below $10k , 78.7% for AGIs $10k-25k , 81.1% for AGIs $25k-50k , 83.4% for AGIs $50k-75k , 86.1% for AGIs $75k-100k , 63.8% for AGIs over 100k ) Taxable interest for individuals: $1,500 (reported on 47.9% of returns )This zip code:
$1,500Nevada:
$3,867
(% of AGI for various income ranges: 12.5% for AGIs below $10k , 2.2% for AGIs $10k-25k , 1.3% for AGIs $25k-50k , 0.8% for AGIs $50k-75k , 0.7% for AGIs $75k-100k , 1.1% for AGIs over 100k ) Taxable dividends: $2,337 (reported on 24.9% of returns )(% of AGI for various income ranges: 9.4% for AGIs below $10k , 1.6% for AGIs $10k-25k , 0.7% for AGIs $25k-50k , 0.7% for AGIs $50k-75k , 0.5% for AGIs $75k-100k , 1.0% for AGIs over 100k ) Net capital gain/loss: +$24,128 (reported on 21.7% of returns )Here:
+$24,128State:
+$50,644
(% of AGI for various income ranges: 5.5% for AGIs below $10k , 0.2% for AGIs $10k-25k , 1.0% for AGIs $25k-50k , 0.4% for AGIs $50k-75k , 1.2% for AGIs $75k-100k , 16.5% for AGIs over 100k ) Profit/loss from business: +$12,141 (reported on 15.8% of returns )Here:
+$12,141State:
+$13,618
(% of AGI for various income ranges: -2.3% for AGIs below $10k , 4.2% for AGIs $10k-25k , 4.2% for AGIs $25k-50k , 2.6% for AGIs $50k-75k , 2.4% for AGIs $75k-100k , 2.9% for AGIs over 100k ) IRA payment deduction: $3,105 (reported on 2.9% of returns )89436:
$3,105Nevada:
$3,054
(% of AGI for various income ranges: 0.5% for AGIs below $10k , 0.2% for AGIs $10k-25k , 0.2% for AGIs $25k-50k , 0.2% for AGIs $50k-75k , 0.1% for AGIs $75k-100k , 0.1% for AGIs over 100k ) Self-employed pension: $10,785 (reported on 0.7% of returns )Here:
$10,785Nevada:
$16,706
(% of AGI for various income ranges: 0.1% for AGIs $25k-50k , 0.1% for AGIs $50k-75k , 0.1% for AGIs $75k-100k , 0.2% for AGIs over 100k ) Total itemized deductions: $19,705 (22% of AGI, reported on 56.9% of returns )Here:
$19,705State:
$22,990
Here:
21.8% of AGIState:
21.8% of AGI
(% of AGI for various income ranges: 41.2% for AGIs below $10k , 16.2% for AGIs $10k-25k , 20.2% for AGIs $25k-50k , 20.4% for AGIs $50k-75k , 19.4% for AGIs $75k-100k , 13.7% for AGIs over 100k ) Charity contributions deductions: $2,270 (2% of AGI, reported on 49.4% of returns )Here:
2.5% of AGIState:
3.1% of AGI
(% of AGI for various income ranges: 1.7% for AGIs below $10k , 1.0% for AGIs $10k-25k , 1.4% for AGIs $25k-50k , 1.6% for AGIs $50k-75k , 1.7% for AGIs $75k-100k , 1.9% for AGIs over 100k ) Total tax: $9,291 (reported on 84.6% of returns )89436:
$9,291State:
$10,585
(% of AGI for various income ranges: 4.6% for AGIs below $10k , 4.6% for AGIs $10k-25k , 7.0% for AGIs $25k-50k , 8.3% for AGIs $50k-75k , 9.7% for AGIs $75k-100k , 16.4% for AGIs over 100k ) Earned income credit: $1,513 (reported on 6.6% of returns )Percentage of individuals using paid preparers for their 2004 taxes: 53.6%(% for various income ranges: 42.2% for AGIs below $10k , 49.4% for AGIs $10k-25k , 54.4% for AGIs $25k-50k , 56.3% for AGIs $50k-75k , 52.5% for AGIs $75k-100k , 62.4% for AGIs over 100k )
Estimated median household income in 2022: This zip code:
$106,334Nevada:
$72,333
Nearest zip codes: 89441 ,
89434 ,
89431 ,
89433 ,
89512 ,
89502 .
Sparks Zip Code Map
Percentage of family households: This zip code:
51.1%Nevada:
45.2%
Percentage of households with unmarried partners: This zip code:
4.1%Nevada:
44.2%
Likely homosexual households (counted as self-reported same-sex unmarried-partner households)
Lesbian couples: 0.1% of all households Gay men: 0.2% of all households
Household received Food Stamps/SNAP in the past 12 months: 655Household did not receive Food Stamps/SNAP in the past 12 months: 17,004
Women who had a birth in the past 12 months: 531 (507 now married , 64 unmarried) Women who did not have a birth in the past 12 months: 10,050 (5,073 now married , 4,937 unmarried)
Housing units in zip code 89436 with a mortgage: 10,139 (1,117
second mortgage , 158
home equity loan , 734
both second mortgage and home equity loan )
Houses without a mortgage: 172
Median monthly owner costs for units with a mortgage: $2,072
Median monthly owner costs for units without a mortgage: $550
Residents with income below the poverty level in 2022:
This zip code:
5.4%Whole state:
12.5%
Residents with income below 50% of the poverty level in 2022:
This zip code:
2.9%Whole state:
5.9%
Median number of rooms in houses and condos: Median number of rooms in apartments:
Year house built (houses)
156 2020 or later5,314 2010 to 20197,754 2000 to 20094,546 1990 to 1999997 1980 to 1989422 1970 to 197962 1960 to 19690 1950 to 195923 1940 to 19499 1939 or earlier
Zip code 89436 household income distribution in 2022 460 Less than $10,000201 $10,000 to $14,999245 $15,000 to $19,999380 $20,000 to $24,999214 $25,000 to $29,999283 $30,000 to $34,999357 $35,000 to $39,999474 $40,000 to $44,999339 $45,000 to $49,999960 $50,000 to $59,9991,814 $60,000 to $74,9992,810 $75,000 to $99,9992,365 $100,000 to $124,9992,275 $125,000 to $149,9992,465 $150,000 to $199,9992,261 $200,000 or moreEstimate of home value of owner-occupied houses/condos in 2022 in zip code 89436 117 Less than $10,00027 $15,000 to $19,99941 $30,000 to $34,99922 $35,000 to $39,99937 $40,000 to $49,99948 $50,000 to $59,99923 $60,000 to $69,99948 $100,000 to $124,9994 $125,000 to $149,99917 $175,000 to $199,99939 $200,000 to $249,999151 $250,000 to $299,9992,057 $300,000 to $399,9995,520 $400,000 to $499,9996,791 $500,000 to $749,9991,454 $750,000 to $999,999194 $1,000,000 to $1,499,99913 $1,500,000 to $1,999,99977 $2,000,000 or moreRent paid by renters in 2022 in zip code 89436 6 $200 to $24911 $550 to $59923 $700 to $74910 $750 to $79926 $900 to $999184 $1,000 to $1,2491,006 $1,250 to $1,4992,024 $1,500 to $1,9991,376 $2,000 to $2,499567 $2,500 to $2,9999 $3,000 to $3,499110 $3,500 or more113 No cash rent
Median gross rent in 2022: $2,002.
Median price asked for vacant for-sale houses and condos in 2022: $1,280,600.
Estimated median house (or condo) value in 2022 for: White Non-Hispanic householders: $563,333Black or African American householders: $523,741American Indian or Alaska Native householders: $302,710Asian householders: $539,952Native Hawaiian and other Pacific Islander householders: $493,501Some other race householders: $452,350Two or more races householders: $537,770Hispanic or Latino householders: $523,117Estimated median house or condo value in 2022: $560,528
89436:
$560,528Nevada:
$434,700
Lower value quartile - upper value quartile: $482,813 - $771,903
Mean price in 2022: Detached houses: $557,504Here:
$557,504State:
$549,327
Townhouses or other attached units: $309,581Here:
$309,581State:
$328,893
In 3-to-4-unit structures: $279,264Here:
$279,264State:
$295,216
In 5-or-more-unit structures: $294,918Here:
$294,918State:
$297,847
Mobile homes: $209,840Here:
$209,840State:
$159,995
Occupied boats, RVs, vans, etc.: $21,421Here:
$21,421State:
$92,244
Housing units in structures:
One, detached: 15,308One, attached: 442Two: 1833 or 4: 4035 to 9: 95810 to 19: 79220 to 49: 3850 or more: 489Mobile homes: 114Boats, RVs, vans, etc.: 16Unemployment : 3.5%
Means of transportation to work in zip code 89436 75.3% 18,727 Drove a car alone9.6% 2,395 Carpooled0.1% 19 Bus or trolley bus0.0% 3 Taxi0.3% 81 Motorcycle0.1% 19 Bicycle0.8% 197 Walked0.6% 155 Other means13.2% 3,281 Worked at homeTravel time to work (commute) in zip code 89436 301 Less than 5 minutes952 5 to 9 minutes2,520 10 to 14 minutes2,790 15 to 19 minutes4,186 20 to 24 minutes2,460 25 to 29 minutes4,821 30 to 34 minutes1,070 35 to 39 minutes681 40 to 44 minutes1,152 45 to 59 minutes448 60 to 89 minutes288 90 or more minutes
Percentage of zip code residents living and working in this county: 94.0%
Household type by relationship:
Households: 48,267
Male householders: 9,039 (1,851 living alone ), Female householders: 8,835 (1,886 living alone )10,298 spouses (10,178 opposite-sex spouses ), 1,274 unmarried partners , (1,244 opposite-sex unmarried partners ), 14,022 children (12,769 natural , 288 adopted , 986 stepchildren ), 720 grandchildren , 768 brothers or sisters , 964 parents , 56 foster children , 833 other relatives , 1,431 non-relatives In group quarters: 15 (-1 institutionalized population )
Size of family households: 5,468 2-persons , 2,831 3-persons , 3,012 4-persons , 1,324 5-persons , 308 6-persons , 315 7-or-more-persons
Size of nonfamily households: 3,736 1-person , 680 2-persons , 127 3-persons , 91 4-persons , 7 5-persons
7,384 married couples with children. single-parent households (947 men , 2,166 women ).
84.2% of residents of 89436 zip code speak English at home. of residents speak Spanish at home (71% very well, 19% well, 8% not well, 1% not at all ).of residents speak other Indo-European language at home (84% very well, 16% well ).of residents speak Asian or Pacific Island language at home (59% very well, 34% well, 4% not well, 3% not at all ).of residents speak other language at home (100% very well ).
Foreign born population: 5,009 (10.4%)
(71.3%
of them are naturalized citizens )
This zip code:
10.4%Whole state:
18.9%
25% Honduras 17% Malaysia 6% Thailand 5% Costa Rica 5% Peru 4% Belize 3% El Salvador 10% English 8% American 8% German 7% European 5% Irish 5% Italian 3% Norwegian
Year of entry for the foreign-born population
732 2010 or later 1,430 2000 to 2009 894 1990 to 1999 2,638 Before 1990
There are
90 Medical Specialists in Zip Code 89436 .
Facilities with environmental interests located in this zip code:
SPANISH SPRINGS HS (1065 EAGLE CANYON DRIVE in SPARKS, NV)
(National Center for Education Statistics) - STATE ID-16-606 Conditionally Exempt Small Quantity Generators, less than 100 kg/month of hazardous waste (Resource Conservation and Recovery Act (tracking hazardous waste)) - notification Organizations: WASHOE CO SCHOOL DISTRICT (CONTACT/OWNER)
, WASHOE CO SCH DIST (SCHOOL DISTRICT)
Alternative names: SPANISH SPRINGS HIGH SCHOOL
BEASLEY ELEM (2100 CANYON PARKWAY in SPARKS, NV)
(National Center for Education Statistics) - STATE ID-16-271 Organizations: WASHOE CO SCH DIST (SCHOOL DISTRICT)
DIRECT MARKETING (215 HURCULES DR in SPARKS, NV)
(Integrated Compliance Information System) - ICIS-09-1994-0045, FORMAL ENFORCEMENT ACTION COMPLIANCE ACTIVITY (Tracking inspections of insecticide, fungicide, and rodenticide, and toxic substances)
SPANISH SPRINGS ELEM (100 MARILYN MAE DRIVE in SPARKS, NV)
(National Center for Education Statistics) - STATE ID-16-269 Organizations: WASHOE CO SCH DIST (SCHOOL DISTRICT)
VAN GORDER ELEM (7650 CAMPELLO DRIVE in SPARKS, NV)
(National Center for Education Statistics) - STATE ID-16-276 Organizations: WASHOE CO SCH DIST (SCHOOL DISTRICT)
USDOI BLM FORMER MONITE EXP FACTORY (T 20N R 20E SEC 28 MAPS in SPARKS, NV)
HAZARDOUS WASTE BIENNIAL REPORTER (Resource Conservation and Recovery Act (tracking hazardous waste)) (Resource Conservation and Recovery Act (tracking hazardous waste)) Organizations: B L M (CONTACT/OWNER)
AT SYSTEMS WEST INC (900 INDUSTRIAL WY in SPARKS, NV)
Conditionally Exempt Small Quantity Generators, less than 100 kg/month of hazardous waste (Resource Conservation and Recovery Act (tracking hazardous waste)) - notification Business NAICS classification: ARMORED CAR SERVICES.Organizations: ARMORED TRANSPORT OF NEVADA (CONTACT/OWNER)
, AT SYSTEMS INTERNATIONAL (CONTACT/OWNER)
Alternative names: ARMORED TRANSPORT OF NEVADA
SCOLARIS FOOD AND DRUG CO (1350 DISC DR in SPARKS, NV)
(Resource Conservation and Recovery Act (tracking hazardous waste))
ALBERTSONS 185 (9750 PYRAMID LAKES HWY in SPARKS, NV)
Small Quantity Generators, between 100 kg and 1000 kg of hazardous waste/month (Resource Conservation and Recovery Act (tracking hazardous waste)) - notification Business NAICS classification: ONE-HOUR PHOTOFINISHING.Organizations: ALBERTSONS INC (CONTACT/OWNER)
Alternative names: ALBERTSONS NO 185
HOME DEPOT 3313 (4655 GALLERIA PKWY in SPANISH SPRINGS, NV)
Small Quantity Generators, between 100 kg and 1000 kg of hazardous waste/month (Resource Conservation and Recovery Act (tracking hazardous waste)) Organizations: HOME DEPOT USA INC (CONTACT/OPERATOR)
LINDELLS PAINTING SERVICE (140 INVENTORS PL in SPARKS, NV)
Small Quantity Generators, between 100 kg and 1000 kg of hazardous waste/month (Resource Conservation and Recovery Act (tracking hazardous waste)) Organizations: KEYPROPERTY LLC (CONTACT/OWNER)
MIRACLE METHOD INC (215 DESERT ROSE DR in SPARKS, NV)
Conditionally Exempt Small Quantity Generators, less than 100 kg/month of hazardous waste (Resource Conservation and Recovery Act (tracking hazardous waste))
Housing units lacking complete plumbing facilities: 0.6%
Housing units lacking complete kitchen facilities: 0.6%
77.3% Utility gas 20.5% Electricity 1.3% Bottled, tank, or LP gas
Population in 1990: 4,228. Population change in the 1990s: +17,300 (+409.2%).
Place of birth for U.S.-born residents:
This state: 17,193Northeast: 1,792Midwest: 3,963South: 2,855West: 16,692
37% of the 89436 zip code residents lived in the same house 5 years ago.
Out of people who lived in different houses, 67% lived in this county.
Out of people who lived in different counties, 50% lived in Nevada.
90% of the 89436 zip code residents lived in the same house 1 year ago.
Out of people who lived in different houses, 65% moved from this county.
Out of people who lived in different houses, 2% moved from different county within same state.
Out of people who lived in different houses, 33% moved from different state.
Out of people who lived in different houses, 2% moved from abroad.
Private vs. public school enrollment:
Students in private schools in grades 1 to 8 (elementary and middle school): 813
Students in private schools in grades 9 to 12 (high school): 173
Students in private undergraduate colleges: 430
Occupation by median earnings in the past 12 months ($)
92,347 Law enforcement workers including supervisors 89,648 Architecture and engineering occupations 85,258 Computer and mathematical occupations 84,808 Health diagnosing and treating practitioners and other technical occupations 78,976 Management occupations 77,984 Installation, maintenance, and repair occupations
Companies with federal contracts located in this zip code:
SIERRA CUSTOM EXTERIORS (215 PHAROH CT in SPARKS, NV; small business) in 2 contracts in 2004
$9,600 with Army for Building Components, Prefabricated. Signed on 2004-04-29. Completion date: 2004-06-01.
, same as above. Signed on 2004-05-20. Completion date: 2004-06-01.
Top industries in this zip code by the number of employees in 2005:
Construction: Land Subdivision (100-249 employees: 1 establishment, 1-4 employees: 1 establishment)Accommodation and Food Services: Full-Service Restaurants (20-49: 3, 10-19: 1)Construction: New Single-Family Housing Construction (except Operative Builders) (20-49: 1, 10-19: 2, 5-9: 2, 1-4: 7)Construction: Electrical Contractors (10-19: 3, 5-9: 2, 1-4: 8)Construction: Poured Concrete Foundation and Structure Contractors (20-49: 2, 5-9: 1)Other Services (except Public Administration): Religious Organizations (20-49: 2)Administrative and Support and Waste Management and Remediation Services: Landscaping Services (10-19: 2, 5-9: 2, 1-4: 11)Accommodation and Food Services: Limited-Service Restaurants (20-49: 1, 10-19: 1, 5-9: 1, 1-4: 2)Construction: Framing Contractors (20-49: 1, 10-19: 1, 1-4: 1)
People in group quarters in 2010:
57 people in group homes intended for adults
9 people in residential treatment centers for juveniles (non-correctional)
4 people in workers' group living quarters and job corps centers
People in group quarters in 2000:
44 people in nursing homes
8 people in wards in general hospitals for patients who have no usual home elsewhere
Fatal accident statistics in 2012:
Fatal accident count: 5Vehicles involved in fatal accidents: 7Fatal accidents caused by drunken drivers: 4Fatalities: 5Persons involved in fatal accidents: 12Pedestrians involved in fatal accidents: 0
Home Mortgage Disclosure Act Aggregated Statistics For Year 2009(Based on 4 full and 18 partial tracts) A) FHA, FSA/RHS & VA B) Conventional C) Refinancings D) Home Improvement Loans E) Loans on Dwellings For 5+ Families F) Non-occupant Loans on G) Loans On Manufactured Number Average Value Number Average Value Number Average Value Number Average Value Number Average Value Number Average Value Number Average Value
LOANS ORIGINATED 1,111 $199,568 664 $177,483 1,920 $205,564 45 $101,046 1 $11,566,960 290 $159,129 35 $136,737 APPLICATIONS APPROVED, NOT ACCEPTED 40 $203,893 38 $176,339 147 $226,694 11 $125,059 0 $0 13 $177,819 7 $130,134 APPLICATIONS DENIED 137 $200,069 67 $160,944 765 $236,040 49 $115,423 0 $0 70 $175,108 32 $105,157 APPLICATIONS WITHDRAWN 117 $208,419 77 $180,375 522 $225,489 16 $126,729 1 $22,560,000 41 $151,248 12 $81,934 FILES CLOSED FOR INCOMPLETENESS 7 $196,453 12 $204,304 100 $222,119 7 $180,551 0 $0 17 $186,164 3 $95,713
Aggregated Statistics For Year 2008(Based on 4 full and 18 partial tracts) A) FHA, FSA/RHS & VA B) Conventional C) Refinancings D) Home Improvement Loans E) Loans on Dwellings For 5+ Families F) Non-occupant Loans on G) Loans On Manufactured Number Average Value Number Average Value Number Average Value Number Average Value Number Average Value Number Average Value Number Average Value
LOANS ORIGINATED 831 $250,681 828 $221,714 1,129 $227,366 71 $116,184 2 $14,439,275 218 $199,413 41 $143,579 APPLICATIONS APPROVED, NOT ACCEPTED 48 $249,854 128 $248,799 227 $231,367 37 $78,376 0 $0 50 $191,857 10 $138,918 APPLICATIONS DENIED 102 $255,701 186 $236,577 1,122 $252,523 127 $128,989 0 $0 96 $211,903 74 $116,944 APPLICATIONS WITHDRAWN 124 $246,056 117 $246,880 460 $255,285 32 $163,139 0 $0 36 $178,648 23 $144,617 FILES CLOSED FOR INCOMPLETENESS 10 $249,420 16 $225,959 98 $242,753 9 $98,030 0 $0 16 $204,321 4 $131,662
Aggregated Statistics For Year 2007(Based on 4 full and 18 partial tracts) A) FHA, FSA/RHS & VA B) Conventional C) Refinancings D) Home Improvement Loans E) Loans on Dwellings For 5+ Families F) Non-occupant Loans on G) Loans On Manufactured Number Average Value Number Average Value Number Average Value Number Average Value Number Average Value Number Average Value Number Average Value
LOANS ORIGINATED 259 $269,394 2,329 $228,986 2,055 $238,411 219 $112,349 0 $0 416 $230,651 97 $136,048 APPLICATIONS APPROVED, NOT ACCEPTED 22 $288,284 390 $207,202 449 $244,690 45 $107,069 0 $0 55 $191,527 25 $110,902 APPLICATIONS DENIED 55 $268,598 465 $255,527 1,760 $262,269 233 $131,905 4 $32,646,235 161 $241,435 96 $121,342 APPLICATIONS WITHDRAWN 24 $262,176 336 $233,131 768 $264,667 67 $199,758 0 $0 57 $225,093 29 $133,018 FILES CLOSED FOR INCOMPLETENESS 4 $266,252 65 $254,976 292 $274,040 23 $111,034 0 $0 18 $257,563 5 $119,034
Aggregated Statistics For Year 2006(Based on 4 full and 18 partial tracts) A) FHA, FSA/RHS & VA B) Conventional C) Refinancings D) Home Improvement Loans E) Loans on Dwellings For 5+ Families F) Non-occupant Loans on G) Loans On Manufactured Number Average Value Number Average Value Number Average Value Number Average Value Number Average Value Number Average Value Number Average Value
LOANS ORIGINATED 98 $230,223 3,494 $233,871 3,331 $241,051 457 $120,872 2 $17,187,395 611 $230,760 129 $130,142 APPLICATIONS APPROVED, NOT ACCEPTED 13 $242,197 679 $243,133 646 $246,642 97 $83,661 0 $0 139 $246,807 26 $102,393 APPLICATIONS DENIED 16 $269,598 597 $245,693 1,625 $266,372 321 $125,478 0 $0 150 $248,204 110 $104,306 APPLICATIONS WITHDRAWN 19 $237,247 655 $227,700 1,332 $263,818 103 $187,828 0 $0 113 $246,216 45 $133,944 FILES CLOSED FOR INCOMPLETENESS 4 $167,110 57 $261,896 355 $290,117 31 $154,205 0 $0 26 $297,503 8 $168,032
Aggregated Statistics For Year 2005(Based on 4 full and 18 partial tracts) A) FHA, FSA/RHS & VA B) Conventional C) Refinancings D) Home Improvement Loans E) Loans on Dwellings For 5+ Families F) Non-occupant Loans on G) Loans On Manufactured Number Average Value Number Average Value Number Average Value Number Average Value Number Average Value Number Average Value Number Average Value
LOANS ORIGINATED 79 $210,494 4,230 $241,561 4,724 $241,258 588 $147,640 1 $7,715,410 911 $228,969 147 $120,575 APPLICATIONS APPROVED, NOT ACCEPTED 10 $203,654 556 $248,426 550 $250,253 96 $104,402 0 $0 71 $228,578 14 $138,274 APPLICATIONS DENIED 25 $191,677 675 $236,540 1,612 $229,965 279 $114,950 0 $0 174 $225,784 144 $108,122 APPLICATIONS WITHDRAWN 13 $199,167 590 $243,136 1,421 $238,042 210 $184,557 0 $0 158 $237,935 69 $128,131 FILES CLOSED FOR INCOMPLETENESS 1 $269,520 85 $273,935 343 $250,038 18 $151,152 0 $0 18 $256,308 19 $134,862
Aggregated Statistics For Year 2004(Based on 4 full and 18 partial tracts) A) FHA, FSA/RHS & VA B) Conventional C) Refinancings D) Home Improvement Loans F) Non-occupant Loans on G) Loans On Manufactured Number Average Value Number Average Value Number Average Value Number Average Value Number Average Value Number Average Value
LOANS ORIGINATED 160 $195,949 4,169 $210,049 4,333 $199,441 445 $108,663 879 $194,472 110 $113,377 APPLICATIONS APPROVED, NOT ACCEPTED 18 $169,244 459 $216,659 578 $185,826 59 $82,215 116 $194,608 36 $114,513 APPLICATIONS DENIED 25 $181,293 554 $197,622 1,514 $183,341 344 $72,643 135 $194,797 120 $90,732 APPLICATIONS WITHDRAWN 26 $161,750 366 $200,358 1,141 $191,522 128 $87,802 76 $193,489 49 $96,041 FILES CLOSED FOR INCOMPLETENESS 1 $93,320 69 $202,597 279 $213,554 41 $90,659 13 $172,195 7 $137,603
Aggregated Statistics For Year 2003(Based on 4 full and 18 partial tracts) A) FHA, FSA/RHS & VA B) Conventional C) Refinancings D) Home Improvement Loans F) Non-occupant Loans on Number Average Value Number Average Value Number Average Value Number Average Value Number Average Value
LOANS ORIGINATED 361 $167,050 3,947 $174,891 7,448 $156,612 195 $47,445 854 $151,138 APPLICATIONS APPROVED, NOT ACCEPTED 24 $151,061 428 $182,594 893 $151,706 35 $39,268 80 $173,883 APPLICATIONS DENIED 30 $162,210 333 $170,467 1,620 $141,425 209 $34,771 88 $128,370 APPLICATIONS WITHDRAWN 38 $150,779 251 $175,665 1,346 $151,862 26 $29,625 72 $171,074 FILES CLOSED FOR INCOMPLETENESS 4 $129,238 56 $183,965 191 $155,528 17 $46,195 7 $122,059
Aggregated Statistics For Year 2002(Based on 6 partial tracts) A) FHA, FSA/RHS & VA B) Conventional C) Refinancings D) Home Improvement Loans F) Non-occupant Loans on Number Average Value Number Average Value Number Average Value Number Average Value Number Average Value
LOANS ORIGINATED 83 $133,356 162 $99,326 407 $114,148 23 $23,775 44 $94,155 APPLICATIONS APPROVED, NOT ACCEPTED 8 $99,752 27 $91,045 73 $96,925 7 $18,941 3 $117,687 APPLICATIONS DENIED 10 $108,136 66 $61,344 212 $89,076 24 $23,364 17 $59,344 APPLICATIONS WITHDRAWN 11 $109,001 18 $96,843 142 $121,937 6 $45,653 3 $74,397 FILES CLOSED FOR INCOMPLETENESS 1 $83,530 5 $123,862 19 $91,284 1 $274,810 1 $64,610
Aggregated Statistics For Year 2001(Based on 6 partial tracts) A) FHA, FSA/RHS & VA B) Conventional C) Refinancings D) Home Improvement Loans F) Non-occupant Loans on Number Average Value Number Average Value Number Average Value Number Average Value Number Average Value
LOANS ORIGINATED 94 $130,557 166 $97,718 305 $100,054 21 $30,651 27 $95,983 APPLICATIONS APPROVED, NOT ACCEPTED 3 $149,663 33 $76,028 41 $81,798 8 $24,302 3 $101,343 APPLICATIONS DENIED 4 $97,060 177 $55,719 226 $72,113 42 $16,812 5 $57,320 APPLICATIONS WITHDRAWN 8 $99,064 26 $93,561 154 $112,901 11 $50,205 3 $67,653 FILES CLOSED FOR INCOMPLETENESS 1 $204,260 2 $92,095 31 $102,581 2 $21,210 1 $49,600
Aggregated Statistics For Year 2000(Based on 6 partial tracts) A) FHA, FSA/RHS & VA B) Conventional C) Refinancings D) Home Improvement Loans E) Loans on Dwellings For 5+ Families F) Non-occupant Loans on Number Average Value Number Average Value Number Average Value Number Average Value Number Average Value Number Average Value
LOANS ORIGINATED 65 $125,240 163 $82,216 84 $62,235 31 $20,886 3 $122,137 18 $77,771 APPLICATIONS APPROVED, NOT ACCEPTED 3 $113,117 46 $60,174 27 $63,360 18 $23,224 1 $67,870 4 $37,580 APPLICATIONS DENIED 7 $115,857 352 $51,334 138 $51,958 58 $24,338 1 $66,570 13 $47,147 APPLICATIONS WITHDRAWN 5 $139,756 25 $80,322 33 $85,050 5 $21,536 0 $0 1 $52,210 FILES CLOSED FOR INCOMPLETENESS 2 $90,540 3 $69,120 12 $85,479 1 $9,130 0 $0 0 $0
Aggregated Statistics For Year 1999(Based on 5 partial tracts) A) FHA, FSA/RHS & VA B) Conventional C) Refinancings D) Home Improvement Loans F) Non-occupant Loans on Number Average Value Number Average Value Number Average Value Number Average Value Number Average Value
LOANS ORIGINATED 118 $127,298 158 $105,321 186 $91,774 28 $23,777 21 $86,521 APPLICATIONS APPROVED, NOT ACCEPTED 9 $123,322 40 $81,825 38 $74,590 11 $24,197 6 $73,507 APPLICATIONS DENIED 7 $119,329 124 $64,549 111 $74,211 34 $16,735 13 $60,857 APPLICATIONS WITHDRAWN 25 $122,600 20 $106,428 61 $94,297 3 $25,993 6 $89,053 FILES CLOSED FOR INCOMPLETENESS 1 $172,190 4 $134,125 14 $101,026 0 $0 0 $0
Private Mortgage Insurance Companies Aggregated Statistics For Year 2009(Based on 4 full and 18 partial tracts) A) Conventional B) Refinancings C) Non-occupant Loans on Number Average Value Number Average Value Number Average Value
LOANS ORIGINATED 74 $227,114 38 $251,658 2 $182,610 APPLICATIONS APPROVED, NOT ACCEPTED 25 $243,094 19 $238,731 2 $210,060 APPLICATIONS DENIED 15 $246,925 7 $230,163 1 $194,920 APPLICATIONS WITHDRAWN 3 $328,943 6 $237,960 2 $210,060 FILES CLOSED FOR INCOMPLETENESS 2 $300,205 1 $113,090 1 $93,970
Aggregated Statistics For Year 2008(Based on 4 full and 18 partial tracts) A) Conventional B) Refinancings C) Non-occupant Loans on D) Loans On Manufactured Number Average Value Number Average Value Number Average Value Number Average Value
LOANS ORIGINATED 267 $277,176 100 $280,996 23 $245,691 1 $108,980 APPLICATIONS APPROVED, NOT ACCEPTED 129 $293,187 82 $309,789 19 $249,748 1 $99,850 APPLICATIONS DENIED 37 $291,694 18 $304,934 12 $301,258 0 $0 APPLICATIONS WITHDRAWN 26 $275,802 4 $281,370 4 $257,967 1 $92,670 FILES CLOSED FOR INCOMPLETENESS 6 $289,490 2 $251,160 2 $282,970 0 $0
Aggregated Statistics For Year 2007(Based on 4 full and 18 partial tracts) A) Conventional B) Refinancings C) Non-occupant Loans on D) Loans On Manufactured Number Average Value Number Average Value Number Average Value Number Average Value
LOANS ORIGINATED 488 $286,231 182 $311,849 46 $280,345 2 $156,950 APPLICATIONS APPROVED, NOT ACCEPTED 91 $306,529 42 $347,811 6 $291,643 0 $0 APPLICATIONS DENIED 7 $527,520 7 $428,410 2 $416,960 1 $114,210 APPLICATIONS WITHDRAWN 27 $301,820 12 $304,250 0 $0 1 $136,390 FILES CLOSED FOR INCOMPLETENESS 2 $373,085 3 $332,357 0 $0 0 $0
Aggregated Statistics For Year 2006(Based on 4 full and 18 partial tracts) A) Conventional B) Refinancings C) Non-occupant Loans on D) Loans On Manufactured Number Average Value Number Average Value Number Average Value Number Average Value
LOANS ORIGINATED 151 $336,825 77 $341,666 17 $330,401 1 $274,740 APPLICATIONS APPROVED, NOT ACCEPTED 44 $332,578 20 $322,300 8 $329,114 0 $0 APPLICATIONS DENIED 1 $324,630 1 $193,260 0 $0 0 $0 APPLICATIONS WITHDRAWN 10 $400,411 11 $403,106 0 $0 0 $0 FILES CLOSED FOR INCOMPLETENESS 0 $0 0 $0 0 $0 0 $0
Aggregated Statistics For Year 2005(Based on 4 full and 18 partial tracts) A) Conventional B) Refinancings C) Non-occupant Loans on D) Loans On Manufactured Number Average Value Number Average Value Number Average Value Number Average Value
LOANS ORIGINATED 267 $306,096 104 $306,381 45 $288,330 3 $145,093 APPLICATIONS APPROVED, NOT ACCEPTED 33 $275,945 31 $260,997 4 $187,215 1 $163,150 APPLICATIONS DENIED 3 $300,507 1 $159,230 0 $0 0 $0 APPLICATIONS WITHDRAWN 14 $360,751 3 $365,957 4 $260,980 0 $0 FILES CLOSED FOR INCOMPLETENESS 3 $269,493 1 $142,920 1 $186,800 0 $0
Aggregated Statistics For Year 2004(Based on 4 full and 18 partial tracts) A) Conventional B) Refinancings C) Non-occupant Loans on D) Loans On Manufactured Number Average Value Number Average Value Number Average Value Number Average Value
LOANS ORIGINATED 616 $239,334 178 $211,533 102 $207,026 4 $125,135 APPLICATIONS APPROVED, NOT ACCEPTED 82 $233,669 62 $219,960 11 $237,710 1 $146,840 APPLICATIONS DENIED 5 $241,610 4 $202,545 2 $200,015 1 $88,100 APPLICATIONS WITHDRAWN 20 $248,036 7 $223,119 6 $229,310 0 $0 FILES CLOSED FOR INCOMPLETENESS 3 $208,170 3 $263,113 3 $160,430 1 $118,120
Aggregated Statistics For Year 2003(Based on 4 full and 18 partial tracts) A) Conventional B) Refinancings C) Non-occupant Loans on Number Average Value Number Average Value Number Average Value
LOANS ORIGINATED 926 $209,075 716 $180,508 77 $190,006 APPLICATIONS APPROVED, NOT ACCEPTED 106 $192,751 118 $177,359 23 $140,022 APPLICATIONS DENIED 13 $180,370 12 $189,500 5 $257,996 APPLICATIONS WITHDRAWN 21 $183,982 17 $171,079 4 $152,335 FILES CLOSED FOR INCOMPLETENESS 0 $0 2 $151,610 0 $0
Aggregated Statistics For Year 2002(Based on 6 partial tracts) A) Conventional B) Refinancings C) Non-occupant Loans on Number Average Value Number Average Value Number Average Value
LOANS ORIGINATED 59 $139,610 69 $129,370 6 $119,190 APPLICATIONS APPROVED, NOT ACCEPTED 8 $111,288 11 $132,163 0 $0 APPLICATIONS DENIED 0 $0 0 $0 0 $0 APPLICATIONS WITHDRAWN 2 $89,820 4 $118,162 1 $22,840 FILES CLOSED FOR INCOMPLETENESS 0 $0 1 $67,870 1 $67,870
Aggregated Statistics For Year 2001(Based on 6 partial tracts) A) Conventional B) Refinancings C) Non-occupant Loans on Number Average Value Number Average Value Number Average Value
LOANS ORIGINATED 61 $126,221 47 $119,187 6 $104,297 APPLICATIONS APPROVED, NOT ACCEPTED 6 $119,055 7 $89,884 1 $131,260 APPLICATIONS DENIED 2 $105,070 0 $0 1 $41,110 APPLICATIONS WITHDRAWN 1 $181,420 0 $0 1 $95,280 FILES CLOSED FOR INCOMPLETENESS 0 $0 0 $0 0 $0
Aggregated Statistics For Year 2000(Based on 6 partial tracts) A) Conventional B) Refinancings C) Non-occupant Loans on Number Average Value Number Average Value Number Average Value
LOANS ORIGINATED 51 $105,229 13 $109,455 5 $105,440 APPLICATIONS APPROVED, NOT ACCEPTED 11 $94,407 4 $114,588 1 $97,240 APPLICATIONS DENIED 6 $90,712 0 $0 1 $80,920 APPLICATIONS WITHDRAWN 2 $63,025 0 $0 0 $0 FILES CLOSED FOR INCOMPLETENESS 0 $0 0 $0 0 $0
Aggregated Statistics For Year 1999(Based on 5 partial tracts) A) Conventional B) Refinancings C) Non-occupant Loans on Number Average Value Number Average Value Number Average Value
LOANS ORIGINATED 47 $132,877 22 $134,301 1 $77,550 APPLICATIONS APPROVED, NOT ACCEPTED 5 $145,124 5 $153,268 0 $0 APPLICATIONS DENIED 2 $132,585 0 $0 0 $0 APPLICATIONS WITHDRAWN 1 $144,090 0 $0 0 $0 FILES CLOSED FOR INCOMPLETENESS 1 $90,570 0 $0 0 $0
2003 - 2018 National Fire Incident Reporting System (NFIRS) incidents See full 2006 National Fire Incident Reporting System statistics for zip code 89436, Nevada
Most common first names in zip code 89436 among deceased individuals Name Count Lived (average)
Robert 33 73.1 years John 31 75.2 years Mary 27 80.8 years Donald 20 69.5 years James 19 75.4 years William 18 70.7 years Charles 16 80.2 years Richard 15 68.1 years Margaret 13 82.5 years Frank 10 84.7 years
Most common last names in zip code 89436 among deceased individuals Last name Count Lived (average)
Smith 12 75.2 years Anderson 8 79.6 years Thompson 6 83.6 years Hall 5 77.8 years Lee 5 85.2 years Clark 5 86.8 years Johnson 5 81.8 years Roberts 5 68.2 years Miller 4 79.2 years Moore 4 69.7 years
Businesses in zip code 89436
Name Count Name Count
7-Eleven 1 OfficeMax 1 AT&T 1 Old Navy 1 AutoZone 1 Panda Express 1 Bed Bath & Beyond 1 Papa John's Pizza 1 CVS 1 PetSmart 1 Costco 1 Qdoba Mexican Grill 1 Discount Tire 1 Quiznos 1 Famous Footwear 1 RadioShack 1 FedEx 4 Red Robin 1 GNC 1 Rue21 1 GameStop 1 SONIC Drive-In 1 H&R Block 2 Safeway 1 Home Depot 1 Sprint Nextel 1 IHOP 1 Starbucks 3 Jack In The Box 1 Subway 3 KFC 1 T-Mobile 1 Kohl's 1 Taco Bell 1 Lane Bryant 1 UPS 4 Maurices 1 Verizon Wireless 2 McDonald's 1 Vons 2 Nike 3 Walgreens 2 Office Depot 1 Walmart 1
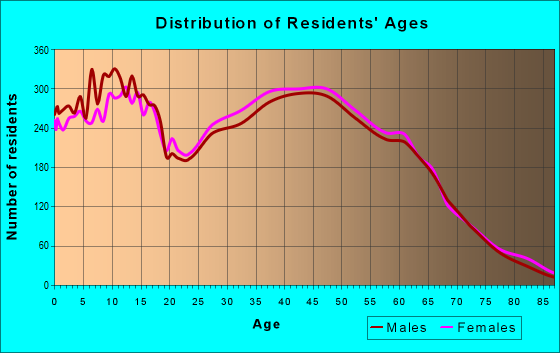
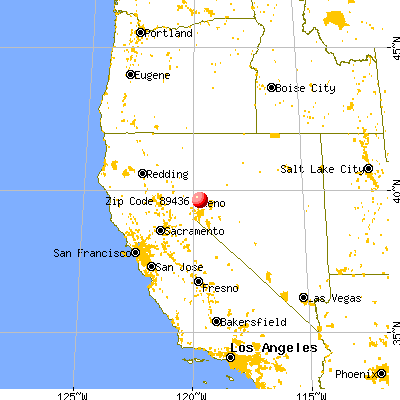


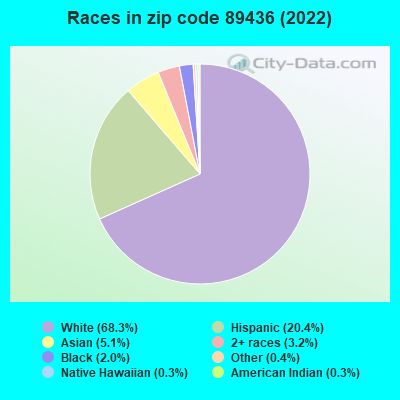


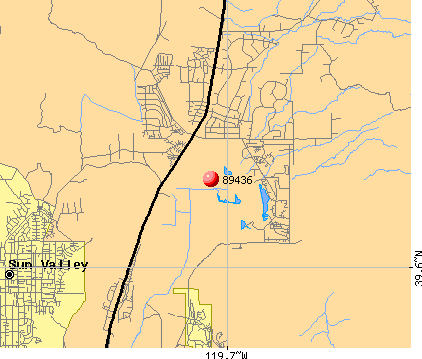 Nearest zip codes: 89441, 89434, 89431, 89433, 89512, 89502.
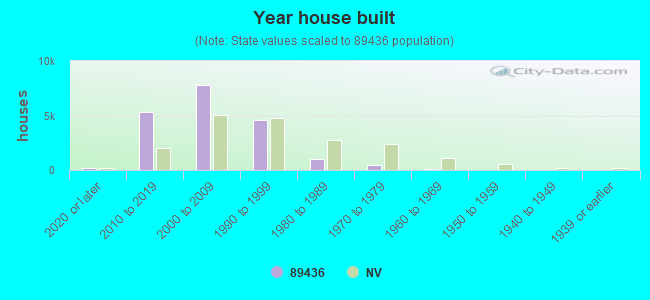
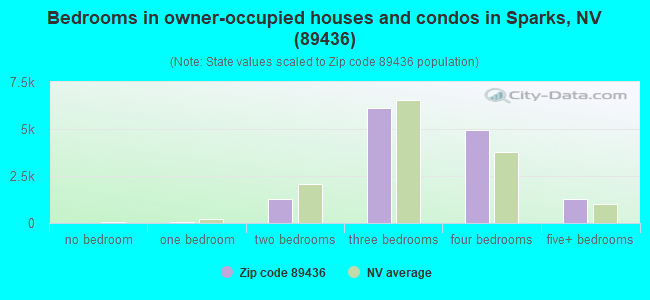
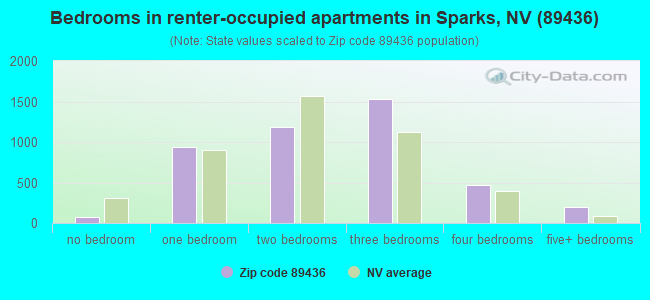
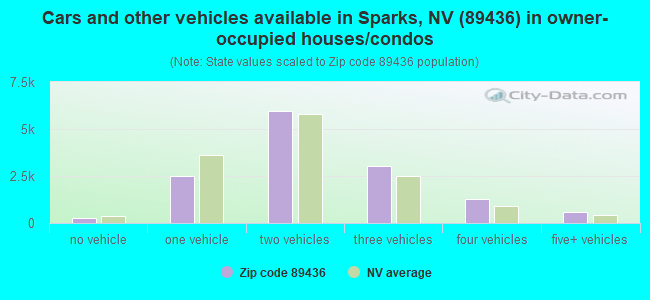
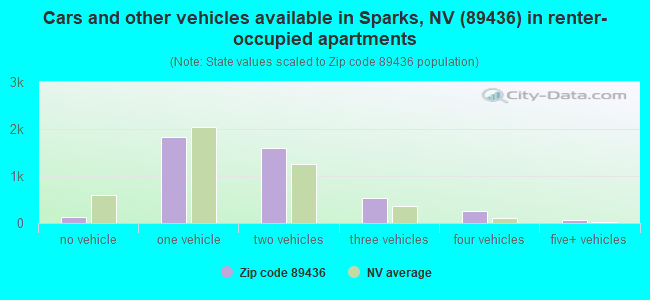


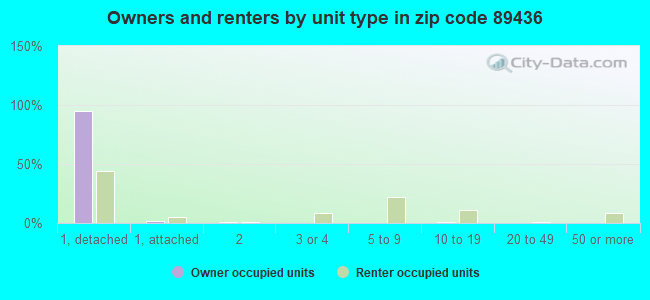
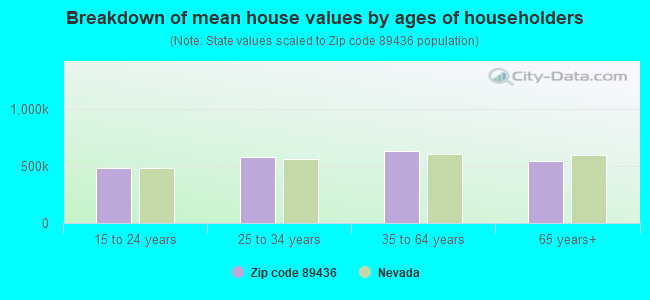


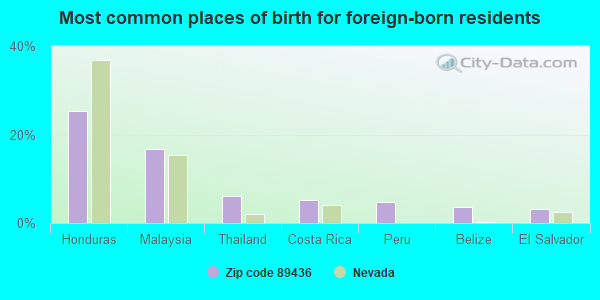
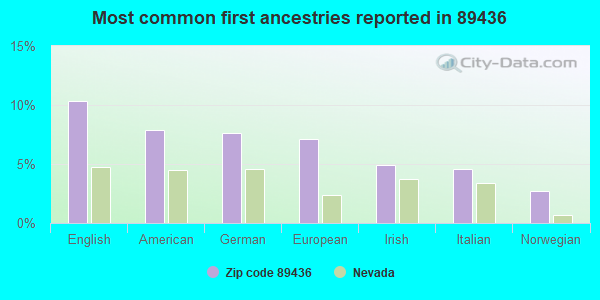
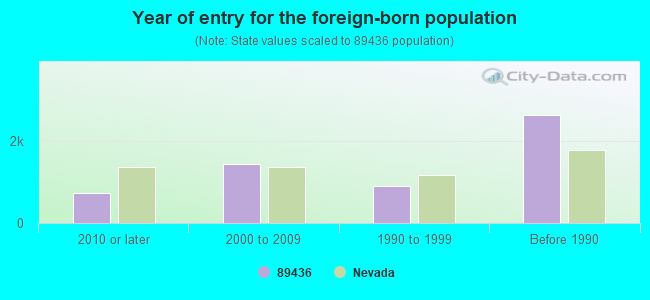
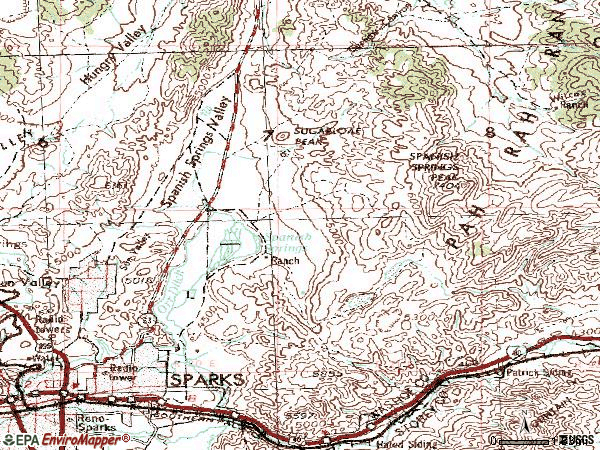

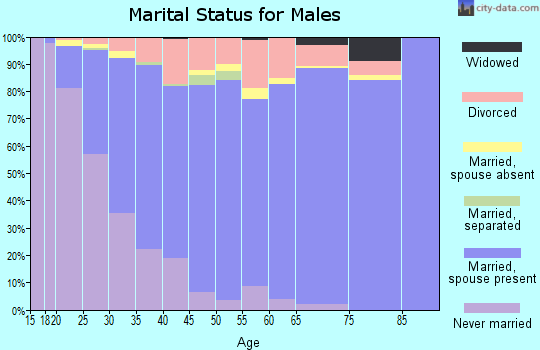
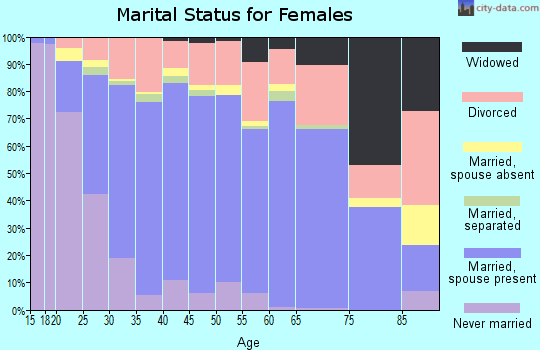
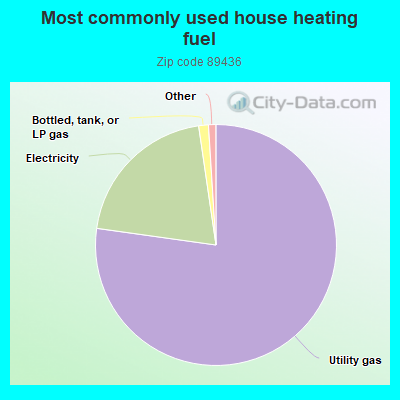
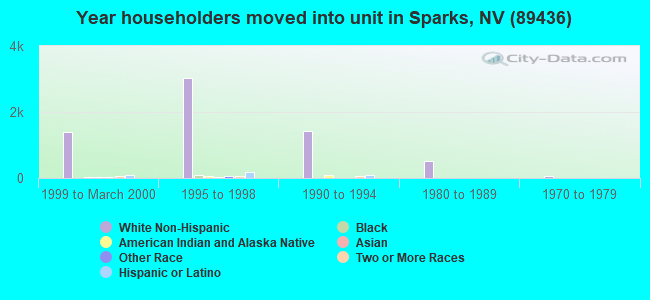
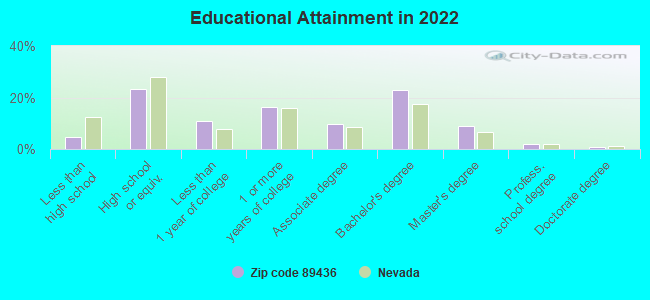

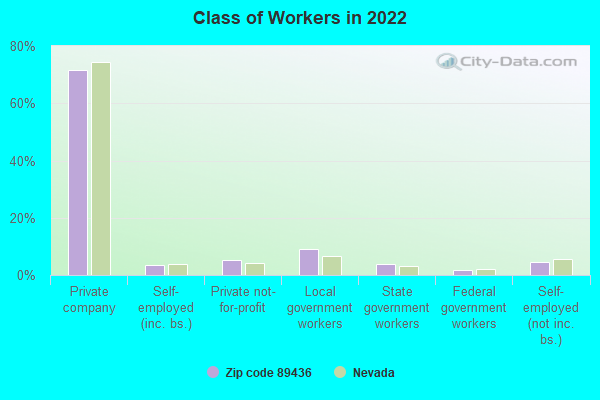
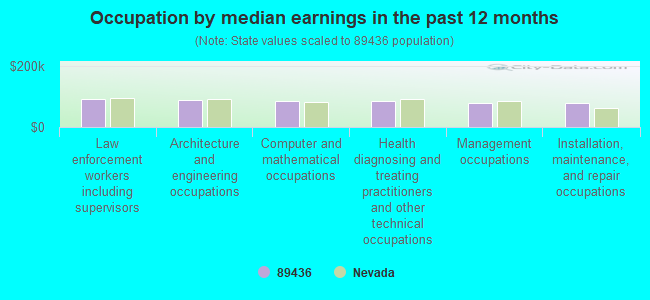
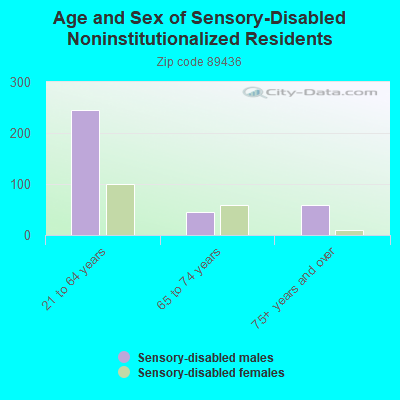
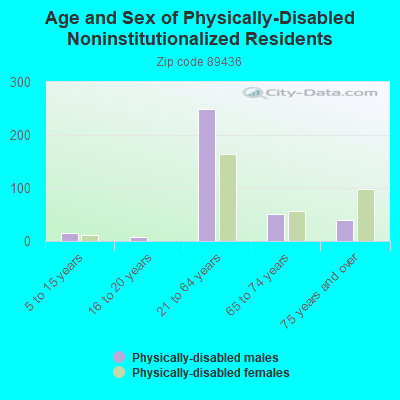
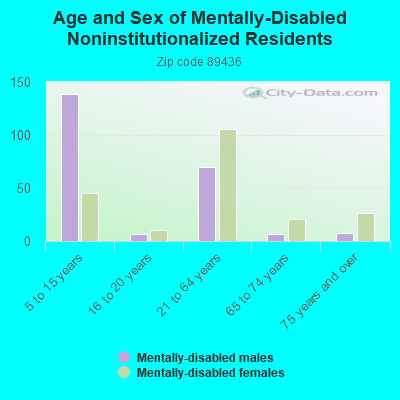
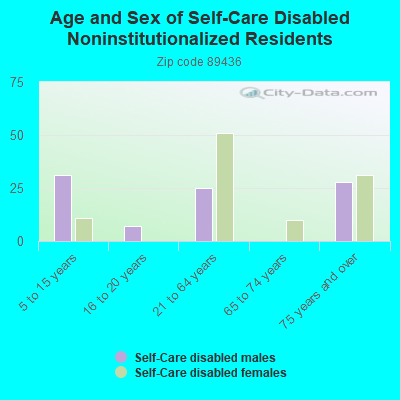
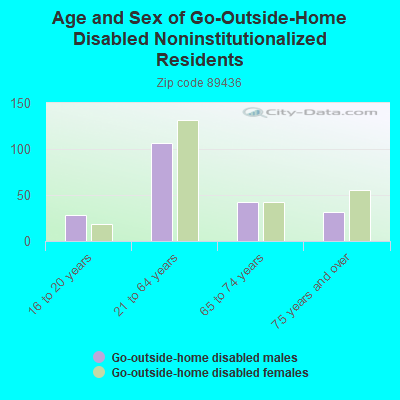
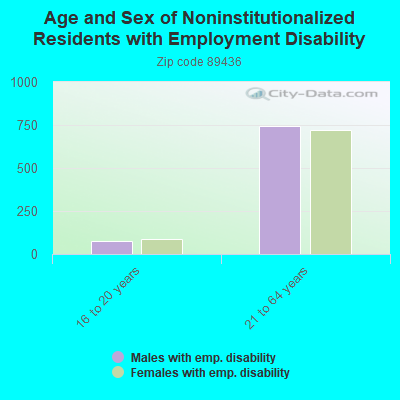
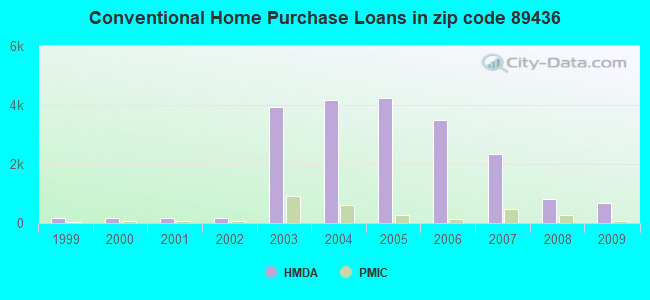
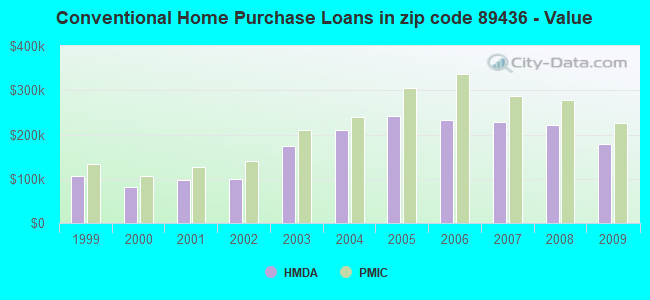
 Based on the data from the years 2003 - 2018 the average number of fire incidents per year is 56. The highest number of reported fires - 85 took place in 2004, and the least - 24 in 2003. The data has an increasing trend.
 When looking into fire subcategories, the most incidents belonged to: Outside Fires (45.0%), and Structure Fires (34.6%).