Races in West Mifflin, Pennsylvania (PA) Detailed Stats
Data:
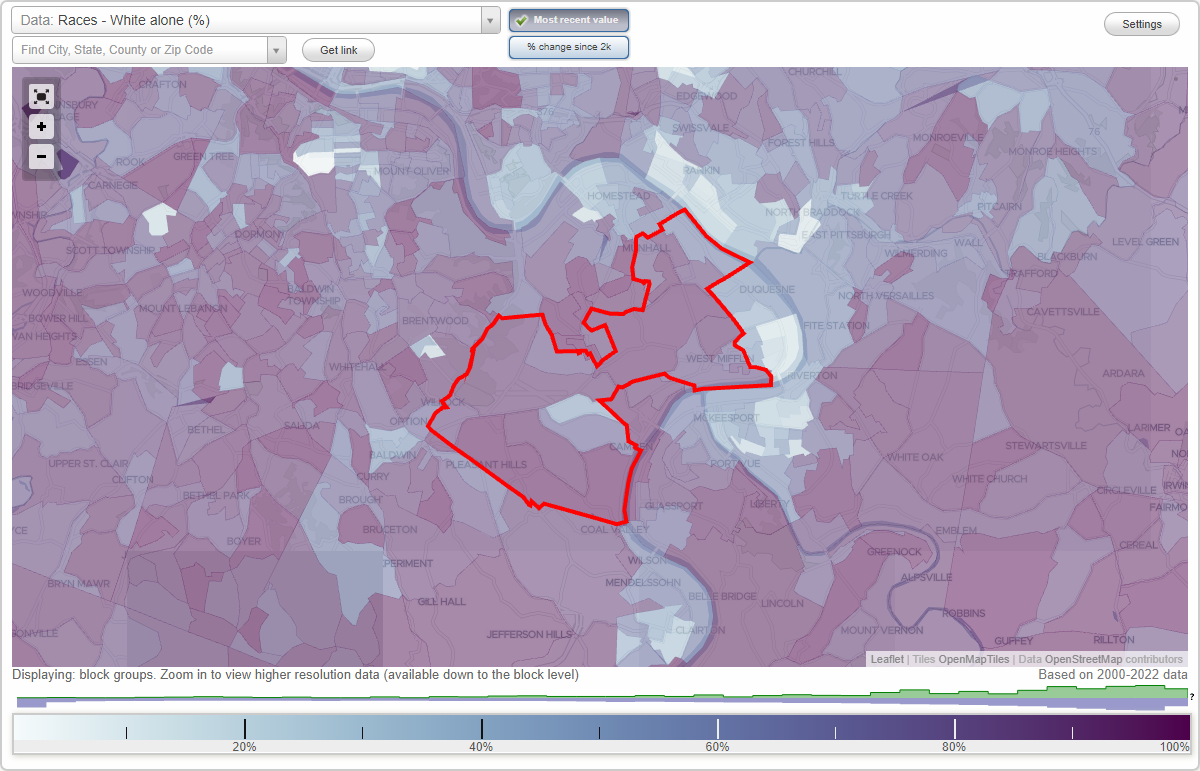
Races - White alone (%)
Races - White alone (% change since 2000)
Races - Black alone (%)
Races - Black alone (% change since 2000)
Races - American Indian alone (%)
Races - American Indian alone (% change since 2000)
Races - Asian alone (%)
Races - Asian alone (% change since 2000)
Races - Hispanic (%)
Races - Hispanic (% change since 2000)
Races - Native Hawaiian and Other Pacific Islander alone (%)
Races - Native Hawaiian and Other Pacific Islander alone (% change since 2000)
Races - Two or more races(%)
Races - Two or more races(% change since 2000)
Races - Other race alone (%)
Races - Other race alone (% change since 2000)
Racial diversity
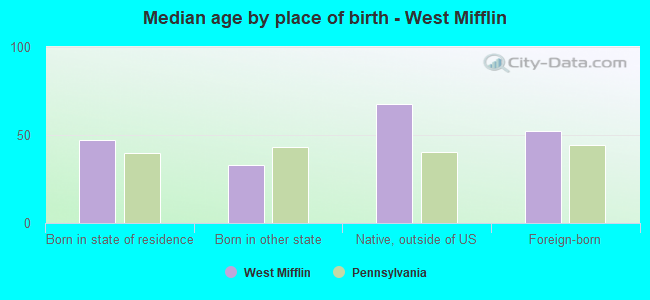
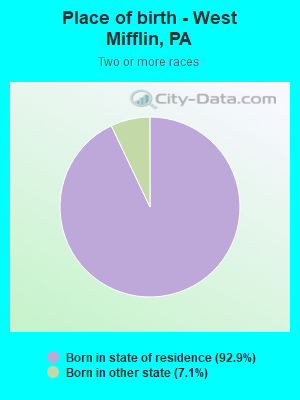
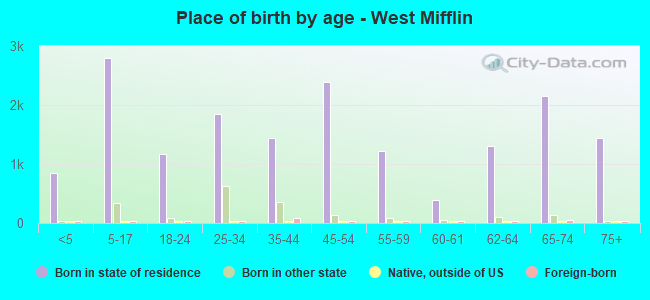
Place of birth - Born in state of residence (%)
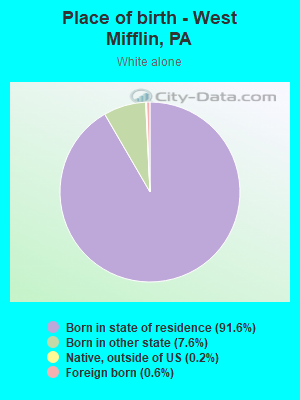
Place of birth - Born in state of residence (%) - White
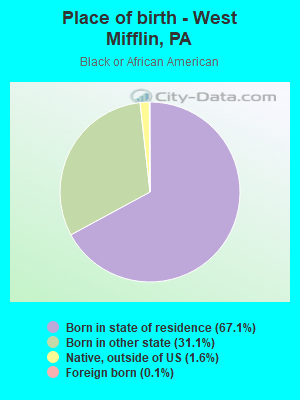
Place of birth - Born in state of residence (%) - Black or African American
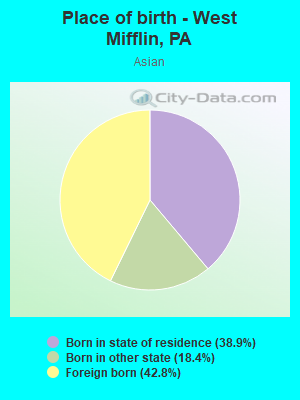
Place of birth - Born in state of residence (%) - Asian
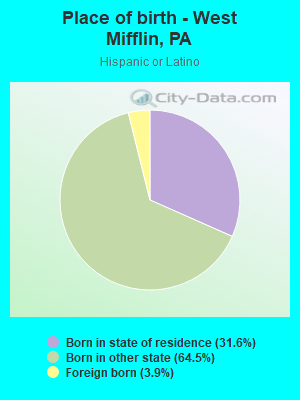
Place of birth - Born in state of residence (%) - Hispanic or Latino
Place of birth - Born in state of residence (%) - American Indian and Alaska Native
Place of birth - Born in state of residence (%) - Multirace
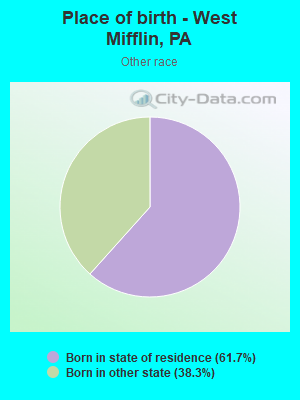
Place of birth - Born in state of residence (%) - Other Race
Place of birth - Born in other state (%)
Place of birth - Born in other state (%) - White
Place of birth - Born in other state (%) - Black or African American
Place of birth - Born in other state (%) - Asian
Place of birth - Born in other state (%) - Hispanic or Latino
Place of birth - Born in other state (%) - American Indian and Alaska Native
Place of birth - Born in other state (%) - Multirace
Place of birth - Born in other state (%) - Other Race
Place of birth - Native, outside of US (%)
Place of birth - Native, outside of US (%) - White
Place of birth - Native, outside of US (%) - Black or African American
Place of birth - Native, outside of US (%) - Asian
Place of birth - Native, outside of US (%) - Hispanic or Latino
Place of birth - Native, outside of US (%) - American Indian and Alaska Native
Place of birth - Native, outside of US (%) - Multirace
Place of birth - Native, outside of US (%) - Other Race
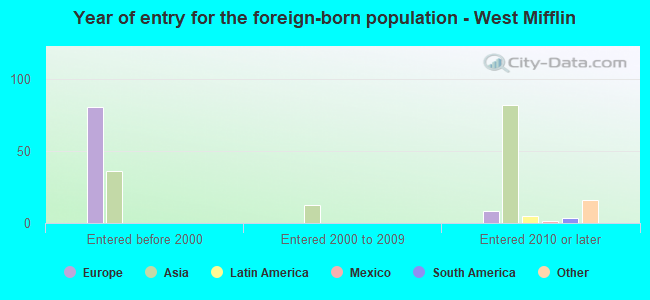
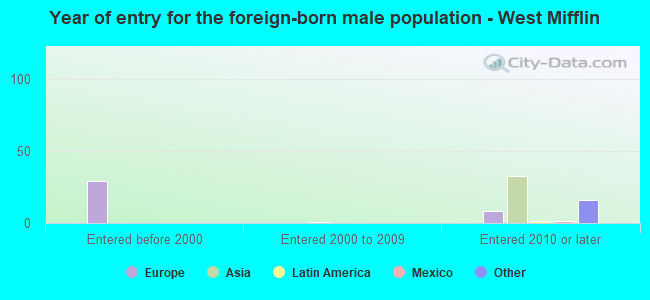
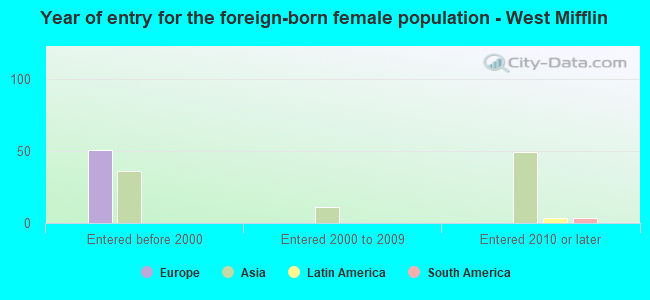
Place of birth - Foreign born (%)
Place of birth - Foreign born (%) - White
Place of birth - Foreign born (%) - Black or African American
Place of birth - Foreign born (%) - Asian
Place of birth - Foreign born (%) - Hispanic or Latino
Place of birth - Foreign born (%) - American Indian and Alaska Native
Place of birth - Foreign born (%) - Multirace
Place of birth - Foreign born (%) - Other Race
Residents speaking English at home (%)
Residents speaking English at home - Born in the United States (%)
Residents speaking English at home - Native, born elsewhere (%)
Residents speaking English at home - Foreign born (%)
Residents speaking Spanish at home (%)
Residents speaking Spanish at home - Born in the United States (%)
Residents speaking Spanish at home - Native, born elsewhere (%)
Residents speaking Spanish at home - Foreign born (%)
Residents speaking other language at home (%)
Residents speaking other language at home - Born in the United States (%)
Residents speaking other language at home - Native, born elsewhere (%)
Residents speaking other language at home - Foreign born (%)
Marital status - Never married (%)
Marital status - Now married (%)
Marital status - Separated (%)
Marital status - Widowed (%)
Marital status - Divorced (%)
Ancestries Reported - Arab (%)
Ancestries Reported - Czech (%)
Ancestries Reported - Danish (%)
Ancestries Reported - Dutch (%)
Ancestries Reported - English (%)
Ancestries Reported - French (%)
Ancestries Reported - French Canadian (%)
Ancestries Reported - German (%)
Ancestries Reported - Greek (%)
Ancestries Reported - Hungarian (%)
Ancestries Reported - Irish (%)
Ancestries Reported - Italian (%)
Ancestries Reported - Lithuanian (%)
Ancestries Reported - Norwegian (%)
Ancestries Reported - Polish (%)
Ancestries Reported - Portuguese (%)
Ancestries Reported - Russian (%)
Ancestries Reported - Scotch-Irish (%)
Ancestries Reported - Scottish (%)
Ancestries Reported - Slovak (%)
Ancestries Reported - Subsaharan African (%)
Ancestries Reported - Swedish (%)
Ancestries Reported - Swiss (%)
Ancestries Reported - Ukrainian (%)
Ancestries Reported - United States (%)
Ancestries Reported - Welsh (%)
Ancestries Reported - West Indian (%)
Ancestries Reported - Other (%)
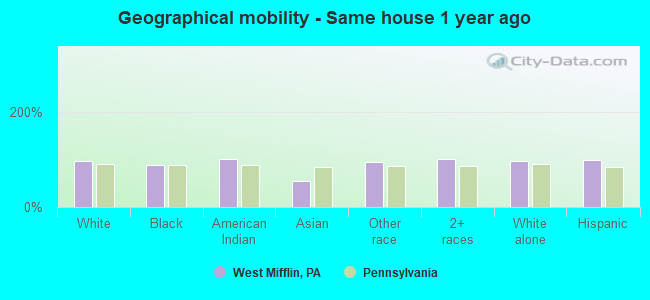
Geographical mobility - Same house 1 year ago (%)
Geographical mobility - Same house 1 year ago (%) - White
Geographical mobility - Same house 1 year ago (%) - Black or African American
Geographical mobility - Same house 1 year ago (%) - Asian
Geographical mobility - Same house 1 year ago (%) - Hispanic or Latino
Geographical mobility - Same house 1 year ago (%) - American Indian and Alaska Native
Geographical mobility - Same house 1 year ago (%) - Multirace
Geographical mobility - Same house 1 year ago (%) - Other Race
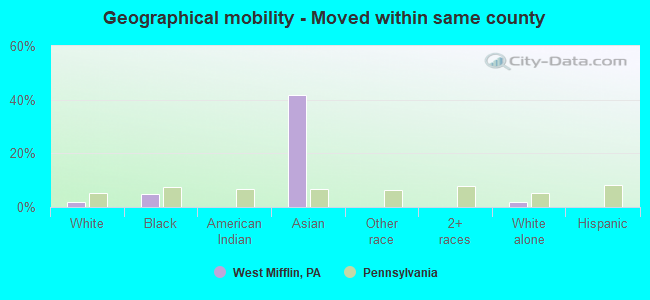
Geographical mobility - Moved within same county (%)
Geographical mobility - Moved within same county (%) - White
Geographical mobility - Moved within same county (%) - Black or African American
Geographical mobility - Moved within same county (%) - Asian
Geographical mobility - Moved within same county (%) - Hispanic or Latino
Geographical mobility - Moved within same county (%) - American Indian and Alaska Native
Geographical mobility - Moved within same county (%) - Multirace
Geographical mobility - Moved within same county (%) - Other Race
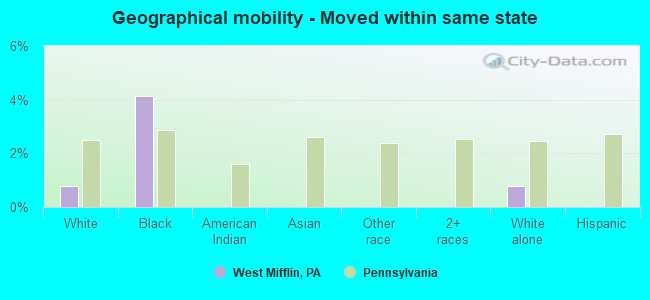
Geographical mobility - Moved from different county within same state (%)
Geographical mobility - Moved from different county within same state (%) - White
Geographical mobility - Moved from different county within same state (%) - Black or African American
Geographical mobility - Moved from different county within same state (%) - Asian
Geographical mobility - Moved from different county within same state (%) - Hispanic or Latino
Geographical mobility - Moved from different county within same state (%) - American Indian and Alaska Native
Geographical mobility - Moved from different county within same state (%) - Multirace
Geographical mobility - Moved from different county within same state (%) - Other Race
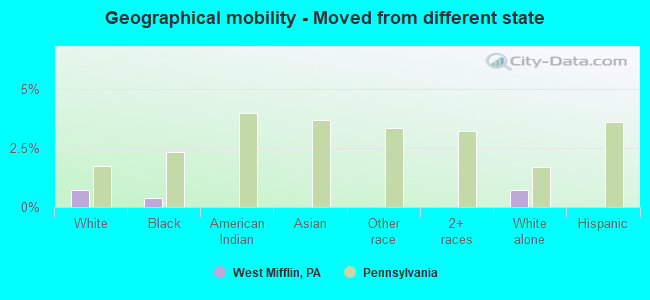
Geographical mobility - Moved from different state (%)
Geographical mobility - Moved from different state (%) - White
Geographical mobility - Moved from different state (%) - Black or African American
Geographical mobility - Moved from different state (%) - Asian
Geographical mobility - Moved from different state (%) - Hispanic or Latino
Geographical mobility - Moved from different state (%) - American Indian and Alaska Native
Geographical mobility - Moved from different state (%) - Multirace
Geographical mobility - Moved from different state (%) - Other Race
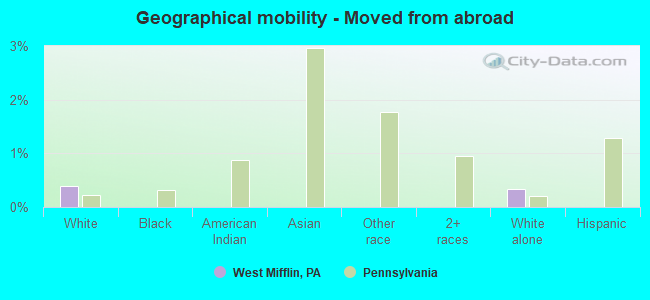
Geographical mobility - Moved from abroad (%)
Geographical mobility - Moved from abroad (%) - White
Geographical mobility - Moved from abroad (%) - Black or African American
Geographical mobility - Moved from abroad (%) - Asian
Geographical mobility - Moved from abroad (%) - Hispanic or Latino
Geographical mobility - Moved from abroad (%) - American Indian and Alaska Native
Geographical mobility - Moved from abroad (%) - Multirace
Geographical mobility - Moved from abroad (%) - Other Race
Place of birth for the foreign-born population - Ireland (%)
Place of birth for the foreign-born population - Denmark (%)
Place of birth for the foreign-born population - Norway (%)
Place of birth for the foreign-born population - Sweden (%)
Place of birth for the foreign-born population - United Kingdom (%)
Place of birth for the foreign-born population - England (%)
Place of birth for the foreign-born population - Scotland (%)
Place of birth for the foreign-born population - Other Northern Europe (%)
Place of birth for the foreign-born population - Austria (%)
Place of birth for the foreign-born population - Belgium (%)
Place of birth for the foreign-born population - France (%)
Place of birth for the foreign-born population - Germany (%)
Place of birth for the foreign-born population - Netherlands (%)
Place of birth for the foreign-born population - Switzerland (%)
Place of birth for the foreign-born population - Other Western Europe (%)
Place of birth for the foreign-born population - Greece (%)
Place of birth for the foreign-born population - Italy (%)
Place of birth for the foreign-born population - Portugal (%)
Place of birth for the foreign-born population - Spain (%)
Place of birth for the foreign-born population - Other Southern Europe (%)
Place of birth for the foreign-born population - Albania (%)
Place of birth for the foreign-born population - Belarus (%)
Place of birth for the foreign-born population - Bosnia and Herzegovina (%)
Place of birth for the foreign-born population - Bulgaria (%)
Place of birth for the foreign-born population - Croatia (%)
Place of birth for the foreign-born population - Czechoslovakia (%)
Place of birth for the foreign-born population - Hungary (%)
Place of birth for the foreign-born population - Latvia (%)
Place of birth for the foreign-born population - Lithuania (%)
Place of birth for the foreign-born population - North Macedonia (Macedonia) (%)
Place of birth for the foreign-born population - Moldova (%)
Place of birth for the foreign-born population - Poland (%)
Place of birth for the foreign-born population - Romania (%)
Place of birth for the foreign-born population - Russia (%)
Place of birth for the foreign-born population - Serbia (%)
Place of birth for the foreign-born population - Ukraine (%)
Place of birth for the foreign-born population - Other Eastern Europe (%)
Place of birth for the foreign-born population - China (%)
Place of birth for the foreign-born population - Hong Kong (%)
Place of birth for the foreign-born population - Taiwan (%)
Place of birth for the foreign-born population - Japan (%)
Place of birth for the foreign-born population - Korea (%)
Place of birth for the foreign-born population - Other Eastern Asia (%)
Place of birth for the foreign-born population - Afghanistan (%)
Place of birth for the foreign-born population - Bangladesh (%)
Place of birth for the foreign-born population - India (%)
Place of birth for the foreign-born population - Iran (%)
Place of birth for the foreign-born population - Kazakhstan (%)
Place of birth for the foreign-born population - Nepal (%)
Place of birth for the foreign-born population - Pakistan (%)
Place of birth for the foreign-born population - Sri Lanka (%)
Place of birth for the foreign-born population - Uzbekistan (%)
Place of birth for the foreign-born population - Other South Central Asia (%)
Place of birth for the foreign-born population - Burma (%)
Place of birth for the foreign-born population - Cambodia (%)
Place of birth for the foreign-born population - Indonesia (%)
Place of birth for the foreign-born population - Laos (%)
Place of birth for the foreign-born population - Malaysia (%)
Place of birth for the foreign-born population - Philippines (%)
Place of birth for the foreign-born population - Singapore (%)
Place of birth for the foreign-born population - Thailand (%)
Place of birth for the foreign-born population - Vietnam (%)
Place of birth for the foreign-born population - Other South Eastern Asia (%)
Place of birth for the foreign-born population - Armenia (%)
Place of birth for the foreign-born population - Iraq (%)
Place of birth for the foreign-born population - Israel (%)
Place of birth for the foreign-born population - Jordan (%)
Place of birth for the foreign-born population - Kuwait (%)
Place of birth for the foreign-born population - Lebanon (%)
Place of birth for the foreign-born population - Saudi Arabia (%)
Place of birth for the foreign-born population - Syria (%)
Place of birth for the foreign-born population - Turkey (%)
Place of birth for the foreign-born population - Yemen (%)
Place of birth for the foreign-born population - Other Western Asia (%)
Place of birth for the foreign-born population - Eritrea (%)
Place of birth for the foreign-born population - Ethiopia (%)
Place of birth for the foreign-born population - Kenya (%)
Place of birth for the foreign-born population - Somalia (%)
Place of birth for the foreign-born population - Uganda (%)
Place of birth for the foreign-born population - Zimbabwe (%)
Place of birth for the foreign-born population - Other Eastern Africa (%)
Place of birth for the foreign-born population - Cameroon (%)
Place of birth for the foreign-born population - Congo (%)
Place of birth for the foreign-born population - Democratic Republic of Congo (Zaire) (%)
Place of birth for the foreign-born population - Other Middle Africa (%)
Place of birth for the foreign-born population - Egypt (%)
Place of birth for the foreign-born population - Morocco (%)
Place of birth for the foreign-born population - Sudan (%)
Place of birth for the foreign-born population - Other Northern Africa (%)
Place of birth for the foreign-born population - South Africa (%)
Place of birth for the foreign-born population - Other Southern Africa (%)
Place of birth for the foreign-born population - Cabo Verde (%)
Place of birth for the foreign-born population - Ghana (%)
Place of birth for the foreign-born population - Liberia (%)
Place of birth for the foreign-born population - Nigeria (%)
Place of birth for the foreign-born population - Senegal (%)
Place of birth for the foreign-born population - Sierra Leone (%)
Place of birth for the foreign-born population - Other Western Africa (%)
Place of birth for the foreign-born population - Australia (%)
Place of birth for the foreign-born population - New Zealand (%)
Place of birth for the foreign-born population - Fiji (%)
Place of birth for the foreign-born population - Micronesia (%)
Place of birth for the foreign-born population - Bahamas (%)
Place of birth for the foreign-born population - Barbados (%)
Place of birth for the foreign-born population - Cuba (%)
Place of birth for the foreign-born population - Dominica (%)
Place of birth for the foreign-born population - Dominican Republic (%)
Place of birth for the foreign-born population - Grenada (%)
Place of birth for the foreign-born population - Haiti (%)
Place of birth for the foreign-born population - Jamaica (%)
Place of birth for the foreign-born population - St. Vincent and the Grenadines (%)
Place of birth for the foreign-born population - Trinidad and Tobago (%)
Place of birth for the foreign-born population - West Indies (%)
Place of birth for the foreign-born population - Other Caribbean (%)
Place of birth for the foreign-born population - Belize (%)
Place of birth for the foreign-born population - Costa Rica (%)
Place of birth for the foreign-born population - El Salvador (%)
Place of birth for the foreign-born population - Guatemala (%)
Place of birth for the foreign-born population - Honduras (%)
Place of birth for the foreign-born population - Mexico (%)
Place of birth for the foreign-born population - Nicaragua (%)
Place of birth for the foreign-born population - Panama (%)
Place of birth for the foreign-born population - Other Central America (%)
Place of birth for the foreign-born population - Argentina (%)
Place of birth for the foreign-born population - Bolivia (%)
Place of birth for the foreign-born population - Brazil (%)
Place of birth for the foreign-born population - Chile (%)
Place of birth for the foreign-born population - Colombia (%)
Place of birth for the foreign-born population - Ecuador (%)
Place of birth for the foreign-born population - Guyana (%)
Place of birth for the foreign-born population - Peru (%)
Place of birth for the foreign-born population - Uruguay (%)
Place of birth for the foreign-born population - Venezuela (%)
Place of birth for the foreign-born population - Other South America (%)
Place of birth for the foreign-born population - Canada (%)
Place of birth for the foreign-born population - Other Northern America (%)
Place of birth for the foreign-born population - Other (%)
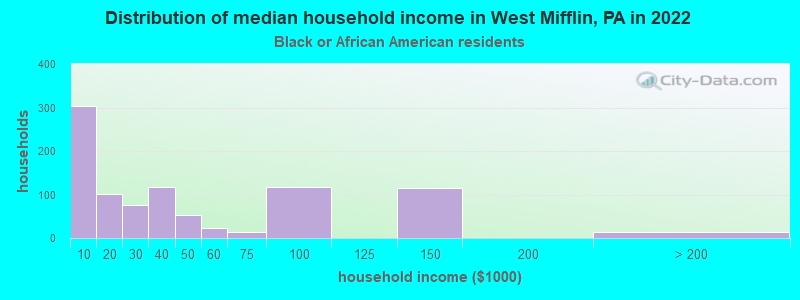
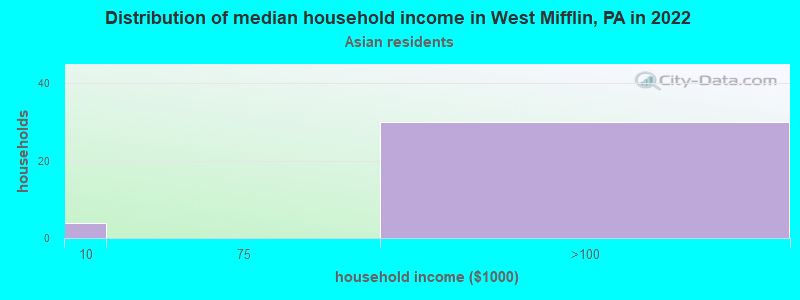
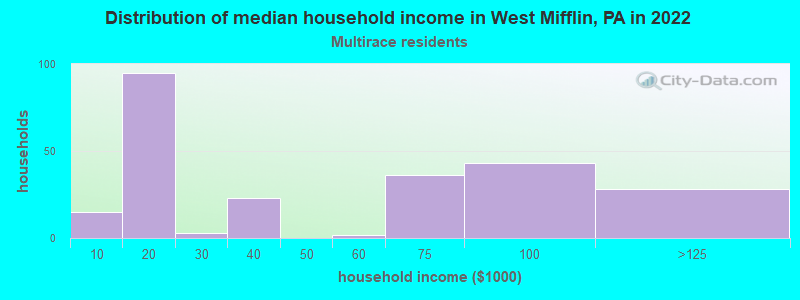
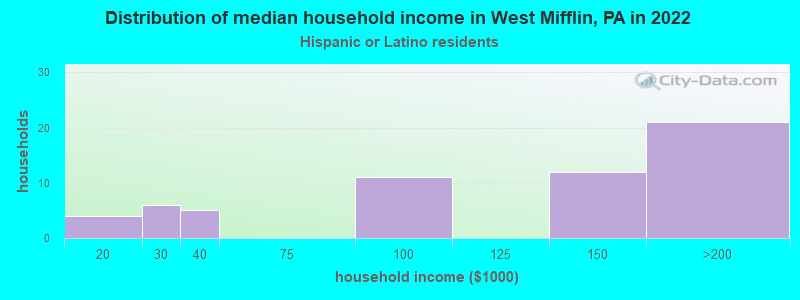
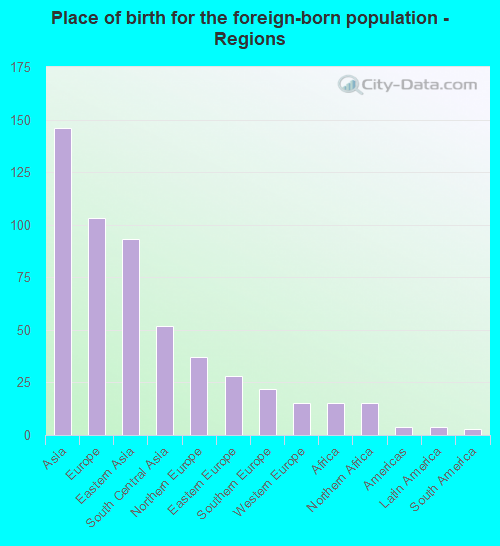
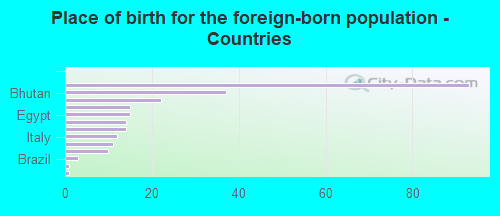
According to 2022 data, the most numerous races in West Mifflin, PA are White alone (16,006 residents), Black alone (1,682 residents), and Hispanic (361 residents). 94.3% of West Mifflin residents speak English at home. 1.4% of West Mifflin, PA residents are foreign-born , which is 400.8% less than the foreign-born rate of 7.0% across the entire state of Pennsylvania.
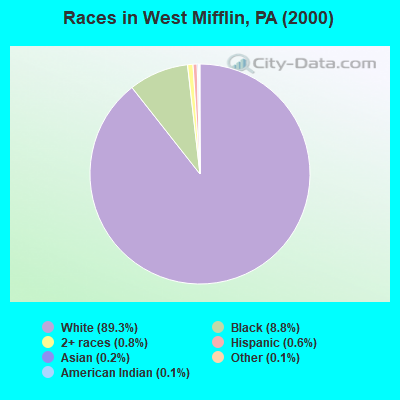
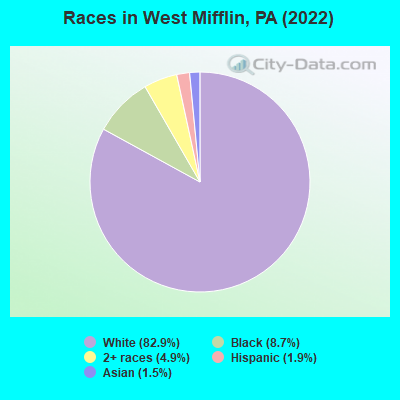
Race distribution in West Mifflin
2000 2022
10,322,455 84.1% White alone 1,202,437 9.8% Black alone 394,088 3.2% Hispanic 218,296 1.8% Asian alone 113,097 0.9% Two or more races 13,086 0.1% Other race alone 14,904 0.1% American Indian alone 2,691 0.02% Native Hawaiian and Other
9,487,228 73.1% White alone 1,311,581 10.1% Black alone 1,115,997 8.6% Hispanic 493,942 3.8% Two or more races 487,124 3.8% Asian alone 63,582 0.5% Other race alone 10,130 0.08% American Indian alone 2,424 0.02% Native Hawaiian and Other
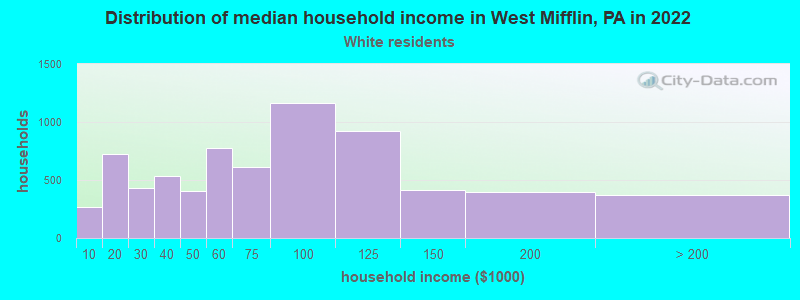
Income and house value in West Mifflin Median household income in 2022 $68,288 White non-Hispanic householders$35,758 Black householders$93,521 Hispanic or Latino race householdersMedian 2022 house value $137,063 White Non-Hispanic householders$120,027 Black or African American householders$106,475 American Indian or Alaska Native householders$87,116 Two or more races householders$72,597 Hispanic or Latino householders
Median age by race in West Mifflin
48.2 Median age for White residents45.7 50.7 32.0 Median age for Black or African American residents32.5 30.4 -642,857,142.2 Median age for American Indian / Alaska Native residents-714,583,332.6 -577,519,379.3 39.4 Median age for Asian residents3.9 44.3 -656,534,953.8 Median age for Native Hawaiian / Pacific Islander residents-919,148,935.3 -747,474,746.7 4.0 Median age for Other race residents-689,440,993.1 3.9 17.0 Median age for Two or more races residents18.3 10.1 48.2 Median age for White alone residents45.6 50.5 11.2 Median age for Hispanic or Latino residents11.6 8.8
Owner/renter occupied households by race in West Mifflin
House owners and renters - White residents 6,033 86.5% Owner occupied944 13.5% Renter occupiedHouse owners and renters - Black or African American residents 289 32.7% Owner occupied596 67.3% Renter occupiedHouse owners and renters - Asian residents 40 91.5% Owner occupied4 8.5% Renter occupiedHouse owners and renters - Other race residents 4 100.0% Renter occupiedHouse owners and renters - Two or more races residents 180 78.3% Owner occupied50 21.7% Renter occupiedHouse owners and renters - White alone residents 6,011 86.4% Owner occupied948 13.6% Renter occupiedHouse owners and renters - Hispanic or Latino residents 34 60.2% Owner occupied22 39.8% Renter occupied
Language usage in West Mifflin
English speakers - Total 94.3% of residents of West Mifflin speak English at home.
3.4% of residents speak Spanish at home 608 96.1% Speak English very well25 3.9% Speak English less than very well2.4% of residents speak other language at home 255 58.1% Speak English very well184 41.9% Speak English less than very well
English speakers - Born in the United States 90.6% of residents of West Mifflin speak English at home.
5.0% of residents speak Spanish at home 79 79.0% Speak English very well21 21.0% Speak English less than very well3.1% of residents speak other language at home 61 100.0% Speak English very well
English speakers - Native, born elsewhere 82.0% of residents of West Mifflin speak English at home.
1.6% of residents speak other language at home 1 100.0% Speak English very well
English speakers - Foreign-born 18.3% of residents of West Mifflin speak English at home.
80.8% of residents speak other language at home 71 36.6% Speak English very well123 63.4% Speak English less than very well
White (Caucasian) - Speak only English Native:
96.2% (14,902)Foreign-born:
44.7% (43)
White (Caucasian) - Speak another language Native:
3.8% (593)Foreign-born:
55.8% (53)
Black or African American - Speak another language Native:
4.4% (77)Foreign-born:
80.0% (2)
Asian - Speak another language Native:
100.0% (121)Foreign-born:
100.0% (134)
White alone - Speak only English Native:
96.1% (14,873)Foreign-born:
36.9% (35)
White alone - Speak another language Native:
4.1% (633)Foreign-born:
63.1% (59)
Hispanic or Latino - Speak only English Native:
66.3% (216)Foreign-born:
68.8% (9)
Hispanic or Latino - Speak another language Native:
33.3% (108)Foreign-born:
9.4% (1)
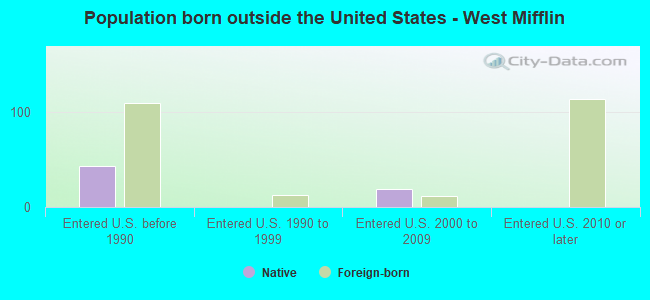
Foreign-born residents in West Mifflin 270 residents are foreign born
This city:
1.4%Pennsylvania:
7.3%
Marital status for residents in West Mifflin Marital status - White (Caucasian) population 15 years and over
Males 35.2% Never married50.5% Now married1.5% Separated2.4% Widowed10.5% DivorcedFemales 26.5% Never married48.0% Now married1.0% Separated14.3% Widowed10.3% DivorcedWomen who gave birth in the past 12 months Now married:
67.3% (66)Unmarried:
32.7% (32)
Women who did not give birth in the past 12 months Now married:
47.3% (1,353)Unmarried:
52.7% (1,506)
Marital status - Black or African American population 15 years and over
Males 61.7% Never married14.4% Now married3.8% Separated17.6% Widowed2.5% DivorcedFemales 52.9% Never married7.1% Now married0.0% Separated9.6% Widowed30.4% DivorcedWomen who gave birth in the past 12 months Now married:
0.0% (0)Unmarried:
100.0% (100)
Women who did not give birth in the past 12 months Now married:
6.4% (18)Unmarried:
93.6% (266)
Marital status - Asian population 15 years and over
Males 12.2% Never married0.0% Now married0.0% Separated0.0% Widowed87.8% DivorcedFemales 33.6% Never married9.6% Now married28.1% Separated0.0% Widowed28.8% DivorcedWomen who did not give birth in the past 12 months Now married:
0.0% (0)Unmarried:
100.0% (95)
Marital status - Two or more races population 15 years and over
Males 83.1% Never married16.4% Now married0.0% Separated0.0% Widowed0.5% DivorcedFemales 20.6% Never married41.7% Now married0.0% Separated0.0% Widowed37.7% DivorcedWomen who gave birth in the past 12 months Now married:
100.0% (33)Unmarried:
0.0% (0)
Women who did not give birth in the past 12 months Now married:
36.8% (29)Unmarried:
63.2% (49)
Marital status - White alone, not Hispanic / Latino population 15 years and over
Males 35.0% Never married50.5% Now married1.5% Separated2.4% Widowed10.6% DivorcedFemales 26.6% Never married47.8% Now married1.0% Separated14.3% Widowed10.4% DivorcedWomen who gave birth in the past 12 months Now married:
67.3% (66)Unmarried:
32.7% (32)
Women who did not give birth in the past 12 months Now married:
47.3% (1,357)Unmarried:
52.7% (1,510)
Marital status - Hispanic or Latino population 15 years and over
Males 55.7% Never married44.3% Now married0.0% Separated0.0% Widowed0.0% DivorcedFemales 14.0% Never married76.7% Now married0.0% Separated0.0% Widowed9.3% DivorcedWomen who did not give birth in the past 12 months Now married:
23.1% (3)Unmarried:
76.9% (11)
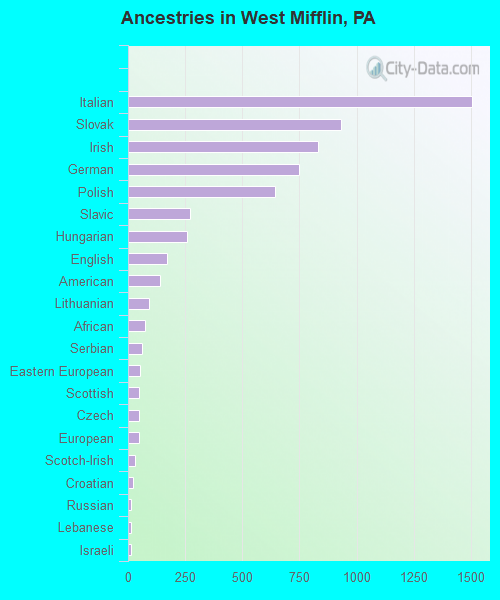
Ancestries in West Mifflin
1,504 20.5% Italian930 12.7% Slovak829 11.3% Irish747 10.2% German645 8.8% Polish270 3.7% Slavic257 3.5% Hungarian172 2.4% English141 1.9% American91 1.2% Lithuanian74 1.0% African60 0.8% Serbian51 0.7% Eastern European48 0.7% Scottish46 0.6% Czech46 0.6% European31 0.4% Scotch-Irish20 0.3% Croatian15 0.2% Russian14 0.2% Lebanese14 0.2% Israeli13 0.2% Northern European13 0.2% Swedish6 0.08% Yugoslavian5 0.07% French Canadian4 0.05% French2 0.03% Syrian2 0.03% Ukrainian
Children Nativity (place of birth) in West Mifflin
Children under 6 years - Living with two parents Both parents native 502 100.0% NativeChildren under 6 years - Living with one parent Native parent 491 100.0% NativeForeign-born parent 107 100.0% Native
Children 6 to 17 years - Living with two parents Both parents native 1,953 100.0% NativeOne native, one foreign-born parent 34 100.0% NativeChildren 6 to 17 years - Living with one parent Native parent 644 100.0% Native
Grandparents responsible for own grandchildren in West Mifflin
Grandparents (30 to 59 years) White / Caucasian 12 100.0% Responsible for grandchildrenBlack or African American 11 100.0% Not responsible for grandchildrenWhite alone, not Hispanic / Latino 12 100.0% Responsible for grandchildrenGrandparents (60 years and over) White / Caucasian 69 77.6% Responsible for grandchildren20 22.4% Not responsible for grandchildrenWhite alone, not Hispanic / Latino 70 77.5% Responsible for grandchildren20 22.5% Not responsible for grandchildren