Races in Westchester, Florida (FL) Detailed Stats
Data:
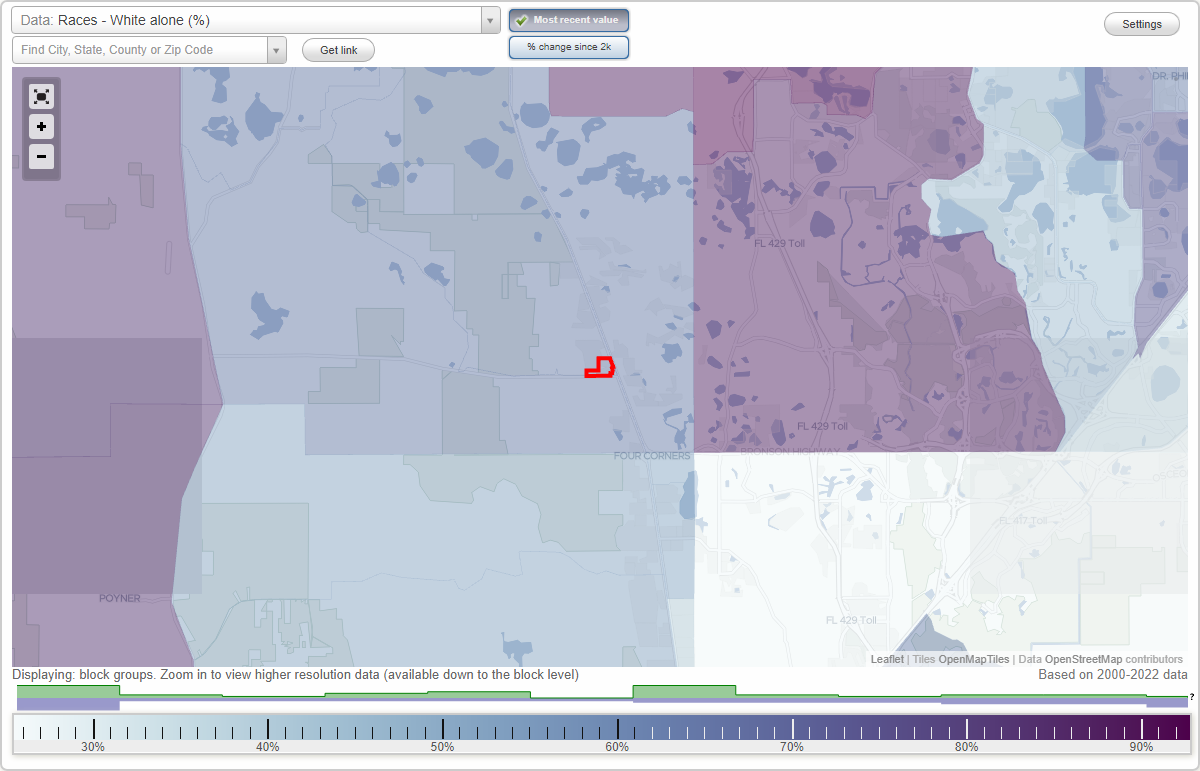
Races - White alone (%)
Races - White alone (% change since 2000)
Races - Black alone (%)
Races - Black alone (% change since 2000)
Races - American Indian alone (%)
Races - American Indian alone (% change since 2000)
Races - Asian alone (%)
Races - Asian alone (% change since 2000)
Races - Hispanic (%)
Races - Hispanic (% change since 2000)
Races - Native Hawaiian and Other Pacific Islander alone (%)
Races - Native Hawaiian and Other Pacific Islander alone (% change since 2000)
Races - Two or more races(%)
Races - Two or more races(% change since 2000)
Races - Other race alone (%)
Races - Other race alone (% change since 2000)
Racial diversity
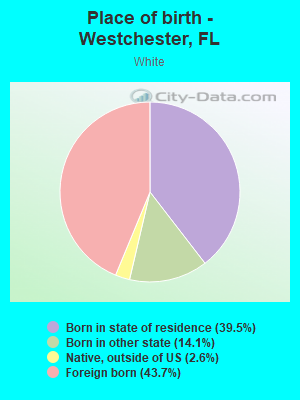
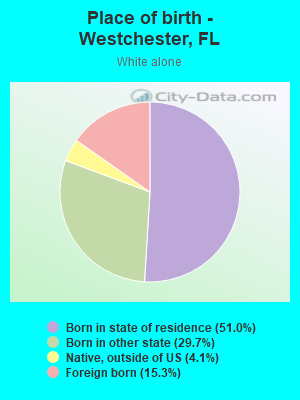
Place of birth - Born in state of residence (%)
Place of birth - Born in state of residence (%) - White
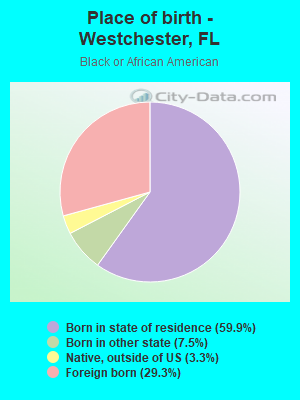
Place of birth - Born in state of residence (%) - Black or African American
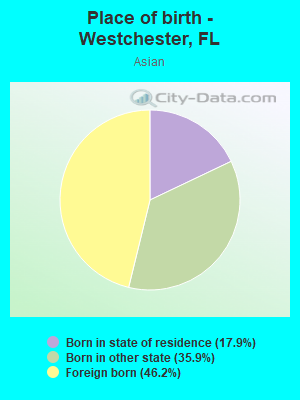
Place of birth - Born in state of residence (%) - Asian
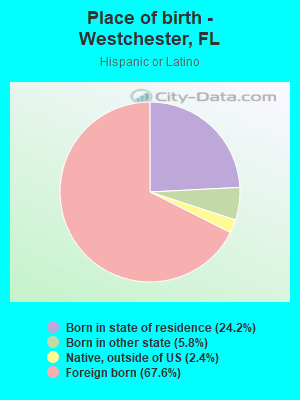
Place of birth - Born in state of residence (%) - Hispanic or Latino
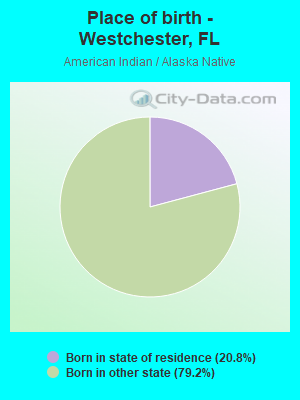
Place of birth - Born in state of residence (%) - American Indian and Alaska Native
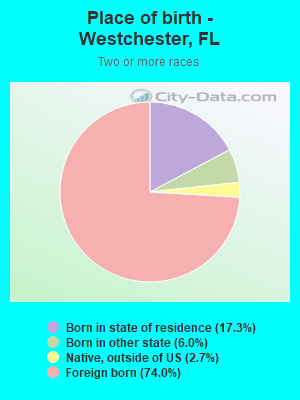
Place of birth - Born in state of residence (%) - Multirace
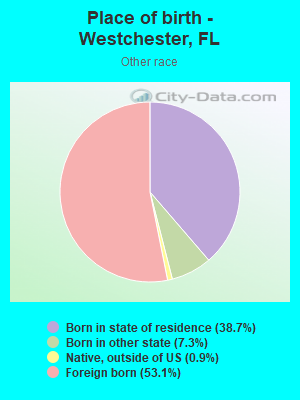
Place of birth - Born in state of residence (%) - Other Race
Place of birth - Born in other state (%)
Place of birth - Born in other state (%) - White
Place of birth - Born in other state (%) - Black or African American
Place of birth - Born in other state (%) - Asian
Place of birth - Born in other state (%) - Hispanic or Latino
Place of birth - Born in other state (%) - American Indian and Alaska Native
Place of birth - Born in other state (%) - Multirace
Place of birth - Born in other state (%) - Other Race
Place of birth - Native, outside of US (%)
Place of birth - Native, outside of US (%) - White
Place of birth - Native, outside of US (%) - Black or African American
Place of birth - Native, outside of US (%) - Asian
Place of birth - Native, outside of US (%) - Hispanic or Latino
Place of birth - Native, outside of US (%) - American Indian and Alaska Native
Place of birth - Native, outside of US (%) - Multirace
Place of birth - Native, outside of US (%) - Other Race
Place of birth - Foreign born (%)
Place of birth - Foreign born (%) - White
Place of birth - Foreign born (%) - Black or African American
Place of birth - Foreign born (%) - Asian
Place of birth - Foreign born (%) - Hispanic or Latino
Place of birth - Foreign born (%) - American Indian and Alaska Native
Place of birth - Foreign born (%) - Multirace
Place of birth - Foreign born (%) - Other Race
Residents speaking English at home (%)
Residents speaking English at home - Born in the United States (%)
Residents speaking English at home - Native, born elsewhere (%)
Residents speaking English at home - Foreign born (%)
Residents speaking Spanish at home (%)
Residents speaking Spanish at home - Born in the United States (%)
Residents speaking Spanish at home - Native, born elsewhere (%)
Residents speaking Spanish at home - Foreign born (%)
Residents speaking other language at home (%)
Residents speaking other language at home - Born in the United States (%)
Residents speaking other language at home - Native, born elsewhere (%)
Residents speaking other language at home - Foreign born (%)
Marital status - Never married (%)
Marital status - Now married (%)
Marital status - Separated (%)
Marital status - Widowed (%)
Marital status - Divorced (%)
Ancestries Reported - Arab (%)
Ancestries Reported - Czech (%)
Ancestries Reported - Danish (%)
Ancestries Reported - Dutch (%)
Ancestries Reported - English (%)
Ancestries Reported - French (%)
Ancestries Reported - French Canadian (%)
Ancestries Reported - German (%)
Ancestries Reported - Greek (%)
Ancestries Reported - Hungarian (%)
Ancestries Reported - Irish (%)
Ancestries Reported - Italian (%)
Ancestries Reported - Lithuanian (%)
Ancestries Reported - Norwegian (%)
Ancestries Reported - Polish (%)
Ancestries Reported - Portuguese (%)
Ancestries Reported - Russian (%)
Ancestries Reported - Scotch-Irish (%)
Ancestries Reported - Scottish (%)
Ancestries Reported - Slovak (%)
Ancestries Reported - Subsaharan African (%)
Ancestries Reported - Swedish (%)
Ancestries Reported - Swiss (%)
Ancestries Reported - Ukrainian (%)
Ancestries Reported - United States (%)
Ancestries Reported - Welsh (%)
Ancestries Reported - West Indian (%)
Ancestries Reported - Other (%)
Geographical mobility - Same house 1 year ago (%)
Geographical mobility - Same house 1 year ago (%) - White
Geographical mobility - Same house 1 year ago (%) - Black or African American
Geographical mobility - Same house 1 year ago (%) - Asian
Geographical mobility - Same house 1 year ago (%) - Hispanic or Latino
Geographical mobility - Same house 1 year ago (%) - American Indian and Alaska Native
Geographical mobility - Same house 1 year ago (%) - Multirace
Geographical mobility - Same house 1 year ago (%) - Other Race
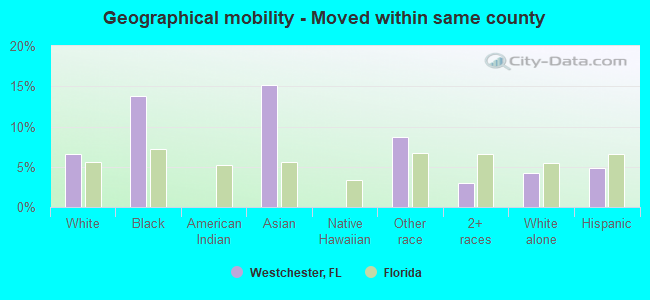
Geographical mobility - Moved within same county (%)
Geographical mobility - Moved within same county (%) - White
Geographical mobility - Moved within same county (%) - Black or African American
Geographical mobility - Moved within same county (%) - Asian
Geographical mobility - Moved within same county (%) - Hispanic or Latino
Geographical mobility - Moved within same county (%) - American Indian and Alaska Native
Geographical mobility - Moved within same county (%) - Multirace
Geographical mobility - Moved within same county (%) - Other Race
Geographical mobility - Moved from different county within same state (%)
Geographical mobility - Moved from different county within same state (%) - White
Geographical mobility - Moved from different county within same state (%) - Black or African American
Geographical mobility - Moved from different county within same state (%) - Asian
Geographical mobility - Moved from different county within same state (%) - Hispanic or Latino
Geographical mobility - Moved from different county within same state (%) - American Indian and Alaska Native
Geographical mobility - Moved from different county within same state (%) - Multirace
Geographical mobility - Moved from different county within same state (%) - Other Race
Geographical mobility - Moved from different state (%)
Geographical mobility - Moved from different state (%) - White
Geographical mobility - Moved from different state (%) - Black or African American
Geographical mobility - Moved from different state (%) - Asian
Geographical mobility - Moved from different state (%) - Hispanic or Latino
Geographical mobility - Moved from different state (%) - American Indian and Alaska Native
Geographical mobility - Moved from different state (%) - Multirace
Geographical mobility - Moved from different state (%) - Other Race
Geographical mobility - Moved from abroad (%)
Geographical mobility - Moved from abroad (%) - White
Geographical mobility - Moved from abroad (%) - Black or African American
Geographical mobility - Moved from abroad (%) - Asian
Geographical mobility - Moved from abroad (%) - Hispanic or Latino
Geographical mobility - Moved from abroad (%) - American Indian and Alaska Native
Geographical mobility - Moved from abroad (%) - Multirace
Geographical mobility - Moved from abroad (%) - Other Race
Place of birth for the foreign-born population - Ireland (%)
Place of birth for the foreign-born population - Denmark (%)
Place of birth for the foreign-born population - Norway (%)
Place of birth for the foreign-born population - Sweden (%)
Place of birth for the foreign-born population - United Kingdom (%)
Place of birth for the foreign-born population - England (%)
Place of birth for the foreign-born population - Scotland (%)
Place of birth for the foreign-born population - Other Northern Europe (%)
Place of birth for the foreign-born population - Austria (%)
Place of birth for the foreign-born population - Belgium (%)
Place of birth for the foreign-born population - France (%)
Place of birth for the foreign-born population - Germany (%)
Place of birth for the foreign-born population - Netherlands (%)
Place of birth for the foreign-born population - Switzerland (%)
Place of birth for the foreign-born population - Other Western Europe (%)
Place of birth for the foreign-born population - Greece (%)
Place of birth for the foreign-born population - Italy (%)
Place of birth for the foreign-born population - Portugal (%)
Place of birth for the foreign-born population - Spain (%)
Place of birth for the foreign-born population - Other Southern Europe (%)
Place of birth for the foreign-born population - Albania (%)
Place of birth for the foreign-born population - Belarus (%)
Place of birth for the foreign-born population - Bosnia and Herzegovina (%)
Place of birth for the foreign-born population - Bulgaria (%)
Place of birth for the foreign-born population - Croatia (%)
Place of birth for the foreign-born population - Czechoslovakia (%)
Place of birth for the foreign-born population - Hungary (%)
Place of birth for the foreign-born population - Latvia (%)
Place of birth for the foreign-born population - Lithuania (%)
Place of birth for the foreign-born population - North Macedonia (Macedonia) (%)
Place of birth for the foreign-born population - Moldova (%)
Place of birth for the foreign-born population - Poland (%)
Place of birth for the foreign-born population - Romania (%)
Place of birth for the foreign-born population - Russia (%)
Place of birth for the foreign-born population - Serbia (%)
Place of birth for the foreign-born population - Ukraine (%)
Place of birth for the foreign-born population - Other Eastern Europe (%)
Place of birth for the foreign-born population - China (%)
Place of birth for the foreign-born population - Hong Kong (%)
Place of birth for the foreign-born population - Taiwan (%)
Place of birth for the foreign-born population - Japan (%)
Place of birth for the foreign-born population - Korea (%)
Place of birth for the foreign-born population - Other Eastern Asia (%)
Place of birth for the foreign-born population - Afghanistan (%)
Place of birth for the foreign-born population - Bangladesh (%)
Place of birth for the foreign-born population - India (%)
Place of birth for the foreign-born population - Iran (%)
Place of birth for the foreign-born population - Kazakhstan (%)
Place of birth for the foreign-born population - Nepal (%)
Place of birth for the foreign-born population - Pakistan (%)
Place of birth for the foreign-born population - Sri Lanka (%)
Place of birth for the foreign-born population - Uzbekistan (%)
Place of birth for the foreign-born population - Other South Central Asia (%)
Place of birth for the foreign-born population - Burma (%)
Place of birth for the foreign-born population - Cambodia (%)
Place of birth for the foreign-born population - Indonesia (%)
Place of birth for the foreign-born population - Laos (%)
Place of birth for the foreign-born population - Malaysia (%)
Place of birth for the foreign-born population - Philippines (%)
Place of birth for the foreign-born population - Singapore (%)
Place of birth for the foreign-born population - Thailand (%)
Place of birth for the foreign-born population - Vietnam (%)
Place of birth for the foreign-born population - Other South Eastern Asia (%)
Place of birth for the foreign-born population - Armenia (%)
Place of birth for the foreign-born population - Iraq (%)
Place of birth for the foreign-born population - Israel (%)
Place of birth for the foreign-born population - Jordan (%)
Place of birth for the foreign-born population - Kuwait (%)
Place of birth for the foreign-born population - Lebanon (%)
Place of birth for the foreign-born population - Saudi Arabia (%)
Place of birth for the foreign-born population - Syria (%)
Place of birth for the foreign-born population - Turkey (%)
Place of birth for the foreign-born population - Yemen (%)
Place of birth for the foreign-born population - Other Western Asia (%)
Place of birth for the foreign-born population - Eritrea (%)
Place of birth for the foreign-born population - Ethiopia (%)
Place of birth for the foreign-born population - Kenya (%)
Place of birth for the foreign-born population - Somalia (%)
Place of birth for the foreign-born population - Uganda (%)
Place of birth for the foreign-born population - Zimbabwe (%)
Place of birth for the foreign-born population - Other Eastern Africa (%)
Place of birth for the foreign-born population - Cameroon (%)
Place of birth for the foreign-born population - Congo (%)
Place of birth for the foreign-born population - Democratic Republic of Congo (Zaire) (%)
Place of birth for the foreign-born population - Other Middle Africa (%)
Place of birth for the foreign-born population - Egypt (%)
Place of birth for the foreign-born population - Morocco (%)
Place of birth for the foreign-born population - Sudan (%)
Place of birth for the foreign-born population - Other Northern Africa (%)
Place of birth for the foreign-born population - South Africa (%)
Place of birth for the foreign-born population - Other Southern Africa (%)
Place of birth for the foreign-born population - Cabo Verde (%)
Place of birth for the foreign-born population - Ghana (%)
Place of birth for the foreign-born population - Liberia (%)
Place of birth for the foreign-born population - Nigeria (%)
Place of birth for the foreign-born population - Senegal (%)
Place of birth for the foreign-born population - Sierra Leone (%)
Place of birth for the foreign-born population - Other Western Africa (%)
Place of birth for the foreign-born population - Australia (%)
Place of birth for the foreign-born population - New Zealand (%)
Place of birth for the foreign-born population - Fiji (%)
Place of birth for the foreign-born population - Micronesia (%)
Place of birth for the foreign-born population - Bahamas (%)
Place of birth for the foreign-born population - Barbados (%)
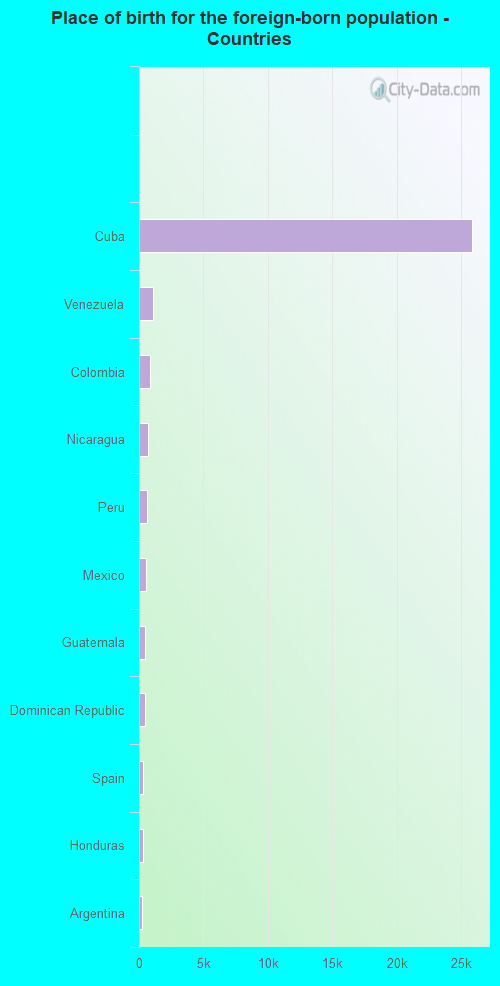
Place of birth for the foreign-born population - Cuba (%)
Place of birth for the foreign-born population - Dominica (%)
Place of birth for the foreign-born population - Dominican Republic (%)
Place of birth for the foreign-born population - Grenada (%)
Place of birth for the foreign-born population - Haiti (%)
Place of birth for the foreign-born population - Jamaica (%)
Place of birth for the foreign-born population - St. Vincent and the Grenadines (%)
Place of birth for the foreign-born population - Trinidad and Tobago (%)
Place of birth for the foreign-born population - West Indies (%)
Place of birth for the foreign-born population - Other Caribbean (%)
Place of birth for the foreign-born population - Belize (%)
Place of birth for the foreign-born population - Costa Rica (%)
Place of birth for the foreign-born population - El Salvador (%)
Place of birth for the foreign-born population - Guatemala (%)
Place of birth for the foreign-born population - Honduras (%)
Place of birth for the foreign-born population - Mexico (%)
Place of birth for the foreign-born population - Nicaragua (%)
Place of birth for the foreign-born population - Panama (%)
Place of birth for the foreign-born population - Other Central America (%)
Place of birth for the foreign-born population - Argentina (%)
Place of birth for the foreign-born population - Bolivia (%)
Place of birth for the foreign-born population - Brazil (%)
Place of birth for the foreign-born population - Chile (%)
Place of birth for the foreign-born population - Colombia (%)
Place of birth for the foreign-born population - Ecuador (%)
Place of birth for the foreign-born population - Guyana (%)
Place of birth for the foreign-born population - Peru (%)
Place of birth for the foreign-born population - Uruguay (%)
Place of birth for the foreign-born population - Venezuela (%)
Place of birth for the foreign-born population - Other South America (%)
Place of birth for the foreign-born population - Canada (%)
Place of birth for the foreign-born population - Other Northern America (%)
Place of birth for the foreign-born population - Other (%)
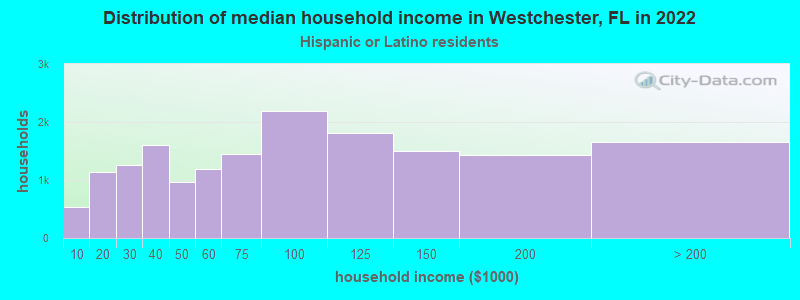
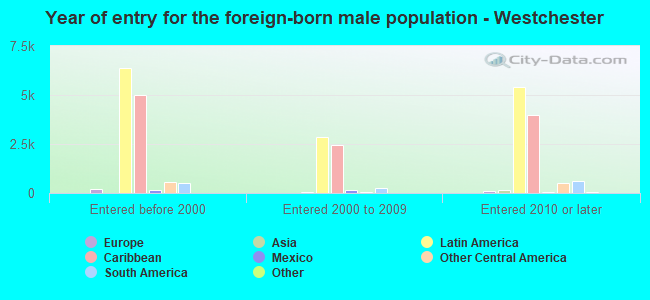
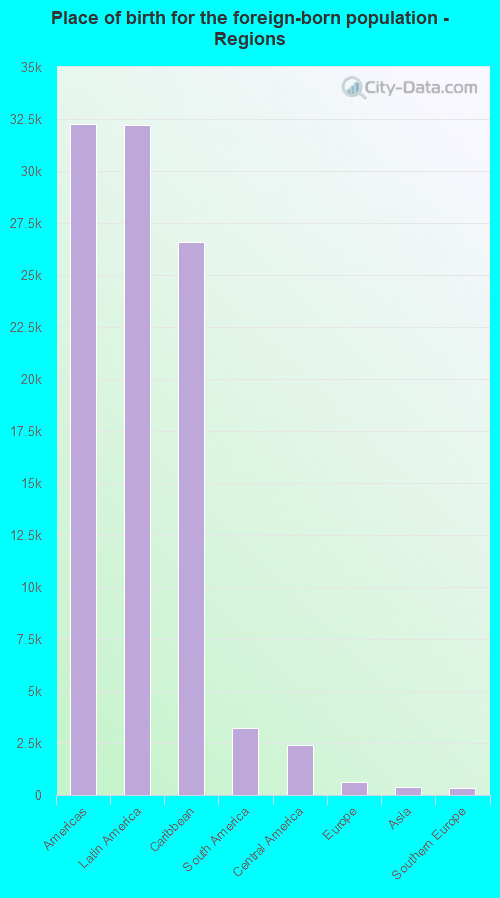
According to 2022 data, the most numerous races in Westchester, FL are White alone (3,983 residents), Hispanic (47,353 residents), and Black alone (1,138 residents). 12.7% of Westchester residents speak English at home. 62.2% of Westchester, FL residents are foreign-born (59.9% born in Latin America), which is 66.3% greater than the foreign-born rate of 21.0% across the entire state of Florida.
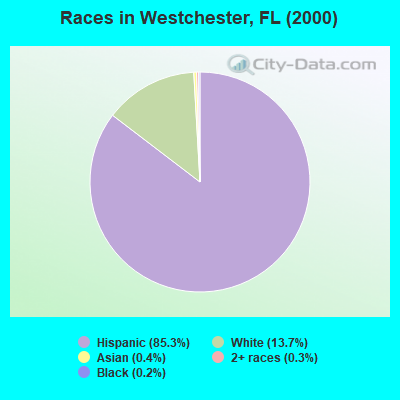
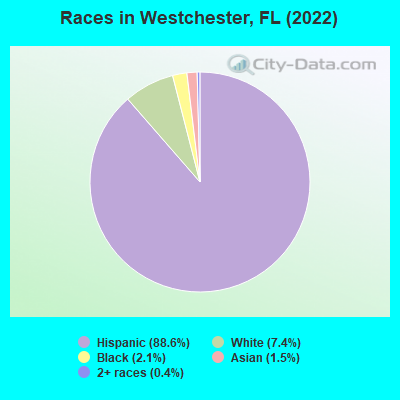
Race distribution in Westchester
2000 2022
10,458,509 65.4% White alone 2,682,715 16.8% Hispanic 2,264,268 14.2% Black alone 261,693 1.6% Asian alone 236,954 1.5% Two or more races 42,358 0.3% American Indian alone 28,994 0.2% Other race alone 6,887 0.04% Native Hawaiian and Other
11,309,403 50.8% White alone 6,025,039 27.1% Hispanic 3,241,015 14.6% Black alone 861,630 3.9% Two or more races 623,692 2.8% Asian alone 152,054 0.7% Other race alone 22,504 0.1% American Indian alone 9,486 0.04% Native Hawaiian and Other
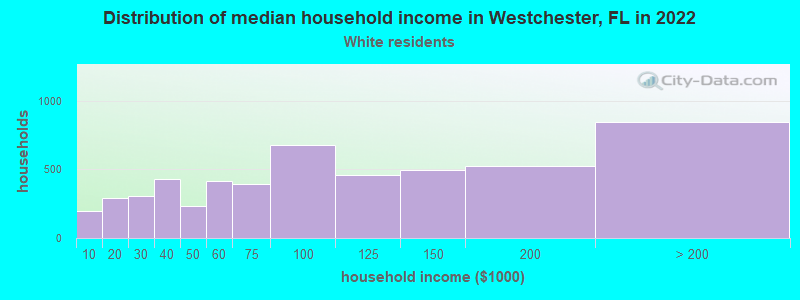
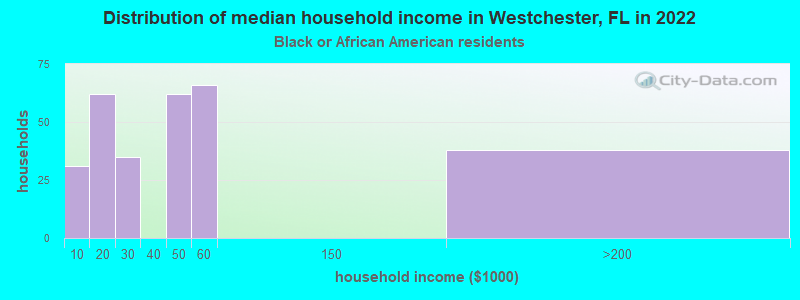
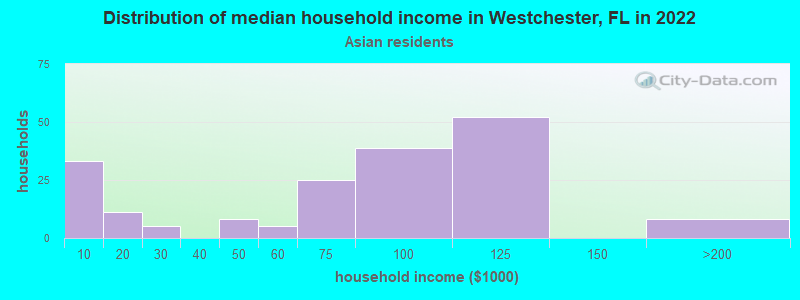
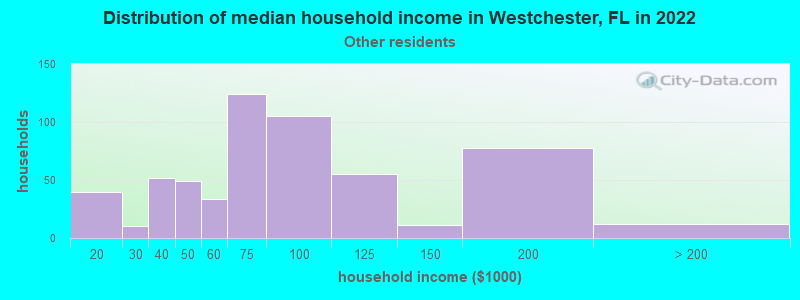
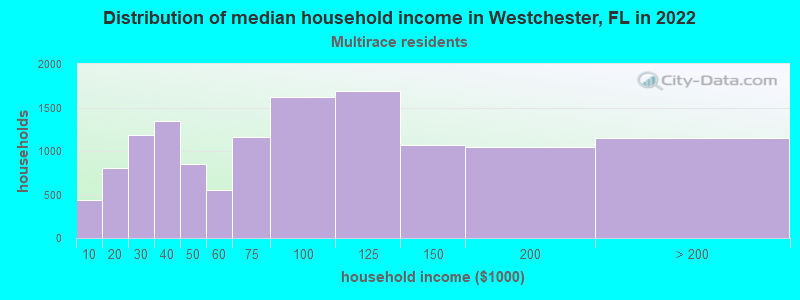
Income and house value in Westchester Median household income in 2022 $87,636 White non-Hispanic householders$46,421 Black householders$81,717 Asian householders$67,899 Some other race householders$74,994 Two or more races householders$76,659 Hispanic or Latino race householdersMedian 2022 house value $495,080 White Non-Hispanic householders$494,720 Black or African American householders $349,002 Asian householders$500,117 Some other race householders$486,085 Two or more races householders$523,504 Hispanic or Latino householders
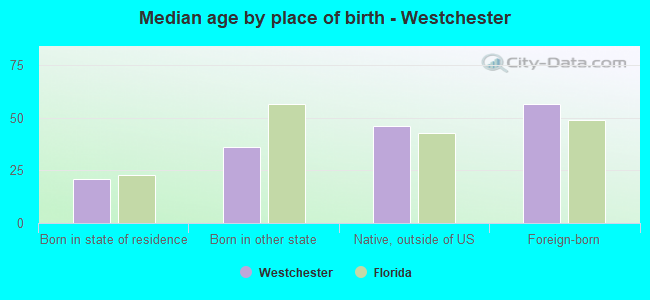
Median age by race in Westchester
40.6 Median age for White residents40.8 40.7 22.2 Median age for Black or African American residents22.2 22.3 63.8 Median age for American Indian / Alaska Native residents-543,352,600.6 22.4 24.0 Median age for Asian residents25.2 22.2 -679,849,340.2 Median age for Native Hawaiian / Pacific Islander residents-858,307,848.3 -443,298,968.6 36.8 Median age for Other race residents35.8 38.4 52.5 Median age for Two or more races residents49.0 54.9 21.9 Median age for White alone residents32.4 20.5 48.9 Median age for Hispanic or Latino residents46.4 51.2
Owner/renter occupied households by race in Westchester
House owners and renters - White residents 3,928 73.4% Owner occupied1,423 26.6% Renter occupiedHouse owners and renters - Black or African American residents 130 40.8% Owner occupied189 59.2% Renter occupiedHouse owners and renters - American Indian / Alaska Native residents 10 100.0% Owner occupiedHouse owners and renters - Asian residents 41 23.0% Owner occupied137 77.0% Renter occupiedHouse owners and renters - Other race residents 376 68.5% Owner occupied173 31.5% Renter occupiedHouse owners and renters - Two or more races residents 8,711 67.1% Owner occupied4,277 32.9% Renter occupiedHouse owners and renters - White alone residents 777 81.0% Owner occupied182 19.0% Renter occupiedHouse owners and renters - Hispanic or Latino residents 11,510 68.7% Owner occupied5,255 31.3% Renter occupied
Language usage in Westchester
English speakers - Total 12.7% of residents of Westchester speak English at home.
84.9% of residents speak Spanish at home 21,855 50.2% Speak English very well21,644 49.8% Speak English less than very well2.2% of residents speak other language at home 815 71.4% Speak English very well327 28.6% Speak English less than very well
English speakers - Born in the United States 36.3% of residents of Westchester speak English at home.
55.9% of residents speak Spanish at home 2,219 92.9% Speak English very well170 7.1% Speak English less than very well9.4% of residents speak other language at home 156 38.9% Speak English very well245 61.1% Speak English less than very well
English speakers - Native, born elsewhere 19.7% of residents of Westchester speak English at home.
77.7% of residents speak Spanish at home 828 86.7% Speak English very well127 13.3% Speak English less than very well
English speakers - Foreign-born 4.0% of residents of Westchester speak English at home.
94.5% of residents speak Spanish at home 10,212 32.7% Speak English very well21,000 67.3% Speak English less than very well1.6% of residents speak other language at home 340 64.5% Speak English very well187 35.5% Speak English less than very well
White (Caucasian) - Speak only English Native:
36.6% (2,973)Foreign-born:
5.2% (351)
White (Caucasian) - Speak another language Native:
56.9% (4,628)Foreign-born:
93.2% (6,251)
Black or African American - Speak only English Native:
74.6% (888)Foreign-born:
30.5% (147)
Black or African American - Speak another language Native:
25.4% (303)Foreign-born:
69.7% (336)
Asian - Speak only English Native:
27.1% (125)Foreign-born:
28.4% (114)
Asian - Speak another language Native:
71.4% (329)Foreign-born:
69.7% (281)
Other race - Speak only English Native:
30.1% (258)Foreign-born:
4.8% (48)
Other race - Speak another language Native:
70.0% (600)Foreign-born:
95.2% (958)
Two or more races - Speak only English Native:
14.2% (1,107)Foreign-born:
2.9% (746)
Two or more races - Speak another language Native:
85.9% (6,684)Foreign-born:
96.9% (24,743)
White alone - Speak only English Native:
64.4% (1,960)Foreign-born:
20.4% (121)
White alone - Speak another language Native:
34.9% (1,061)Foreign-born:
78.1% (462)
Hispanic or Latino - Speak only English Native:
16.2% (2,213)Foreign-born:
2.8% (902)
Hispanic or Latino - Speak another language Native:
83.7% (11,420)Foreign-born:
97.1% (30,888)
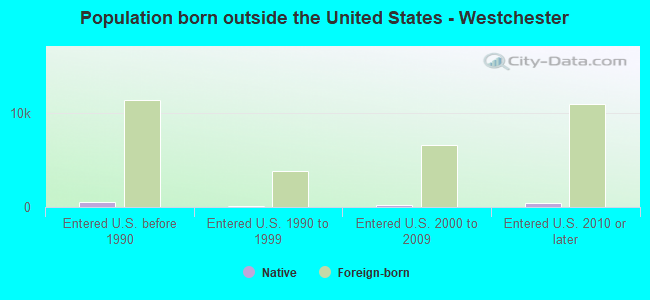
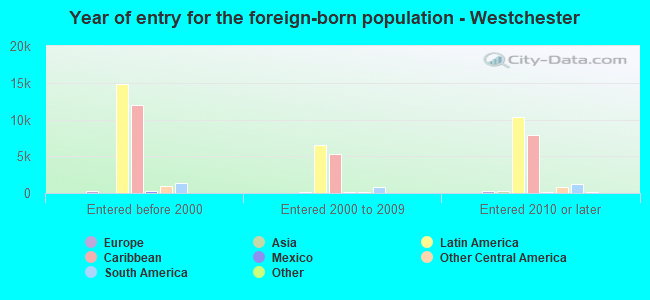
Foreign-born residents in Westchester 33,284 residents are foreign born (59.9% Latin America ).
This city:
62.2%Florida:
21.1%
Marital status for residents in Westchester Marital status - White (Caucasian) population 15 years and over
Males 35.9% Never married50.1% Now married1.7% Separated1.3% Widowed11.0% DivorcedFemales 37.4% Never married36.5% Now married2.1% Separated11.8% Widowed12.2% DivorcedWomen who gave birth in the past 12 months Now married:
19.8% (30)Unmarried:
80.2% (122)
Women who did not give birth in the past 12 months Now married:
31.2% (1,151)Unmarried:
68.8% (2,539)
Marital status - Black or African American population 15 years and over
Males 80.1% Never married10.1% Now married0.0% Separated4.3% Widowed5.6% DivorcedFemales 68.7% Never married11.5% Now married3.9% Separated0.7% Widowed15.1% DivorcedWomen who gave birth in the past 12 months Now married:
100.0% (6)Unmarried:
0.0% (0)
Women who did not give birth in the past 12 months Now married:
12.2% (74)Unmarried:
87.8% (535)
Marital status - American Indian / Alaska Native population 15 years and over
Males 100.0% Never married0.0% Now married0.0% Separated0.0% Widowed0.0% DivorcedFemales 66.7% Never married33.3% Now married0.0% Separated0.0% Widowed0.0% DivorcedWomen who did not give birth in the past 12 months Now married:
33.3% (14)Unmarried:
66.7% (29)
Marital status - Asian population 15 years and over
Males 67.9% Never married32.1% Now married0.0% Separated0.0% Widowed0.0% DivorcedFemales 59.2% Never married34.5% Now married0.0% Separated0.0% Widowed6.3% DivorcedWomen who gave birth in the past 12 months Now married:
100.0% (9)Unmarried:
0.0% (0)
Women who did not give birth in the past 12 months Now married:
22.2% (99)Unmarried:
77.8% (346)
Marital status - Other race population 15 years and over
Males 49.9% Never married48.3% Now married0.0% Separated0.0% Widowed1.8% DivorcedFemales 30.5% Never married46.3% Now married2.1% Separated7.2% Widowed13.9% DivorcedWomen who gave birth in the past 12 months Now married:
100.0% (14)Unmarried:
0.0% (0)
Women who did not give birth in the past 12 months Now married:
48.4% (173)Unmarried:
51.6% (184)
Marital status - Two or more races population 15 years and over
Males 33.0% Never married50.8% Now married3.6% Separated4.5% Widowed8.2% DivorcedFemales 25.1% Never married38.3% Now married2.6% Separated9.6% Widowed24.3% DivorcedWomen who gave birth in the past 12 months Now married:
100.0% (96)Unmarried:
0.0% (0)
Women who did not give birth in the past 12 months Now married:
34.5% (2,345)Unmarried:
65.5% (4,446)
Marital status - White alone, not Hispanic / Latino population 15 years and over
Males 49.2% Never married40.2% Now married1.8% Separated2.4% Widowed6.3% DivorcedFemales 63.6% Never married21.5% Now married2.2% Separated5.6% Widowed7.1% DivorcedWomen who gave birth in the past 12 months Now married:
0.0% (0)Unmarried:
100.0% (13)
Women who did not give birth in the past 12 months Now married:
16.3% (209)Unmarried:
83.7% (1,074)
Marital status - Hispanic or Latino population 15 years and over
Males 34.0% Never married51.0% Now married2.5% Separated2.8% Widowed9.7% DivorcedFemales 28.9% Never married39.1% Now married2.4% Separated11.0% Widowed18.6% DivorcedWomen who gave birth in the past 12 months Now married:
36.7% (119)Unmarried:
63.3% (204)
Women who did not give birth in the past 12 months Now married:
36.1% (3,526)Unmarried:
63.9% (6,248)
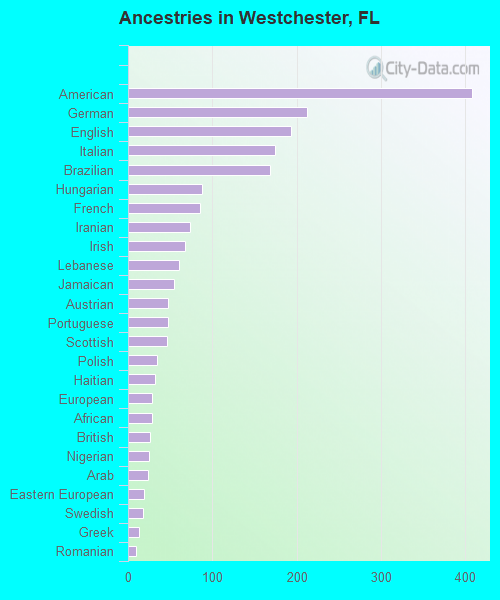
Ancestries in Westchester
408 1.1% American213 0.6% German194 0.5% English175 0.5% Italian169 0.5% Brazilian88 0.2% Hungarian86 0.2% French74 0.2% Iranian68 0.2% Irish61 0.2% Lebanese54 0.1% Jamaican48 0.1% Austrian47 0.1% Portuguese46 0.1% Scottish34 0.09% Polish32 0.09% Haitian28 0.08% European28 0.08% African26 0.07% British25 0.07% Nigerian24 0.06% Arab19 0.05% Eastern European18 0.05% Swedish13 0.04% Greek10 0.03% Romanian9 0.02% Scotch-Irish7 0.02% Russian3 0.01% Bahamian2 0.01% Dutch
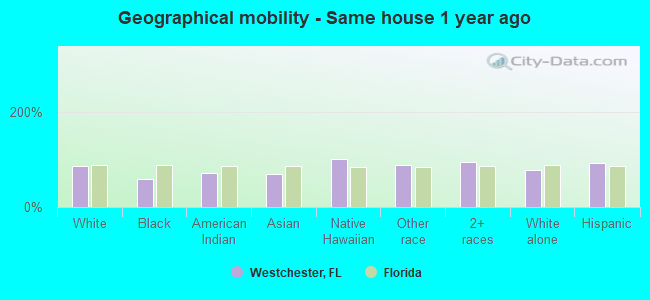
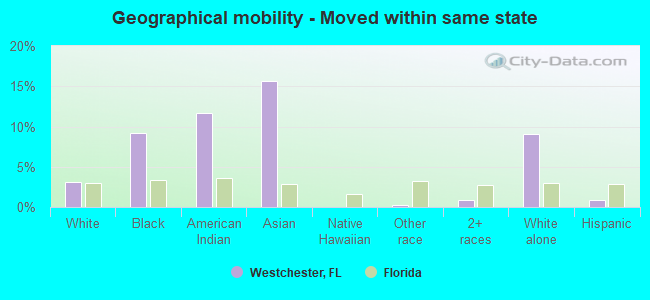
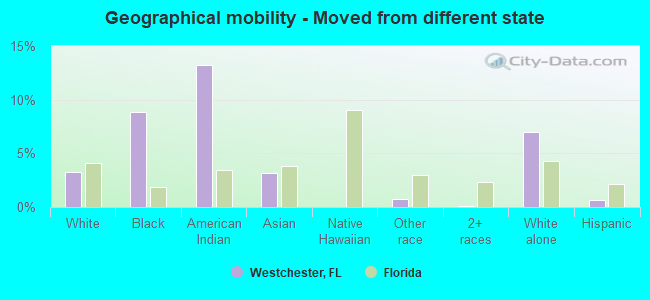
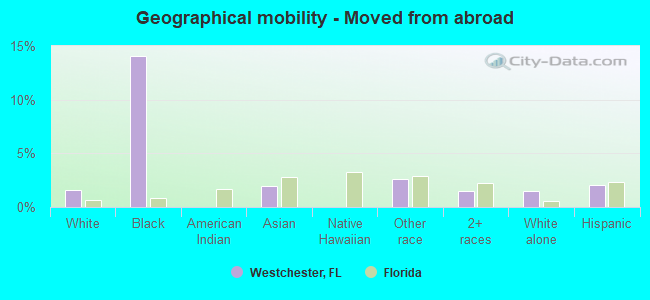
Geographical mobility in Westchester Same house 1 year ago 13,812 86.0% White (Caucasian)966 57.8% Black or African American65 71.8% American Indian / Alaska Native608 68.7% Asian33 100.0% Native Hawaiian / Pacific Islander1,626 87.0% Other race32,779 94.7% Two or more races3,073 77.4% White alone, not Hispanic / Latino43,277 91.6% Hispanic or LatinoMoved within same county 1,048 6.5% White / Caucasian231 13.8% Black or African American135 15.2% Asian161 8.6% Other race1,031 3.0% Two or more races166 4.2% White alone, not Hispanic / Latino2,285 4.8% Hispanic or LatinoMoved within same state 496 3.1% White / Caucasian154 9.2% Black or African American11 11.7% American Indian / Alaska Native138 15.6% Asian4 0.2% Other race302 0.9% Two or more races362 9.1% White alone, not Hispanic / Latino394 0.8% Hispanic or LatinoMoved from different state 527 3.3% White / Caucasian147 8.8% Black or African American12 13.3% American Indian / Alaska Native28 3.2% Asian14 0.7% Other race30 0.1% Two or more races278 7.0% White alone, not Hispanic / Latino306 0.6% Hispanic or LatinoMoved from abroad 253 1.6% White235 14.1% Black or African American17 1.9% Asian49 2.6% Other race507 1.5% Two or more races58 1.5% White alone, not Hispanic / Latino962 2.0% Hispanic or Latino
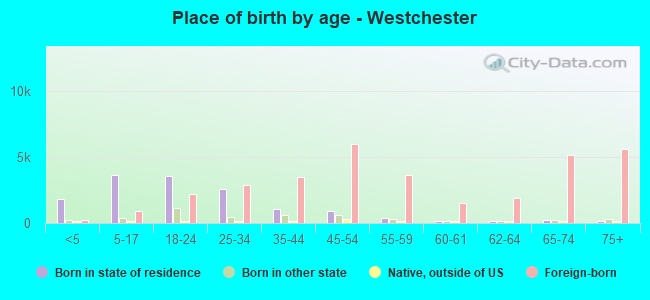
Children Nativity (place of birth) in Westchester
Children under 6 years - Living with two parents Both parents native 629 100.0% NativeBoth parents foreign-born 447 90.1% Native49 9.9% Foreign-bornOne native, one foreign-born parent 285 100.0% NativeChildren under 6 years - Living with one parent Native parent 236 98.5% Native4 1.5% Foreign-bornForeign-born parent 765 90.7% Native78 9.3% Foreign-bornChildren 6 to 17 years - Living with two parents Both parents native 581 99.1% Native5 0.9% Foreign-bornBoth parents foreign-born 811 59.5% Native552 40.5% Foreign-bornOne native, one foreign-born parent 763 97.2% Native22 2.8% Foreign-bornChildren 6 to 17 years - Living with one parent Native parent 203 100.0% NativeForeign-born parent 1,034 57.5% Native766 42.5% Foreign-born
Grandparents responsible for own grandchildren in Westchester
Grandparents (30 to 59 years) White / Caucasian 4 2.4% Responsible for grandchildren174 97.6% Not responsible for grandchildrenAsian 9 100.0% Not responsible for grandchildrenOther race 24 100.0% Not responsible for grandchildrenTwo or more races 54 20.7% Responsible for grandchildren209 79.3% Not responsible for grandchildrenHispanic or Latino 36 8.4% Responsible for grandchildren395 91.6% Not responsible for grandchildrenGrandparents (60 years and over) White / Caucasian 41 14.4% Responsible for grandchildren245 85.6% Not responsible for grandchildrenOther race 10 100.0% Not responsible for grandchildrenTwo or more races 935 100.0% Not responsible for grandchildrenHispanic or Latino 43 4.7% Responsible for grandchildren882 95.3% Not responsible for grandchildren